Statistics hub · Updated October 2026
Pet Statistics 2026: 140+ Facts on US Pets, Owners, Spending and Care
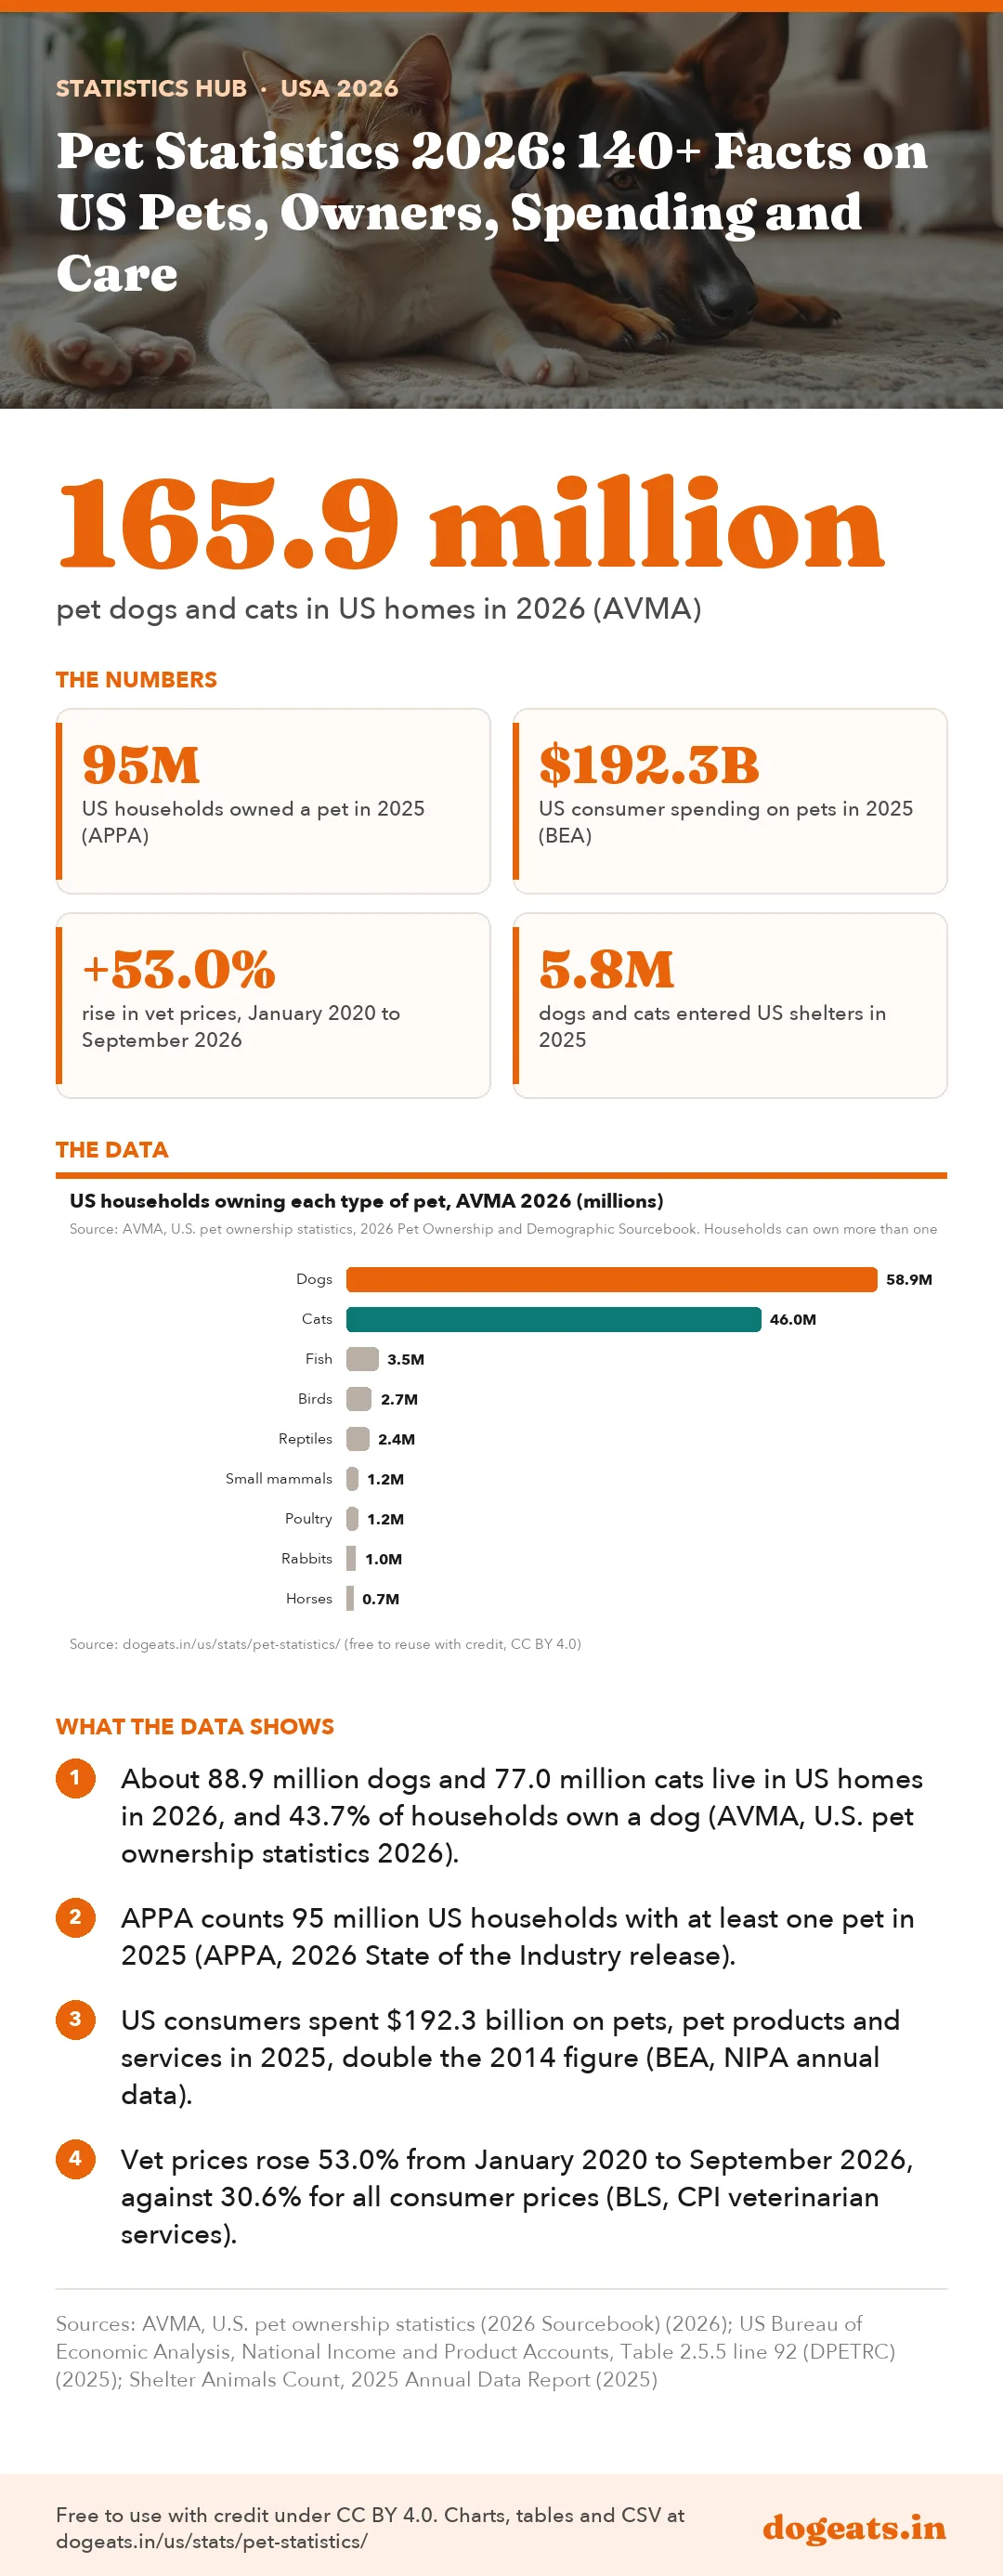
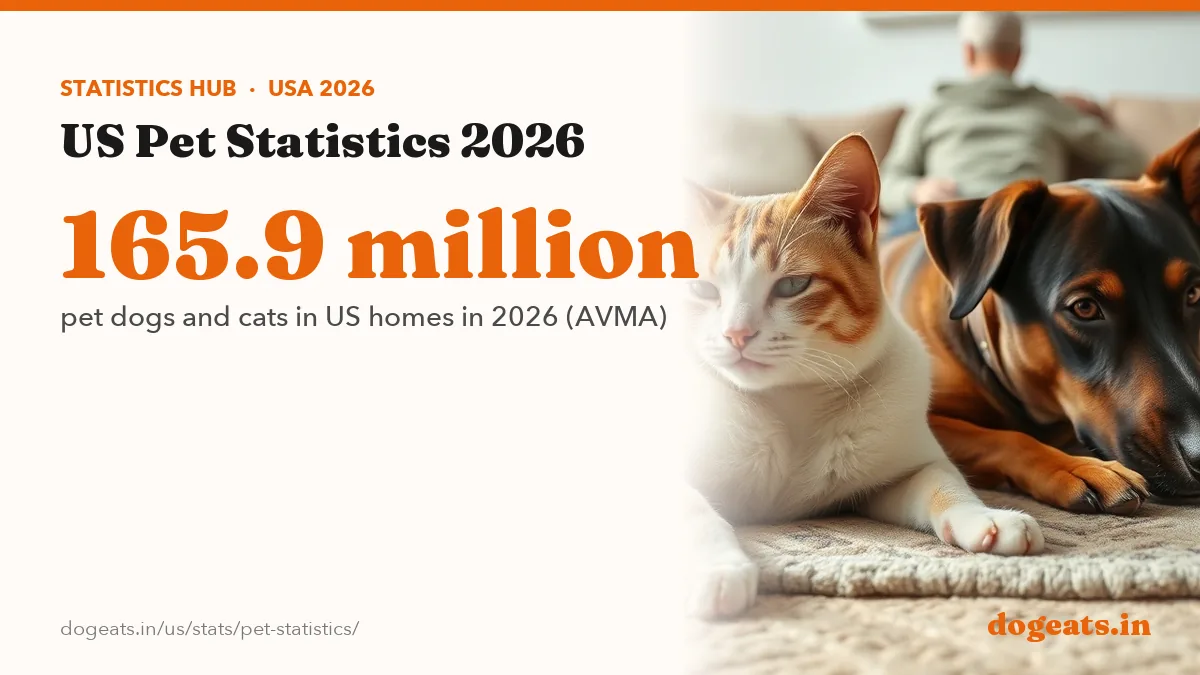
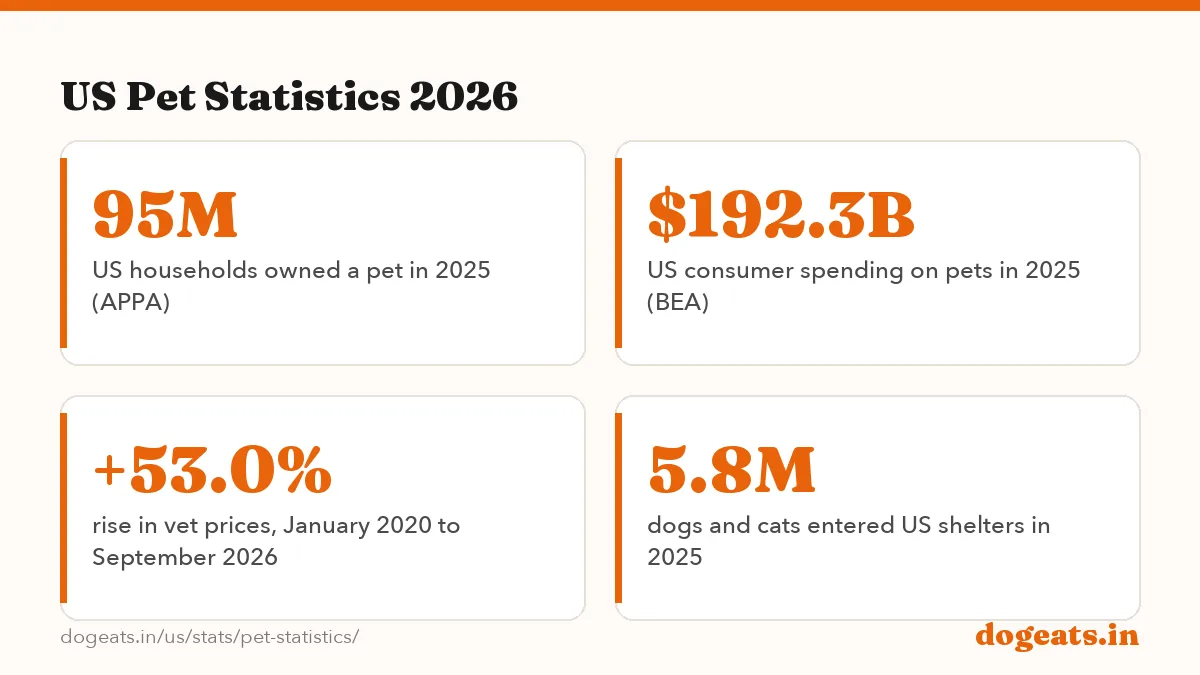
About 88.9 million dogs and 77.0 million cats live in US homes in 2026, the AVMA estimates, and APPA counts 95 million households with a pet. This hub collects 146 dated US pet statistics, each linked to its primary source, from ownership and spending to vet care, insurance, shelters, housing and health.

Key findings
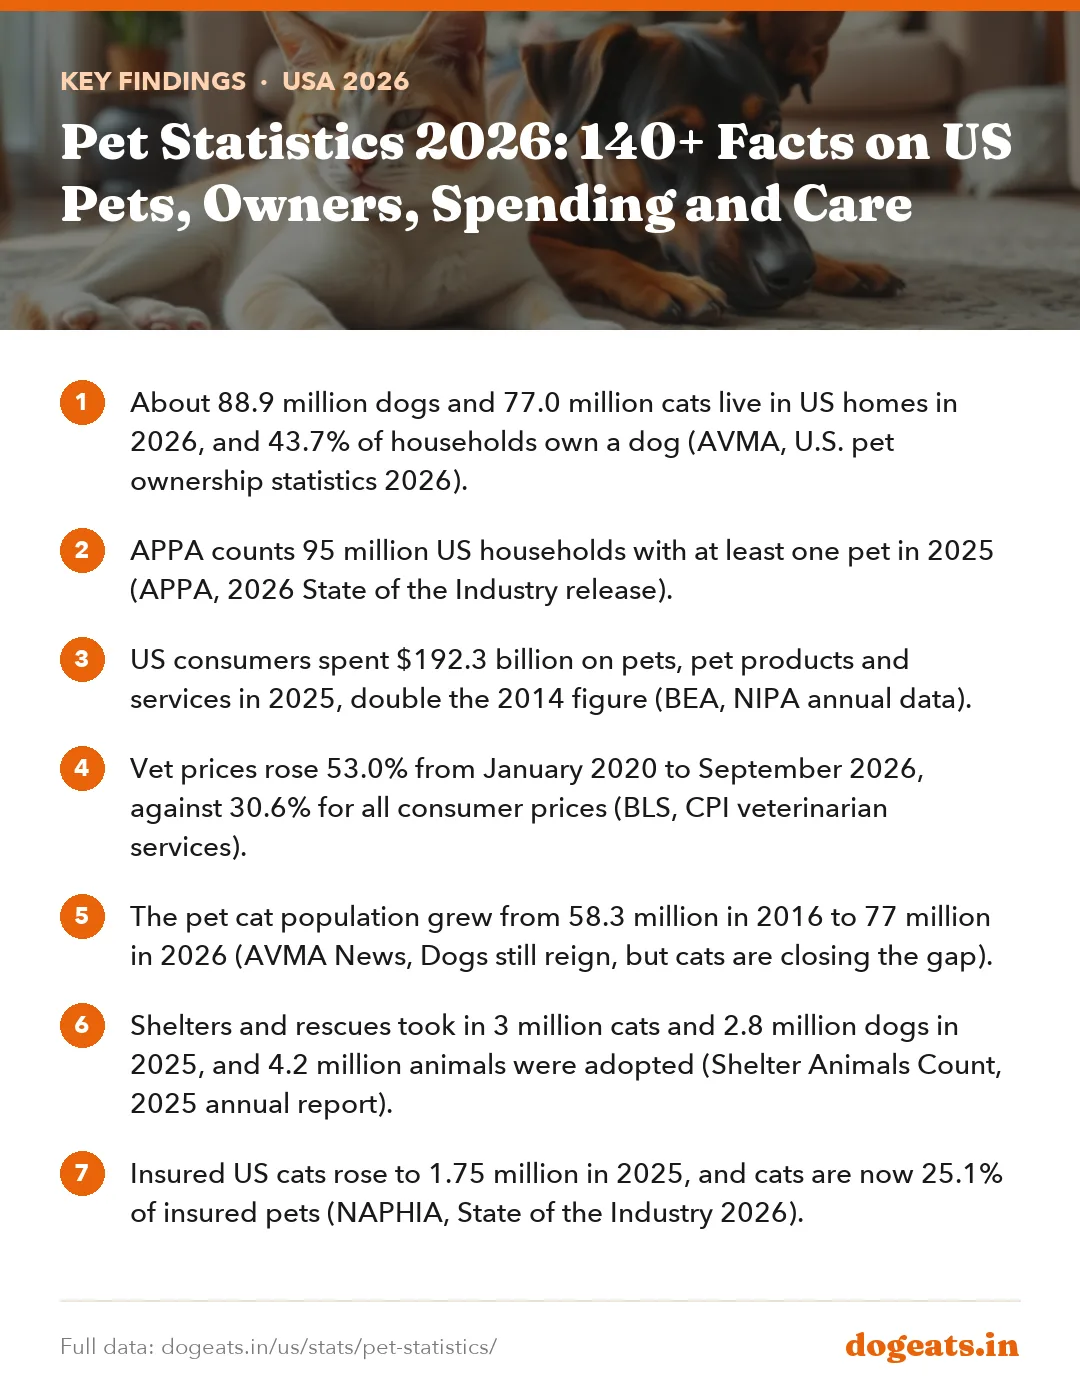
- About 88.9 million dogs and 77.0 million cats live in US homes in 2026, and 43.7% of households own a dog (AVMA, U.S. pet ownership statistics 2026).
- APPA counts 95 million US households with at least one pet in 2025 (APPA, 2026 State of the Industry release).
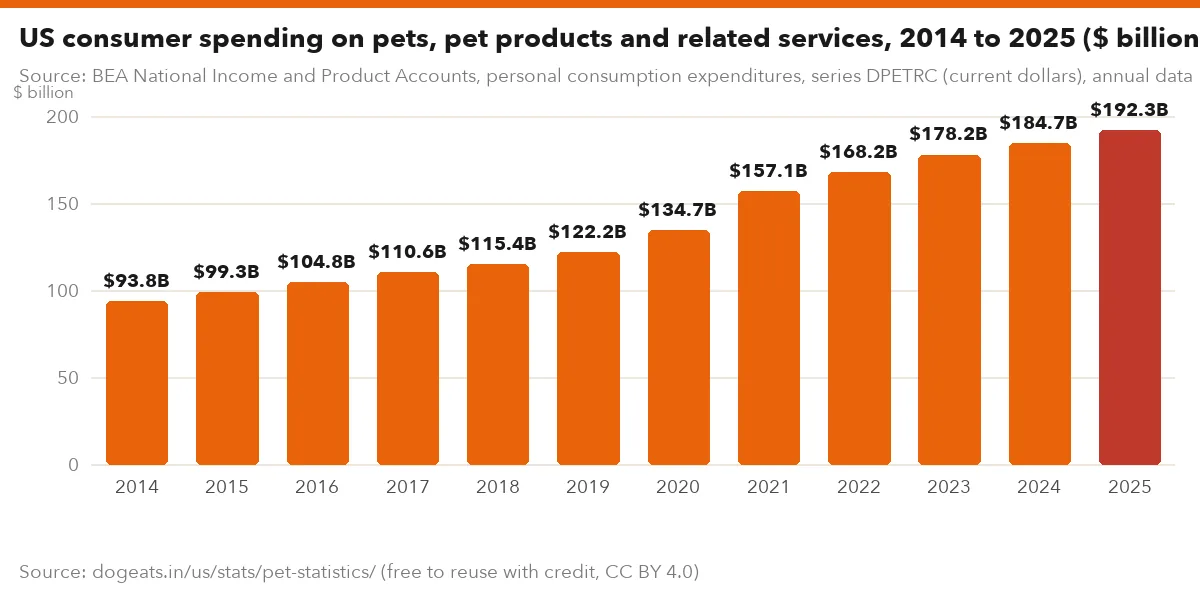
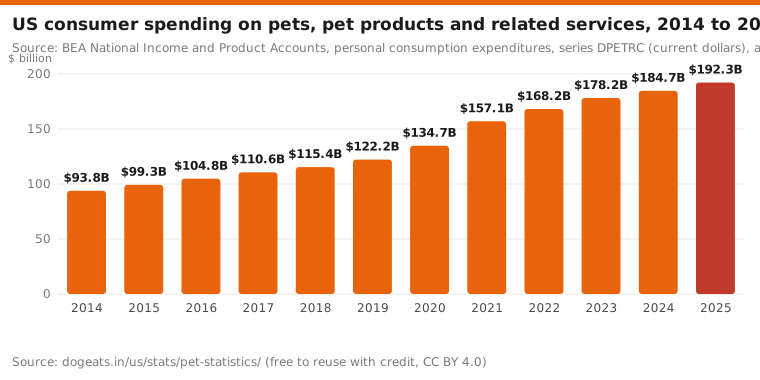
- US consumers spent $192.3 billion on pets, pet products and services in 2025, double the 2014 figure (BEA, NIPA annual data).
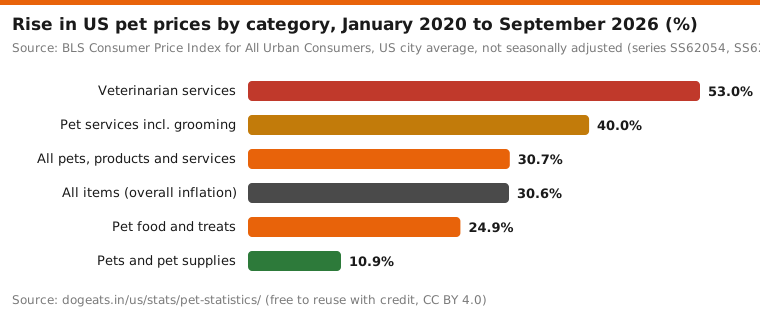
- Vet prices rose 53.0% from January 2020 to September 2026, against 30.6% for all consumer prices (BLS, CPI veterinarian services).
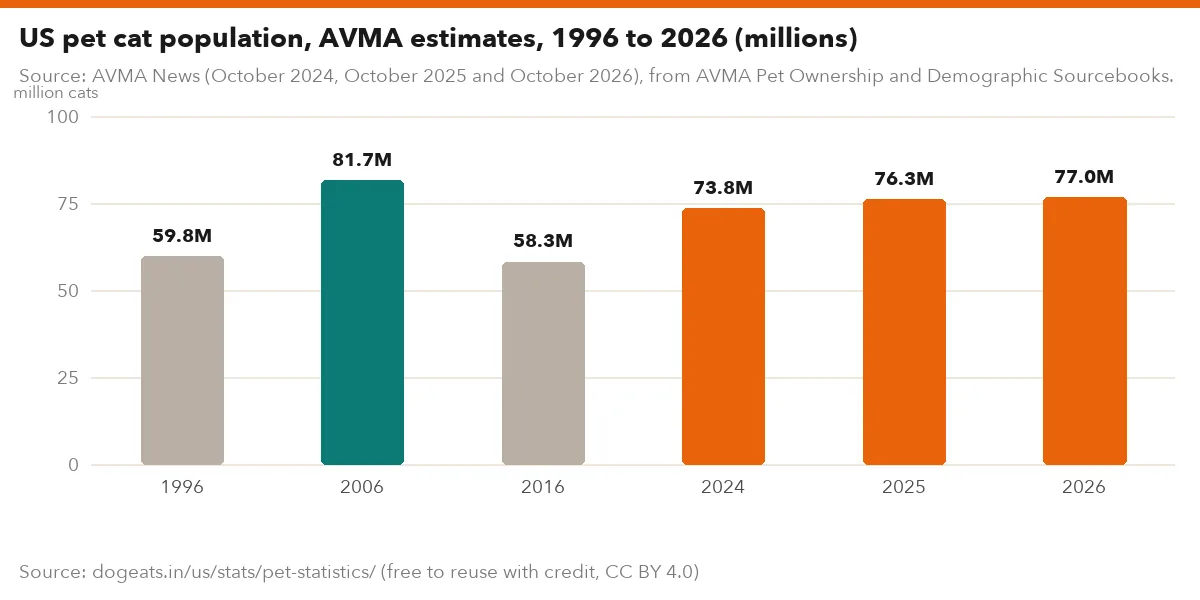
- The pet cat population grew from 58.3 million in 2016 to 77 million in 2026 (AVMA News, Dogs still reign, but cats are closing the gap).
- Shelters and rescues took in 3 million cats and 2.8 million dogs in 2025, and 4.2 million animals were adopted (Shelter Animals Count, 2025 annual report).
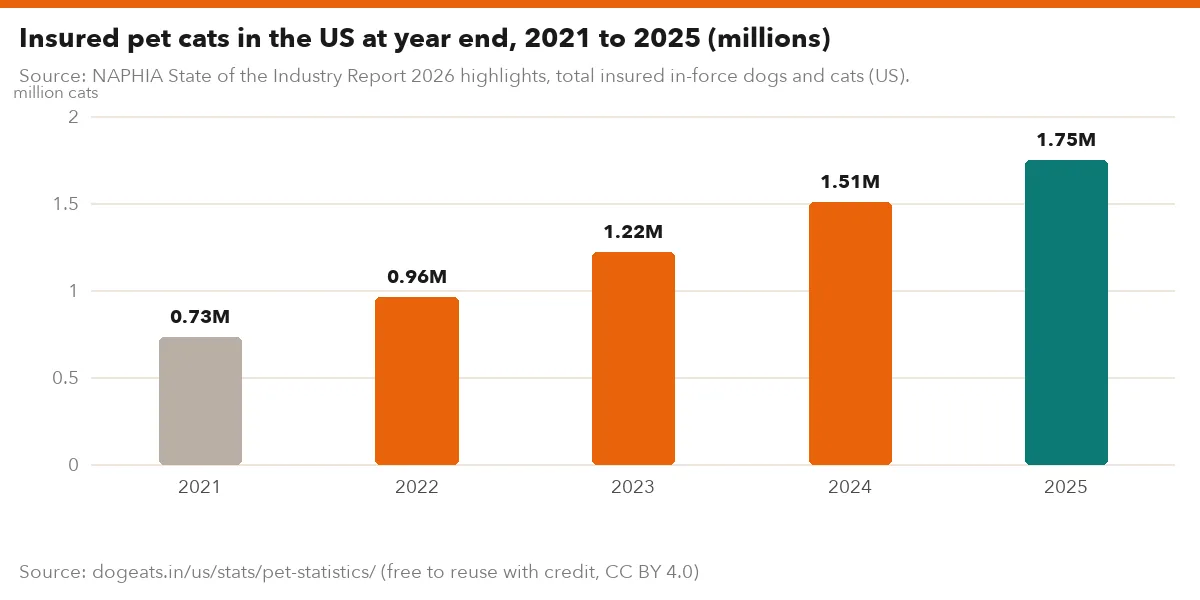
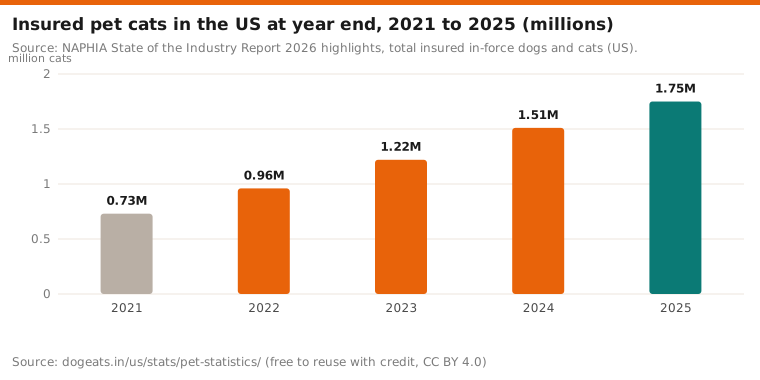
- Insured US cats rose to 1.75 million in 2025, and cats are now 25.1% of insured pets (NAPHIA, State of the Industry 2026).
- The richest fifth of households spent $1,861 on pets in 2024, five times the poorest fifth (BLS, Consumer Expenditure Survey by income, 2024).
- 59% of renter households have a pet, and 77% of Zillow rental listings allow pets (Zillow Research, Most pet-friendly rental markets, 2026).
- 559 people in 48 states caught Salmonella from backyard poultry in the 2025 outbreaks (CDC, Salmonella outbreaks linked to backyard poultry).
How many pets are in the US?
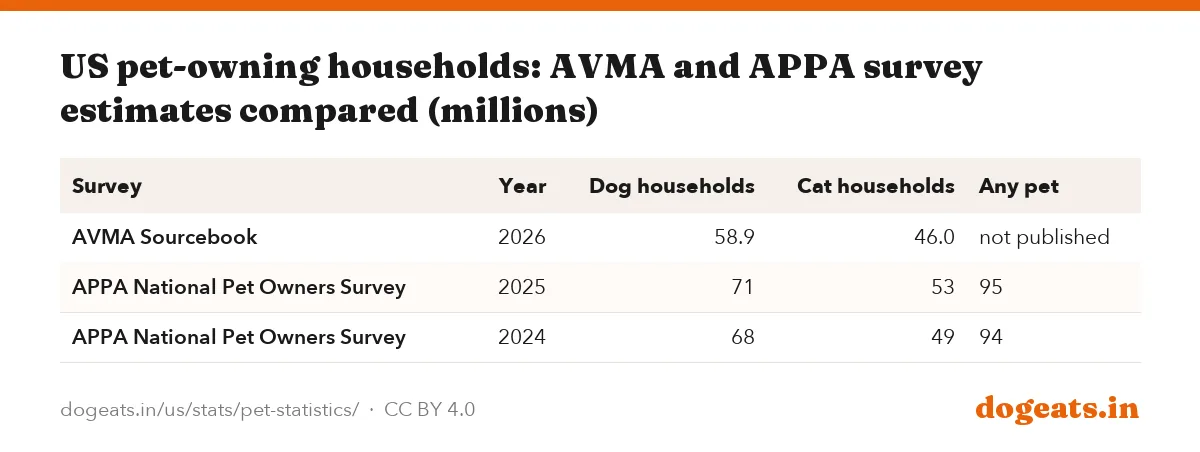
About 88.9 million dogs and 77.0 million cats live in US homes in 2026, the AVMA estimates, and 43.7% of households own a dog. APPA's survey counts more pet homes, 95 million in 2025, because it asks about any pet and uses a different panel. For dogs alone, see our US dog statistics hub.
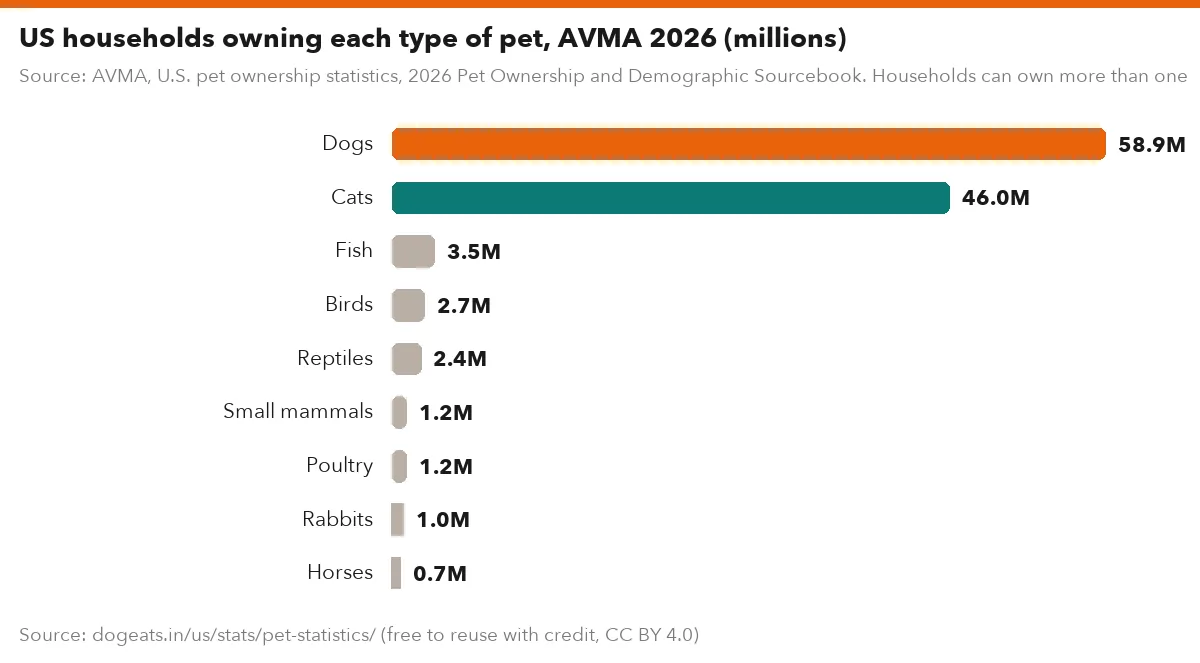
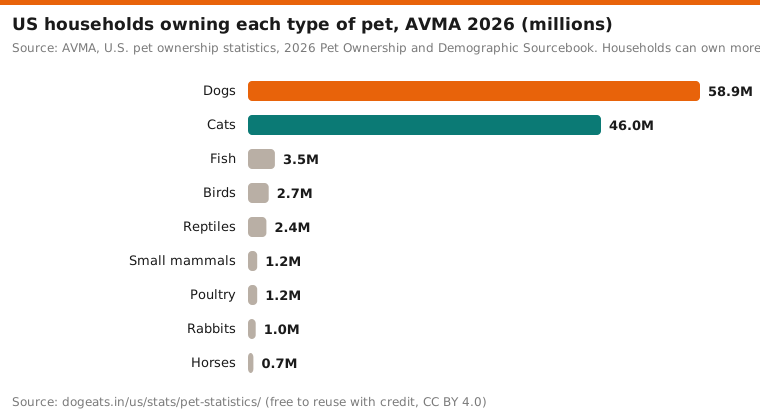
- 58.9 million US households owned a dog and 46.0 million owned a cat in 2026, or 43.7% and 34.1% of all homes (AVMA, U.S. pet ownership statistics 2026).
- 88.9 million pet dogs and 77.0 million pet cats lived in US homes in 2026, the AVMA estimates from a survey of 7,547 people (AVMA, U.S. pet ownership statistics 2026).
- 95 million US households owned at least one pet in 2025, according to APPA's National Pet Owners Survey (APPA State of the Industry, 2026).
- 71 million households had a dog in 2025 (53%) and 53 million had a cat (39%), APPA's survey found (APPA State of the Industry, 2026).
- 62% of US adults owned a pet in 2023, and 97% of pet owners called their pets part of the family (Pew Research Center, pets survey, 2023).
- 48.5 pet dogs and cats live in the US for every 100 residents: 165.9 million animals against 341.8 million people in July 2025 (US Census Bureau, Vintage 2025 population estimates).
- 19.5% of Americans 15 and older cared for, walked or played with animals on an average day in 2025, for 0.74 hours (BLS, American Time Use Survey table A-1, 2025).
- 23.0% of women and 15.8% of men did pet care on an average day in 2025, BLS time diaries show (BLS, American Time Use Survey table A-1, 2025).
- 94 million households owned a pet in 2024 by APPA's count, up from 82 million in 2023 (APPA State of the Industry, 2025).
- 41% of pet owners had just one pet, and 54% of pet-owning households included children 17 or younger, AVMA data for 2025 show (AVMA News, pet data, October 2025).
Source: AVMA, U.S. pet ownership statistics, 2026 Pet Ownership and Demographic Sourcebook. Households can own more than one type of pet. AVMA lists fish at 3.5 million households but 3.4% of households. On the roughly 135 million households behind the other rows, 3.5 million would be about 2.6%, so the two fish figures do not agree.
Show the numbers
| Label | million households |
|---|---|
| Dogs | 58.9M |
| Cats | 46.0M |
| Fish | 3.5M |
| Birds | 2.7M |
| Reptiles | 2.4M |
| Small mammals | 1.2M |
| Poultry | 1.2M |
| Rabbits | 1.0M |
| Horses | 0.7M |
Embed this chart
| Survey | Year | Dog households | Cat households | Any pet |
|---|---|---|---|---|
| AVMA Sourcebook | 2026 | 58.9 | 46.0 | not published |
| APPA National Pet Owners Survey | 2025 | 71 | 53 | 95 |
| APPA National Pet Owners Survey | 2024 | 68 | 49 | 94 |
Pet ownership by generation, income and region
Rural Americans and higher-income households are the most likely to keep pets and spend the most on them. Gen Z and Gen X drove most of the growth in 2025. Our pet spending by generation report tracks each age group since 2019.
- 71% of adults in rural areas owned a pet in 2023, more than in suburbs or cities (Pew Research Center, pets survey, 2023).
- 68% of White adults and 66% of Hispanic adults owned a pet in 2023, against 37% of Asian and 34% of Black adults (Pew Research Center, pets survey, 2023).
- 19.7% of dog-owning and 18.4% of cat-owning households earned $50,000 to $74,999 in 2026, the largest income group for both (AVMA News, pet data, October 2026).
- 12% more Gen X households owned pets in 2025 than in 2024; Gen X bird ownership rose 25% and reptiles 20% (APPA State of the Industry, 2026).
- 33% of reptile owners are Gen Z, while millennials make up 46% of saltwater fish owners (APPA Fish and Reptile Report, 2025).
- 39% of horse owners are millennials, and Gen Z now makes up 34% of small animal owners (APPA Bird, Small Animal and Horse Report, 2025).
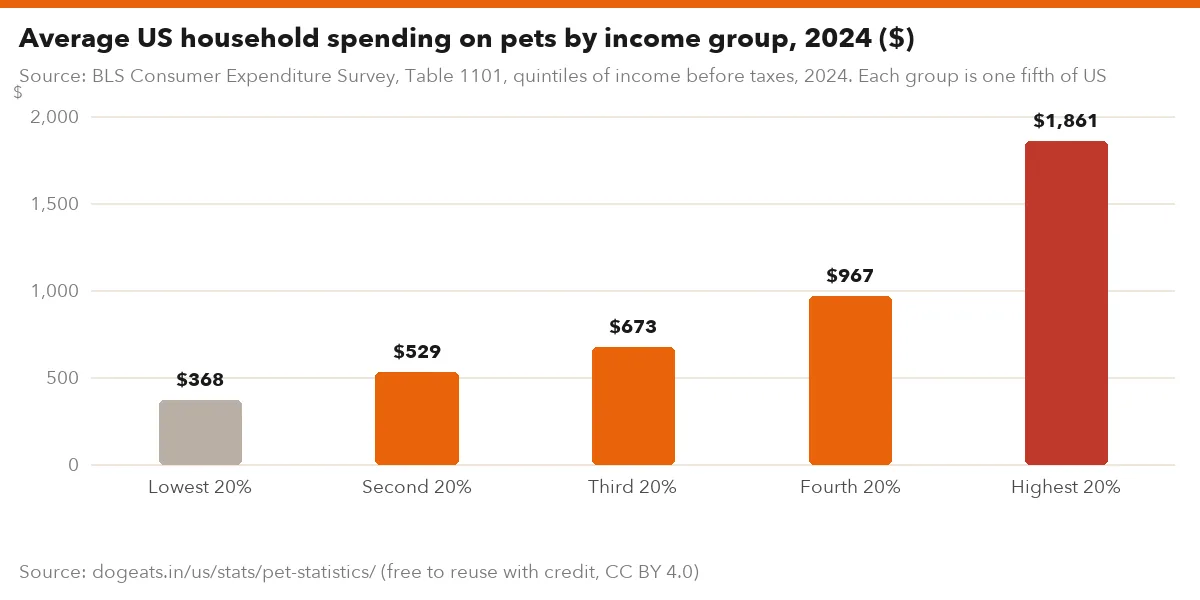
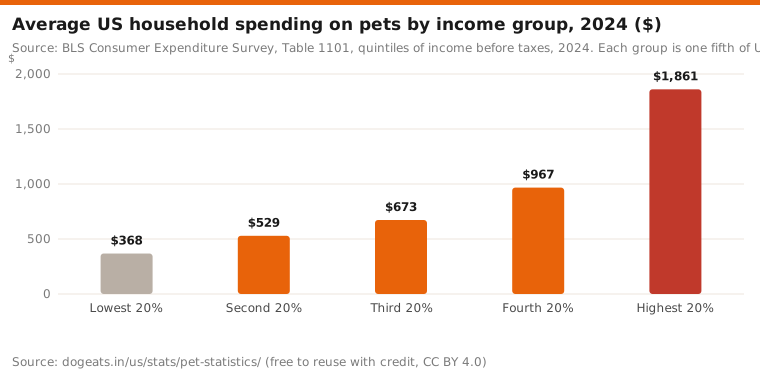
- $1,861 a year went on pets in the richest fifth of households in 2024, five times the $368 spent by the poorest fifth (BLS Consumer Expenditure Survey, 2024).
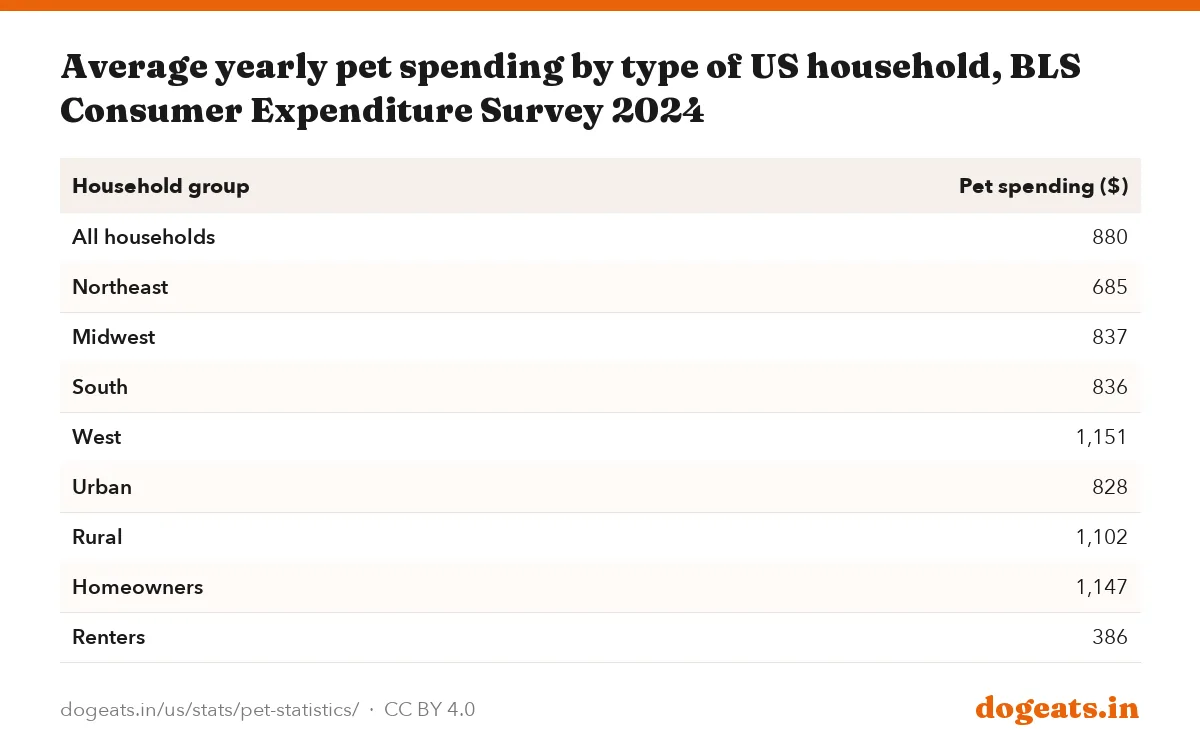
- $1,151 was the average pet spend of households in the West in 2024, against $685 in the Northeast and $836 in the South (BLS, Consumer Expenditure Survey by region, 2024).
- $1,102 a year on pets made rural households bigger spenders than urban ones ($828) in 2024; central-city households spent $685 (BLS, Consumer Expenditure Survey by area type, 2024).
- $1,027 went on pets in 2024 in households headed by White and other races, against $410 in Asian and $218 in Black households (BLS Consumer Expenditure Survey, race tables 2024).
- 20% of pet-owning households, 18.8 million, were Gen Z in 2024, and 70% of Gen Z owners had two or more pets (APPA State of the Industry, 2025).
Source: BLS Consumer Expenditure Survey, Table 1101, quintiles of income before taxes, 2024. Each group is one fifth of US households.
Show the numbers
| Label | $ |
|---|---|
| Lowest 20% | $368 |
| Second 20% | $529 |
| Third 20% | $673 |
| Fourth 20% | $967 |
| Highest 20% | $1,861 |
Embed this chart
| Household group | Pet spending ($) |
|---|---|
| All households | 880 |
| Northeast | 685 |
| Midwest | 837 |
| South | 836 |
| West | 1,151 |
| Urban | 828 |
| Rural | 1,102 |
| Homeowners | 1,147 |
| Renters | 386 |
Cat statistics: population, owners and care
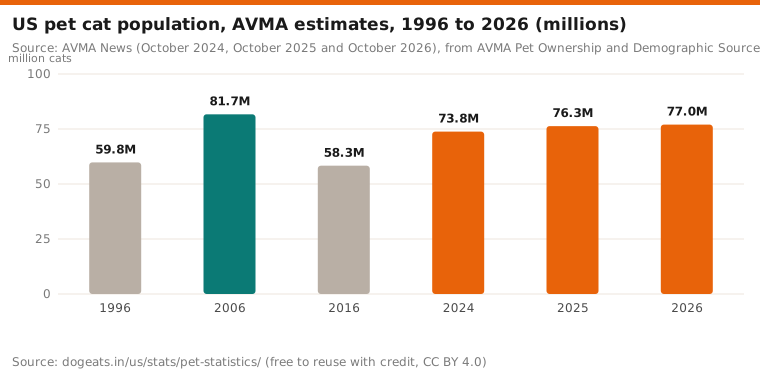
Cats are gaining on dogs. The AVMA counts 77 million pet cats in 2026, up from 58.3 million in 2016, and more new pet owners are choosing a cat. Cat owners still see the vet less often than dog owners.

- 77 million pet cats lived in US homes in 2026, up from 58.3 million in 2016; dogs rose from 76.8 million to 88.9 million (AVMA News, pet data, October 2026).
- 6.1 points was the 2025 to 2026 rise in the share of recent pet acquirers who got a cat, against 4.1 points for dogs (AVMA News, pet data, October 2026).
- 81.7 million cats in 2006 is still the peak of the AVMA series; the count was 73.8 million in 2024 (AVMA News, pet data, October 2024).
- 43% of US cat owners are men, and Gen Z makes up 22% of cat owners, APPA's 2026 Cat Report found (APPA Cat Report, 2026).
- $337.53 was the average amount cat owners spent on cat food in 2025, up 9% on the year (APPA Cat Report, 2026).
- 45% more US households kept three or more cats in 2025 than in 2018, APPA reports (APPA Cat Report, 2026).
- 57.3% of cat owners visited a vet in 2024, against 74.2% of dog owners, and 77.1% said they had a regular vet (AVMA News, pet data, October 2024).
- $202 was the average reported cost of a cat owner's last vet visit in 2025, up from $138 in 2024; dog owners reported $220 (AVMA News, pet data, October 2025).
- $850 to $4,400 a year is what an adult cat costs, and the first year $705 to $2,960, in Rover's 2026 company estimates (Rover, Cost of Cat Parenthood 2026).
- 1.3 to 4.0 billion birds and 6.3 to 22.3 billion mammals are killed yearly by free-roaming US cats, mostly unowned, a 2013 study estimated (Loss et al., Nature Communications 2013).
- 243 cats tested positive for rabies in the US in 2024, the most of any domestic animal, out of 331 rabid domestic animals (JAVMA, US rabies surveillance 2024).
- Lilies were the No. 1 cat poison on Pet Poison Helpline's list for 2025, ahead of onions and related plants (Pet Poison Helpline, Top 10 pet poisons of 2025).
Source: AVMA News (October 2024, October 2025 and October 2026), from AVMA Pet Ownership and Demographic Sourcebooks. Only the years AVMA published in those articles are shown.
Show the numbers
| Label | million cats |
|---|---|
| 1996 | 59.8M |
| 2006 | 81.7M |
| 2016 | 58.3M |
| 2024 | 73.8M |
| 2025 | 76.3M |
| 2026 | 77.0M |
Embed this chart
Fish, birds, reptiles, small animals and horses
Several million US homes keep fish, birds, reptiles, rabbits or horses. APPA's counts run higher than the AVMA's because the surveys define ownership differently. Horses are counted separately by the Census of Agriculture and the horse industry.
- 3.5 million households kept fish in 2026, 2.7 million birds, 2.4 million reptiles, 1.2 million small mammals, 1.0 million rabbits and 0.7 million horses (AVMA, U.S. pet ownership statistics 2026).
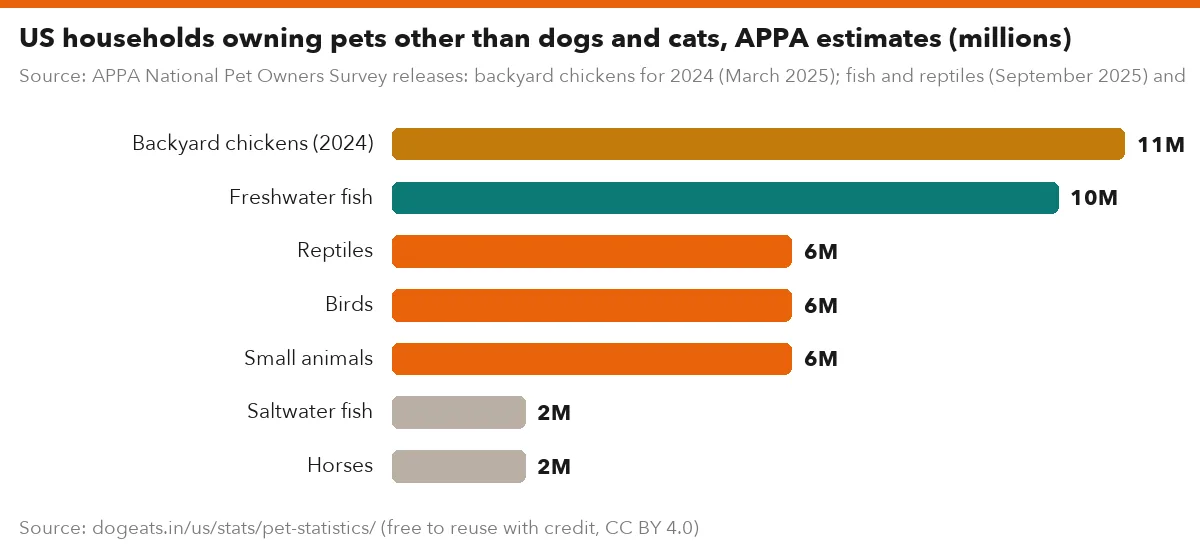
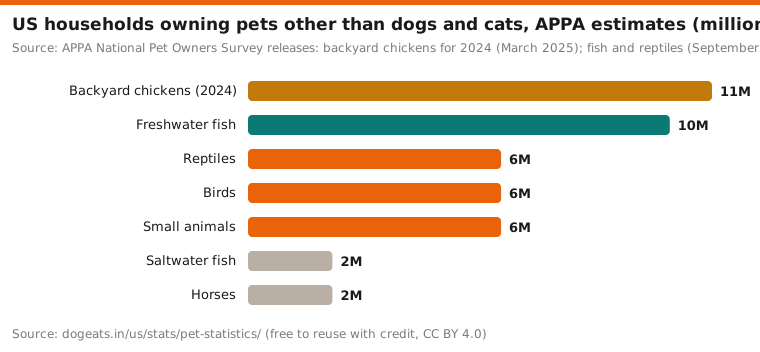
- 10 million US households kept freshwater fish in 2025, 6 million kept reptiles and 2 million saltwater fish, APPA estimates (APPA Fish and Reptile Report, 2025).
- 43% of reptile owners keep turtles or tortoises, 29% other lizards and 22% snakes, APPA's 2025 survey found (APPA Fish and Reptile Report, 2025).
- 6 million households own birds, 6 million own small animals and 2 million own horses, APPA reported in December 2025 (APPA Bird, Small Animal and Horse Report, 2025).
- 37% of small animal owners have a rabbit, 23% guinea pigs and 18% hamsters; hamster ownership is down 25% since 2018 (APPA Bird, Small Animal and Horse Report, 2025).
- 6.65 million horses live in the US, and the horse industry added $177 billion to the economy in 2023, the American Horse Council estimates (American Horse Council, 2023 study).
- 2,411,232 horses and ponies were counted on 372,810 US farms in the 2022 Census of Agriculture, which covers farms only (USDA NASS, 2022 Census of Agriculture, Table 29).
- 11 million US households kept backyard chickens in 2024, up 28% from 2023 as egg prices rose, APPA found (APPA State of the Industry, 2025).
Source: APPA National Pet Owners Survey releases: backyard chickens for 2024 (March 2025); fish and reptiles (September 2025) and birds, small animals and horses (December 2025) for 2025.
Show the numbers
| Label | million households |
|---|---|
| Backyard chickens (2024) | 11M |
| Freshwater fish | 10M |
| Reptiles | 6M |
| Birds | 6M |
| Small animals | 6M |
| Saltwater fish | 2M |
| Horses | 2M |
Embed this chart
How much do Americans spend on pets?
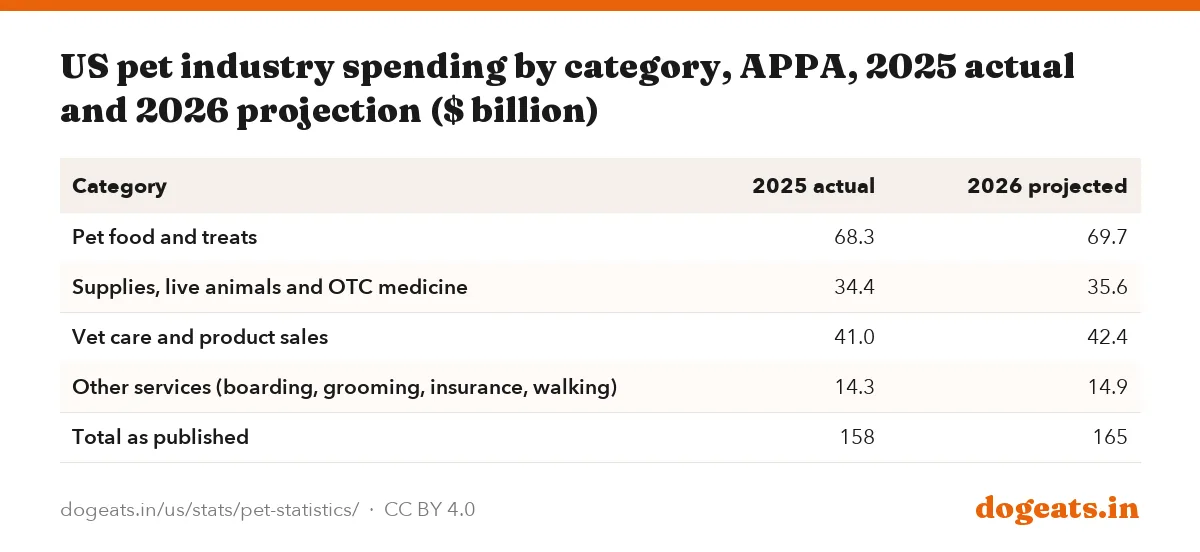
Americans spent between $119 billion and $192 billion on pets in recent years, depending on who is counting. The government's consumer spending accounts give the widest total; APPA's industry estimate was $158 billion for 2025. Our US pet industry spending report compares the series year by year.
- $158 billion went on US pets in 2025, APPA estimates, including $68.3 billion on food and $41.0 billion on vet care and products (APPA, Industry trends and stats).
- $165 billion is APPA's projection for 2026 US pet spending, including $35.6 billion on supplies, live animals and medicine (APPA, Industry trends and stats).
- $192.3 billion went on pets, pet products and related services in 2025 in the official consumer spending accounts, up from $93.8 billion in 2014 (BEA, NIPA annual data, series DPETRC).
- $116.0 billion of 2025 consumer pet spending went on pets and related products and $76.2 billion on veterinary and other pet services (BEA, NIPA underlying detail, series DPRPRC and DVETRC).
- $880 was the average US household's pet spending in 2024, adding up to $119.2 billion across all households (BLS, Consumer Expenditure Survey, pets series).
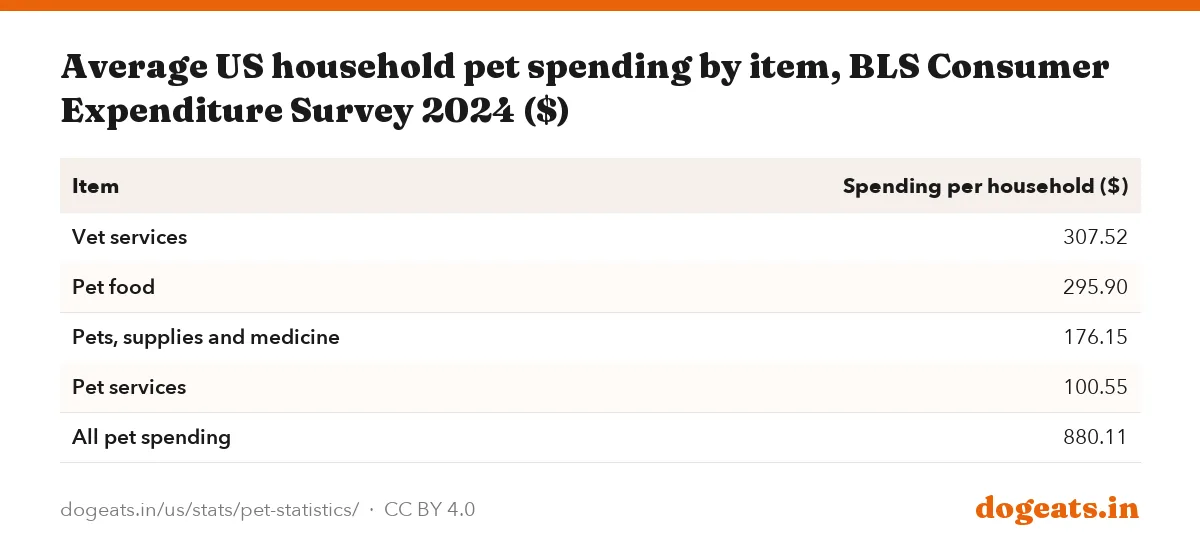
- $307.52 went on vet services, $295.90 on pet food, $176.15 on pets and supplies and $100.55 on pet services per household in 2024 (BLS, Consumer Expenditure Survey detailed items, 2024).
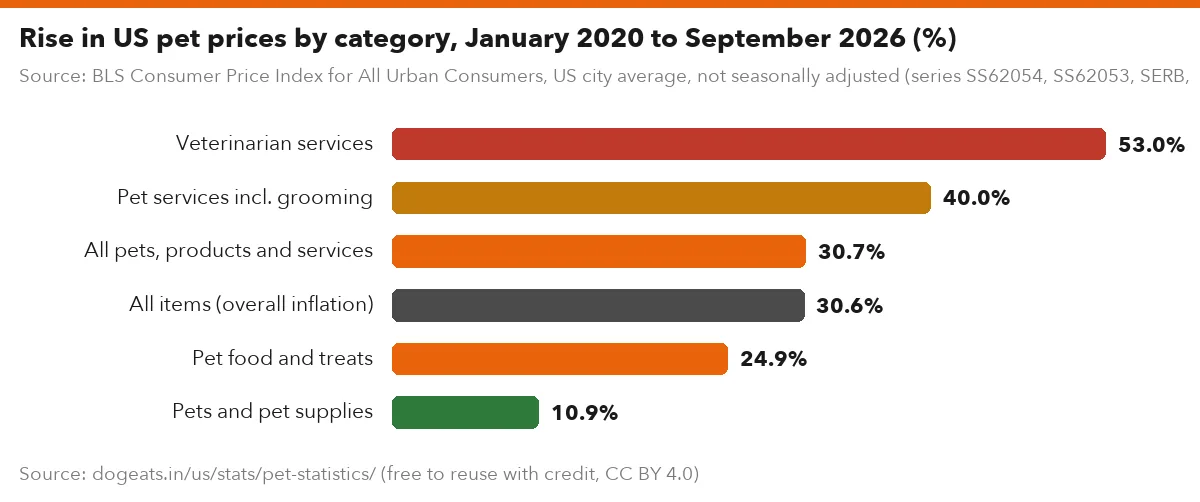
- 30.7% was the rise in pet product and service prices from January 2020 to September 2026, near overall inflation of 30.6% (BLS CPI, pets; BLS CPI, all items).
- 40.0% was the rise in pet services prices, such as grooming and boarding, from January 2020 to September 2026; the 12-month rise was 3.6% (BLS, CPI pet services).
- 0.1% was the 12-month change in prices for pets and pet supplies to September 2026, the flattest of the pet price indexes (BLS, CPI pets and pet supplies).
- 83.3% of Chewy's $12.6 billion fiscal 2025 sales came from Autoship repeat orders, worth $10.5 billion (Chewy, Form 10-K for fiscal 2025).
- $1,802.0 million in fiscal 2025 sales came from Central Garden and Pet's pet segment, including $460.8 million of wild bird products (Central Garden and Pet, Form 10-K for fiscal 2025).
- 25,551 pet care businesses other than vets, such as groomers and boarders, employed 175,116 people in 2023; 9,921 pet stores employed 122,102 (US Census Bureau, County Business Patterns 2023).
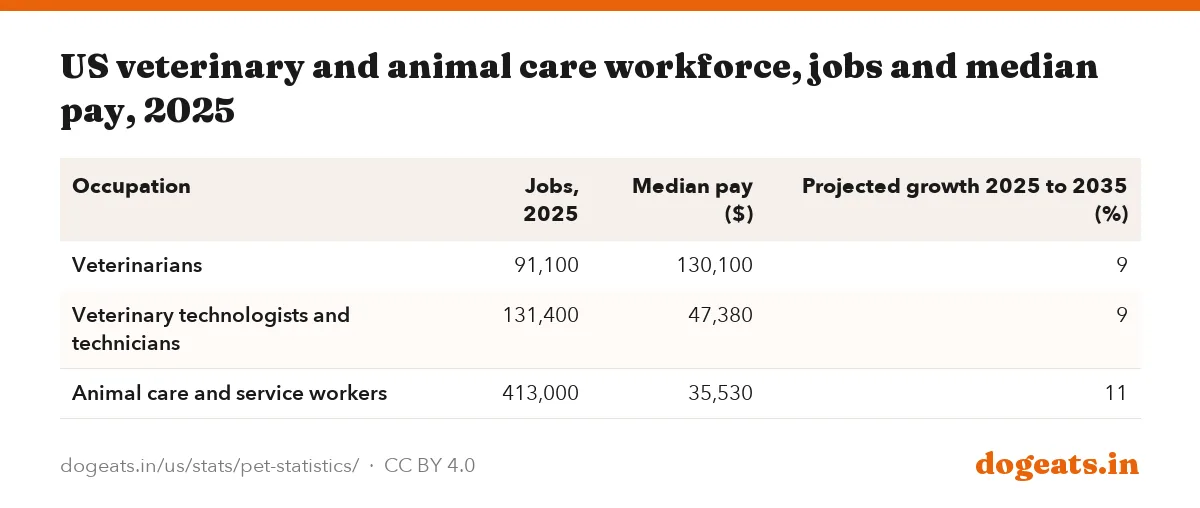
- 413,000 people worked in animal care and service jobs in 2025 at a median $35,530, with 11% growth projected by 2035 (BLS, Occupational Outlook Handbook).
Source: BEA National Income and Product Accounts, personal consumption expenditures, series DPETRC (current dollars), annual data file of September 30, 2026.
Show the numbers
| Label | $ billion |
|---|---|
| 2014 | $93.8B |
| 2015 | $99.3B |
| 2016 | $104.8B |
| 2017 | $110.6B |
| 2018 | $115.4B |
| 2019 | $122.2B |
| 2020 | $134.7B |
| 2021 | $157.1B |
| 2022 | $168.2B |
| 2023 | $178.2B |
| 2024 | $184.7B |
| 2025 | $192.3B |
Embed this chart
| Category | 2025 actual | 2026 projected |
|---|---|---|
| Pet food and treats | 68.3 | 69.7 |
| Supplies, live animals and OTC medicine | 34.4 | 35.6 |
| Vet care and product sales | 41.0 | 42.4 |
| Other services (boarding, grooming, insurance, walking) | 14.3 | 14.9 |
| Total as published | 158 | 165 |
| Item | Spending per household ($) |
|---|---|
| Vet services | 307.52 |
| Pet food | 295.90 |
| Pets, supplies and medicine | 176.15 |
| Pet services | 100.55 |
| All pet spending | 880.11 |
APPA's 2026 category projections add up to $162.6 billion, below its $165 billion headline. We show both as published.
Pet food sales, prices and safety
Food is the largest single item in APPA's pet spending total, and pet food prices rose about a quarter from 2020 to 2026. Raw diets carry the highest contamination risk in FDA testing. Our pet food recalls report lists every FDA-classified dog and cat food recall since 2017.
- 24.9% was the rise in pet food and treat prices from January 2020 to September 2026; the 12-month rise was 1.5% (BLS, CPI pet food and treats).
- 451 dog and cat food plants employed 30,393 people in the US in 2023 (US Census Bureau, County Business Patterns 2023, NAICS 311111).
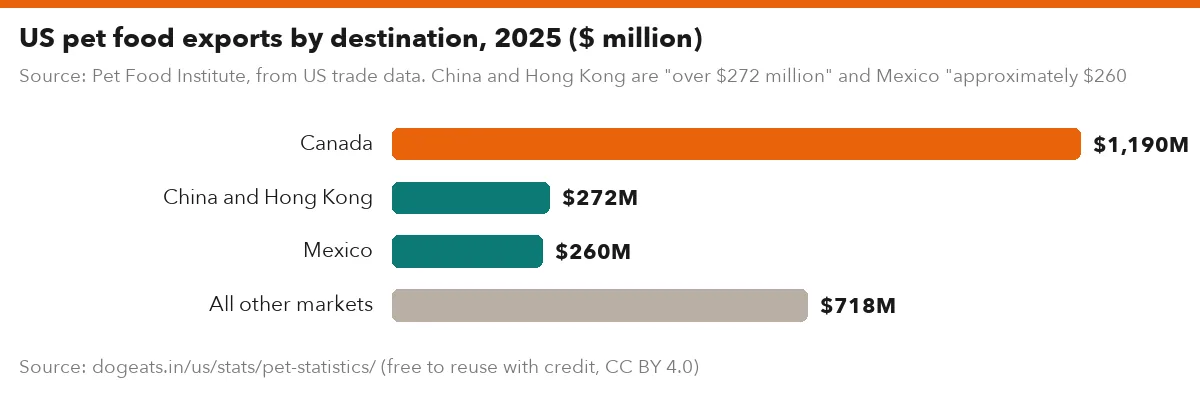
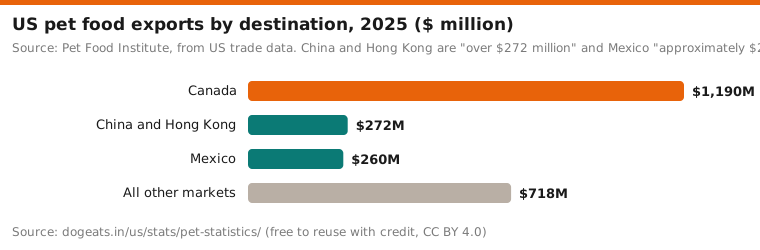
- $2.44 billion of US pet food was exported in 2025, down 3.5%, and Canada bought $1.19 billion of it (Pet Food Institute, US pet food exports in 2025).
- $8.78 billion of Chewy's fiscal 2025 sales were consumables such as food and litter, up 4.5% (Chewy, Form 10-K for fiscal 2025).
- 13.0% sales growth took fresh pet food maker Freshpet to $1,102.0 million in 2025 (Freshpet, Form 10-K for 2025).
- 32 of 196 raw pet food samples had Listeria and 15 Salmonella in 2010 to 2012 FDA tests, against 1 positive in 860 other samples (FDA raw pet food study).
- 110 pets had died and more than 210 were sick after eating aflatoxin-contaminated Midwestern Pet Foods products, FDA said in January 2021 (FDA, Sportmix aflatoxin alert, 2021).
- 4 states, California, Colorado, Oregon and Washington, had food-linked H5N1 cases in cats when FDA told pet food makers to plan for the virus (FDA, H5N1 pet food update).
- 140 boxes of raw chicken cat food were recalled by Savage Pet in March 2025 because they could contain H5N1 bird flu (FDA, Savage Pet cat food recall, March 2025).
Source: Pet Food Institute, from US trade data. China and Hong Kong are "over $272 million" and Mexico "approximately $260 million" as published; all other markets is our subtraction from the $2.44 billion total.
Show the numbers
| Label | $ million |
|---|---|
| Canada | $1,190M |
| China and Hong Kong | $272M |
| Mexico | $260M |
| All other markets | $718M |
Embed this chart
Vet care costs and the veterinary workforce
Vet bills have risen faster than any other pet cost since 2020, and visits have not kept pace with revenue. The US has about 133,000 veterinarians and more vet technicians than vet jobs. See our vet cost and pet food inflation report and veterinarians by state for state detail.

- 53.0% was the rise in veterinarian prices from January 2020 to September 2026, against 30.6% for all consumer prices; the 12-month rise was 4.6% (BLS, CPI veterinarian services).
- $76.2 billion went on veterinary and other pet services in 2025 in the national accounts, double the $36.8 billion of 2015 (BEA, NIPA underlying detail, series DVETRC).
- 133,475 veterinarians were counted in the US at the end of 2025, and 91,889 of them, or 68.8%, were women (AVMA, U.S. veterinarian numbers 2025).
- 91,100 veterinarian jobs existed in 2025 at a median pay of $130,100, and employment is projected to grow 9% by 2035 (BLS, Occupational Outlook Handbook, veterinarians).
- 131,400 veterinary technologist and technician jobs existed in 2025, more than vet jobs, with a median pay of $47,380 (BLS, Occupational Outlook Handbook, vet techs).
- 34,296 veterinary practices employed 475,106 people in the US in 2023, with a payroll of $25.2 billion (US Census Bureau, County Business Patterns 2023, NAICS 541940).
- $227,588 was the average vet school debt of 2026 graduates who borrowed, against average full-time starting pay of $131,784 (AVMA News, New veterinary graduates face rising debt, 2026).
- 2.7% a year was the average growth in first-year seats at US veterinary colleges from 2016 to 2026, the AAVMC reports (AAVMC, Annual Data Report 2025 to 2026).
- Three quarters of US counties appeared in state vet shortage nominations to USDA at least once from 2010 to 2026 (USDA ERS, EIB-311, 2026).
- $4,220 million of 2025 US companion animal revenue was reported by animal health company Zoetis, out of $6,587 million worldwide (Zoetis, Form 10-K for 2025).
- $2,300 million of Elanco's 2025 revenue came from pet health products, up 7% on the year (Elanco, Form 10-K for 2025).
- $3.41 billion in 2025 worldwide recurring companion animal diagnostics revenue was reported by IDEXX, up 8.9% (IDEXX, Form 10-K for 2025).
- About 300 full-service vet hospitals and 1,600 weekly Vetco clinics ran inside Petco's network as of January 2026 (Petco, Form 10-K for fiscal 2025).
- 2.7% fewer client visits went to vet practices from August 2021 to August 2023, while revenue rose 5.7% on average (AVMA News, November 2023).
- 83.4% of pet owners said they had a regular vet, but only 69.4% had visited a practice in 2024, AVMA data show (AVMA News, pet data, October 2025).
Source: BLS Consumer Price Index for All Urban Consumers, US city average, not seasonally adjusted (series SS62054, SS62053, SERB, SA0, SS61031, SS61032). Our calculation from the January 2020 and September 2026 index values.
Show the numbers
| Label | % |
|---|---|
| Veterinarian services | 53.0% |
| Pet services incl. grooming | 40.0% |
| All pets, products and services | 30.7% |
| All items (overall inflation) | 30.6% |
| Pet food and treats | 24.9% |
| Pets and pet supplies | 10.9% |
Embed this chart
| Occupation | Jobs, 2025 | Median pay ($) | Projected growth 2025 to 2035 (%) |
|---|---|---|---|
| Veterinarians | 91,100 | 130,100 | 9 |
| Veterinary technologists and technicians | 131,400 | 47,380 | 9 |
| Animal care and service workers | 413,000 | 35,530 | 11 |
Pet insurance statistics
About 7 million US dogs and cats were insured at the end of 2025, and cats are the fastest-growing group. Only about 2% of the AVMA's 77.0 million pet cats are covered. Our pet insurance statistics report breaks premiums down by state and plan type.
- 5.23 million dogs and 1.75 million cats were insured in the US at the end of 2025; cats were 25.1% of insured pets (NAPHIA, 2026 report).
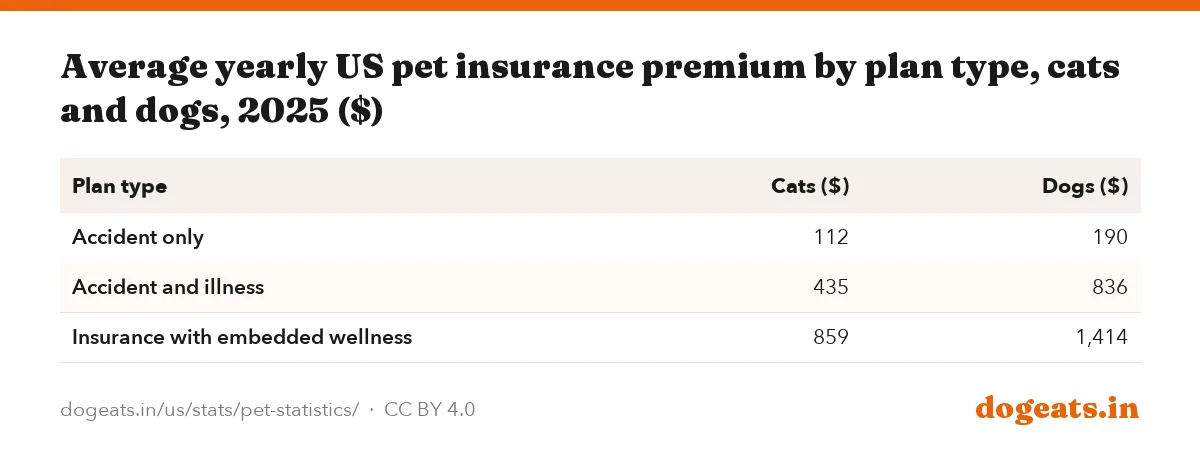
- $836 was the average yearly accident and illness premium for a US dog in 2025 and $435 for a cat, up 11.5% and 12.6% (NAPHIA, 2026 report).
- 18.1% of all insured US pets live in California, followed by New York at 7.4% and Florida at 6.2% (NAPHIA, 2026 report).
- 7.6 million pets were insured across North America at the end of 2025, up 8.5% from 7.03 million in 2024, NAPHIA reports (NAPHIA, Industry data, State of the Industry 2026).
- $6.15 billion in North American in-force pet insurance premium was written in 2025, up 19.4% from $5.15 billion in 2024 (NAPHIA, State of the Industry 2026 highlights).
- 1,647,565 pets were enrolled with insurer Trupanion at the end of 2025, down from 1,677,570 a year earlier (Trupanion, Form 10-K for 2025).
- $80.79 a month was Trupanion's average revenue per subscription pet in 2025, up from $72.98 in 2024 (Trupanion, Form 10-K for 2025).
- 30 days is the longest illness waiting period allowed under the NAIC Pet Insurance Model Act of 2022, which bans waiting periods for accidents (NAIC, Pet Insurance Model Act, 2022).
- 15 days is the free-look window the NAIC model gives buyers to return a pet insurance policy for a full refund (NAIC, Pet Insurance Model Act, 2022).
- $2.17 billion in North American pet insurance premiums was in force in 2020; the market more than doubled to $5.15 billion by 2024 (NAPHIA, 2025 report).
Source: NAPHIA State of the Industry Report 2026 highlights, total insured in-force dogs and cats (US).
Show the numbers
| Label | million cats |
|---|---|
| 2021 | 0.73M |
| 2022 | 0.96M |
| 2023 | 1.22M |
| 2024 | 1.51M |
| 2025 | 1.75M |
Embed this chart
Shelter and adoption statistics for dogs and cats
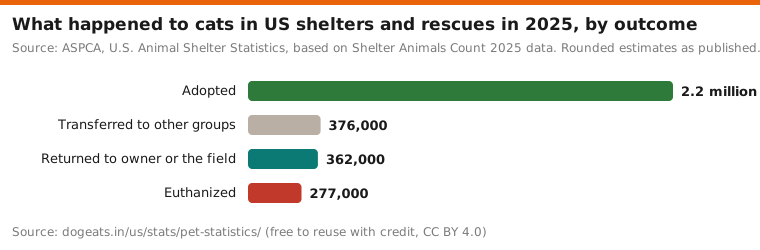
More cats than dogs now enter and leave US shelters, and adoption is the most common way out for both. Counts differ between Shelter Animals Count and the advocacy group Best Friends because they use different datasets. Our shelter euthanasia by state report ranks every state.

- 5.8 million dogs and cats entered US shelters and rescues in 2025, 3 million cats and 2.8 million dogs; 59% were strays (Shelter Animals Count, 2025 report).
- 4.2 million shelter animals were adopted in 2025, 2.2 million cats and 2 million dogs, equal to 63% of cat and 57% of dog intakes (Shelter Animals Count, 2025 report).
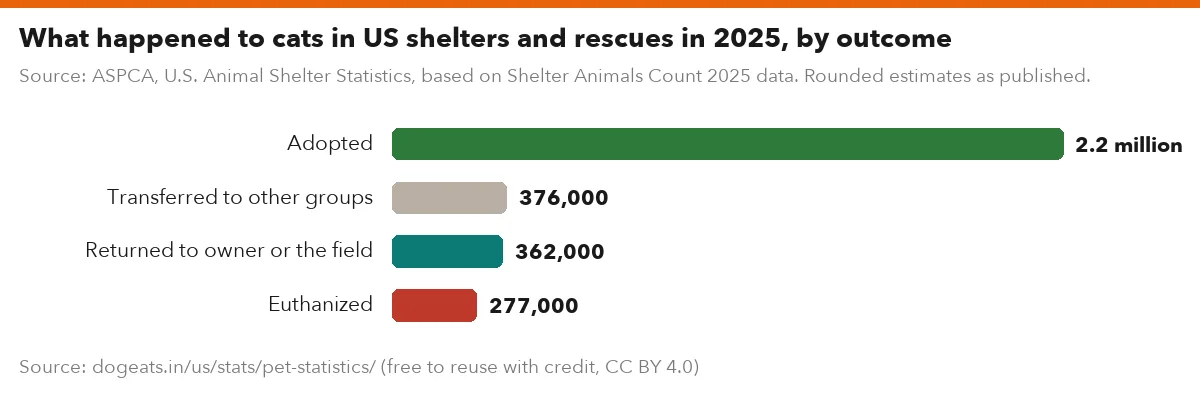
- 597,000 shelter animals were euthanized in 2025, 320,000 dogs and 277,000 cats (Shelter Animals Count, 2025 report).
- 8% of shelter animals were euthanized in 2025, down from 10% in 2019, the ASPCA reports from Shelter Animals Count data (ASPCA, US animal shelter statistics).
- 362,000 cats went back to their owner or the field in 2025 and 376,000 were transferred to other groups (ASPCA, US animal shelter statistics).
- 6 times as likely: stray dogs were returned to their owners about six times as often as stray cats in 2025 (Shelter Animals Count, 2025 annual report PDF).
- 638,000 dogs and cats were returned to their owners from shelters in 2025, 21,000 fewer than in 2024 (Shelter Animals Count, Data drop on age and reunification).
- 71% of kittens arrived at shelters as strays in 2025, and under 2% of juvenile cats go back to owners (Shelter Animals Count, reunification data drop).
- 72% of cat and 68% of dog community outcomes were adoptions in January to June 2026 (Shelter Animals Count, 2026 mid-year data summary).
- 82.9% of cats leaving shelters in 2025 were saved, a record, against 82.2% of dogs, by advocacy group Best Friends' count (Best Friends, 2025 national data).
- More than 2 out of 3 US shelters reached no-kill, meaning a 90% save rate, in 2025 by advocacy group Best Friends' measure (Best Friends Animal Society, Pet lifesaving dashboard).
- 15% of cats and 14% of dogs were lost within five years in a 2012 US survey; 93% of dogs but 75% of cats were found (Weiss et al., 2012).
- 58.1% of microchipped shelter animals were actually registered in a chip database in a 2009 study of 7,704 animals (Lord et al., JAVMA 2009).
Source: ASPCA, U.S. Animal Shelter Statistics, based on Shelter Animals Count 2025 data. Rounded estimates as published.
Show the numbers
| Label | cats |
|---|---|
| Adopted | 2.2 million |
| Transferred to other groups | 376,000 |
| Returned to owner or the field | 362,000 |
| Euthanized | 277,000 |
Embed this chart
Pets in rental housing
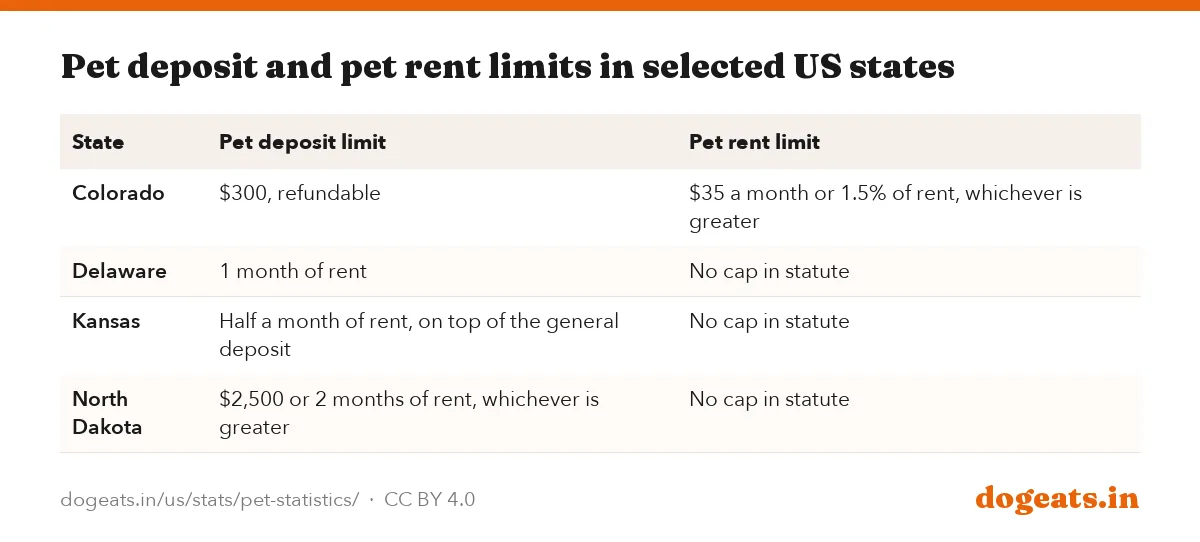
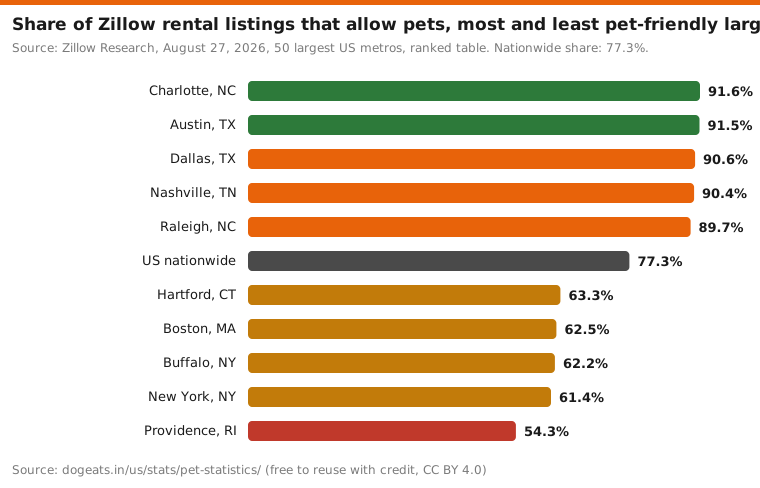
Most US renters now have pets, and most rental listings accept them, but deposits and pet rent vary by state. A handful of states cap what landlords may charge. Our pet rent and deposit laws by state guide covers each statute.
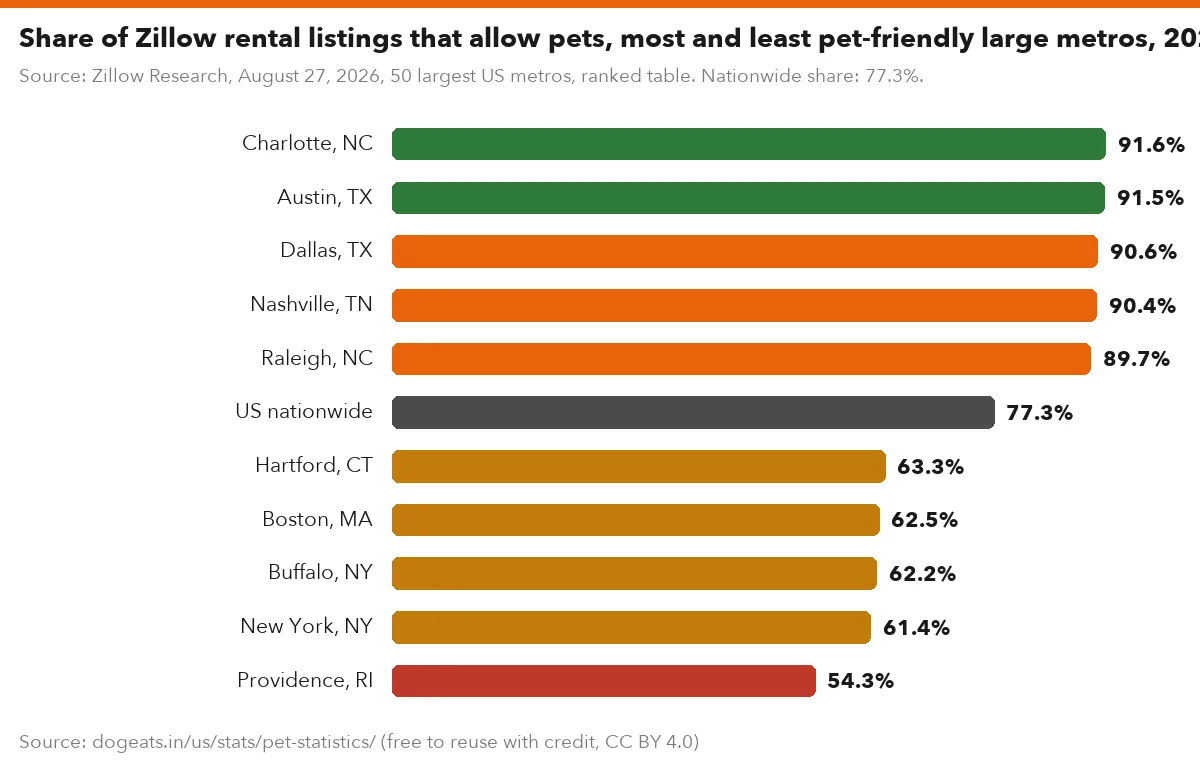
- 77% of rental listings on Zillow allowed pets in 2026, from 91.6% in Charlotte to 54% in Providence (Zillow Research, Most pet-friendly rental markets, August 2026).
- 59% of renter households have a pet, more than the 37% with a child; 40% have a dog and 31% a cat (Zillow Research, Most pet-friendly rental markets, August 2026).
- 65% of renters call pet-friendliness essential when choosing a rental, up from 60% in 2024 (Zillow Research, Most pet-friendly rental markets, August 2026).
- 8 days faster is how quickly pet-friendly Zillow listings typically lease; 58% of renters had pets, up from 46% in 2019 (Zillow press release, July 2025).
- $386 was the average pet spending of renter households in 2024, a third of the $1,147 homeowners spent (BLS, Consumer Expenditure Survey by housing tenure, 2024).
- $300 is Colorado's cap on a pet deposit, and pet rent is capped at $35 a month or 1.5% of rent, whichever is greater (Colorado HB23-1068).
- $2,500 or two months' rent, whichever is greater, is North Dakota's cap on a pet security deposit (North Dakota Century Code 47-16-07.1).
- Half a month's rent is the extra pet deposit a Kansas landlord may charge, on top of a deposit of up to 1.5 months' rent (Kansas Statutes 58-2550).
- 1 month's rent is Delaware's cap on a pet deposit, and none may be charged for a certified support animal (Delaware Code, 25 Del. C. 5514).
- $50 up front and $10 a month are the caps as subsidized tenants in HUD elderly or disabled housing build a pet deposit (eCFR, 24 CFR part 5 subpart C).
Source: Zillow Research, August 27, 2026, 50 largest US metros, ranked table. Nationwide share: 77.3%.
Show the numbers
| Label | % |
|---|---|
| Charlotte, NC | 91.6% |
| Austin, TX | 91.5% |
| Dallas, TX | 90.6% |
| Nashville, TN | 90.4% |
| Raleigh, NC | 89.7% |
| US nationwide | 77.3% |
| Hartford, CT | 63.3% |
| Boston, MA | 62.5% |
| Buffalo, NY | 62.2% |
| New York, NY | 61.4% |
| Providence, RI | 54.3% |
Embed this chart
| State | Pet deposit limit | Pet rent limit |
|---|---|---|
| Colorado | $300, refundable | $35 a month or 1.5% of rent, whichever is greater |
| Delaware | 1 month of rent | No cap in statute |
| Kansas | Half a month of rent, on top of the general deposit | No cap in statute |
| North Dakota | $2,500 or 2 months of rent, whichever is greater | No cap in statute |
Pet laws, service animals and air travel
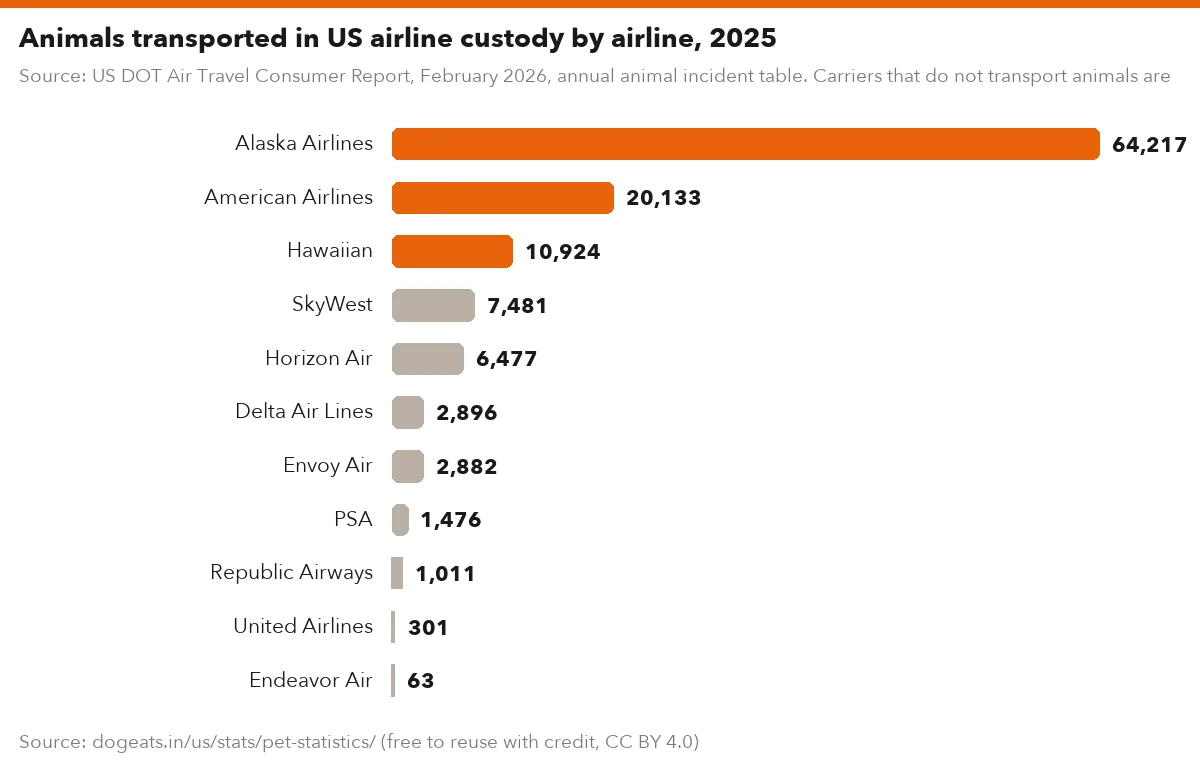
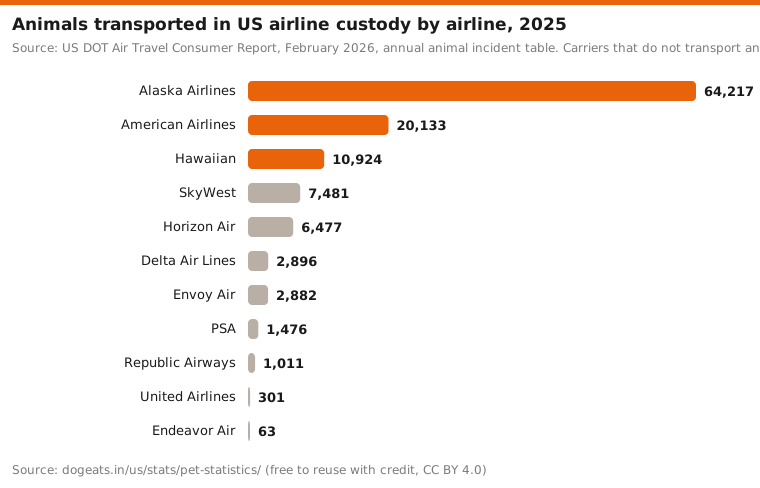
Federal law sets a few national rules for pets, from small turtles to airline reporting and disaster plans; states set most of the rest. Airlines carried far fewer animals in 2025 than a decade earlier. See our airline pet incidents report for each airline since 2015.
- 4 inches is the shell length below which live turtles may not be sold in the US, a federal Salmonella rule (eCFR, 21 CFR 1240.62).
- September 17, 2025 was when HUD withdrew its 2020 guidance on assistance animals; Fair Housing Act rules still apply (Federal Register, HUD guidance withdrawal).
- January 11, 2021 was when airlines stopped having to treat emotional support animals as service animals under a DOT rule (Federal Register, Traveling by air with service animals, 2020).
- 117,861 animals flew in US airline custody in 2025, with 3 deaths, 5 injuries and 1 loss, or 0.76 incidents per 10,000 (US DOT, Air Travel Consumer Report, 2026).
- 24 to 34 inches tall and 70 to 100 pounds is the typical miniature horse, which ADA rules allow as a service animal besides dogs (ADA.gov, Service animals).
- 4 or fewer breeding female pet animals, such as dogs or cats, lets a breeder skip a USDA license (eCFR, 9 CFR 2.1).
- 3 kinds of pets, dogs, cats and rabbits, may not be sold by New York pet shops, though shops may host adoptions (New York GBL 753-f).
- 2006 was the year the PETS Act required state and local disaster plans to cover household pets and service animals (Public Law 109-308, 2006).
- 64,217 of the animals flown in 2025 traveled on Alaska Airlines, over half the total, at 0.47 incidents per 10,000 (US DOT, Air Travel Consumer Report, 2026).
Source: US DOT Air Travel Consumer Report, February 2026, annual animal incident table. Carriers that do not transport animals are left out.
Show the numbers
| Label | animals |
|---|---|
| Alaska Airlines | 64,217 |
| American Airlines | 20,133 |
| Hawaiian | 10,924 |
| SkyWest | 7,481 |
| Horizon Air | 6,477 |
| Delta Air Lines | 2,896 |
| Envoy Air | 2,882 |
| PSA | 1,476 |
| Republic Airways | 1,011 |
| United Airlines | 301 |
| Endeavor Air | 63 |
Embed this chart
Pet health, poisonings and diseases shared with people
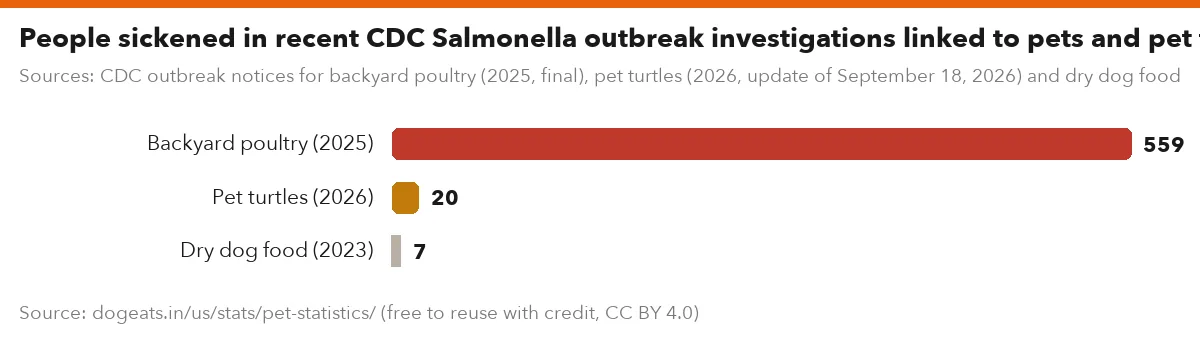
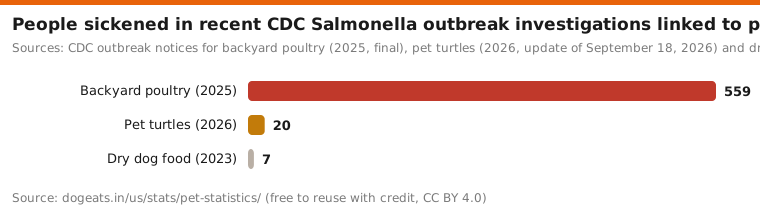
Most US pets are overweight, and poison control lines field hundreds of thousands of calls a year. Pets can also pass germs to people, with backyard poultry and small turtles the most common sources of Salmonella outbreaks. Our top pet toxins report ranks poisons since 2015.
- 20 people in 12 states were sick in a 2026 Salmonella outbreak linked to pet turtles, half of them under 5 (CDC, pet turtle outbreak, 2026).
- 559 people in 48 states caught Salmonella from backyard poultry in the 2025 outbreaks, and 125 were hospitalized (CDC, Salmonella outbreaks linked to backyard poultry, 2025).
- 7 people in 7 states got Salmonella in a 2023 outbreak linked to Mid America Pet Food dry dog food (CDC, dry dog food outbreak, 2023).
- 59% of dogs and 61% of cats seen by vets were overweight or obese in the 2022 Association for Pet Obesity Prevention survey (APOP, 2022 pet obesity prevalence survey).
- 376,000 items that pets were exposed to were reported to ASPCA Animal Poison Control in 2025 (ASPCA, Top 10 toxins of 2025).
- 40 million people in the US are infected with Toxoplasma, a parasite that can spread through cat feces, though most never get sick (CDC, About toxoplasmosis).
- Fewer than 10 human psittacosis cases, a disease spread by pet birds, have been reported to CDC in most years since 2010 (CDC, Psittacosis surveillance and trends).
- 100,000 Salmonella infections in children are prevented each year by the federal ban on selling small turtles, CDC estimates (CDC, Reptiles and amphibians).
- 100,000 Americans get rabies shots after a possible exposure each year, out of 1.4 million who seek care, and fewer than 10 die (CDC, Rabies in the United States).
- 4,000 animal rabies cases are reported in the US in a typical year, and more than 90% are in wildlife (CDC, Rabies in the United States).
- 86,629 ER-treated fall injuries a year were linked to cats and dogs in 2001 to 2006, 88% to dogs (CDC MMWR, 2009).
- 10,130 of those yearly fall injuries involved cats, and women were 2.1 times as likely to be hurt as men (CDC MMWR, 2009).
- 2.14 was the pooled unadjusted odds ratio linking cat ownership with schizophrenia-related disorders in a 2023 international review, not proof of cause (McGrath et al., 2023).
- 451,000 calls about pets exposed to toxic substances reached ASPCA Animal Poison Control in 2024, up nearly 4% on 2023 (ASPCA, Official top 10 toxins of 2024).
Sources: CDC outbreak notices for backyard poultry (2025, final), pet turtles (2026, update of September 18, 2026) and dry dog food (2023). CDC says the true number of sick people is likely much higher.
Show the numbers
| Label | people |
|---|---|
| Backyard poultry (2025) | 559 |
| Pet turtles (2026) | 20 |
| Dry dog food (2023) | 7 |
Embed this chart
Do pets make people healthier? What studies show
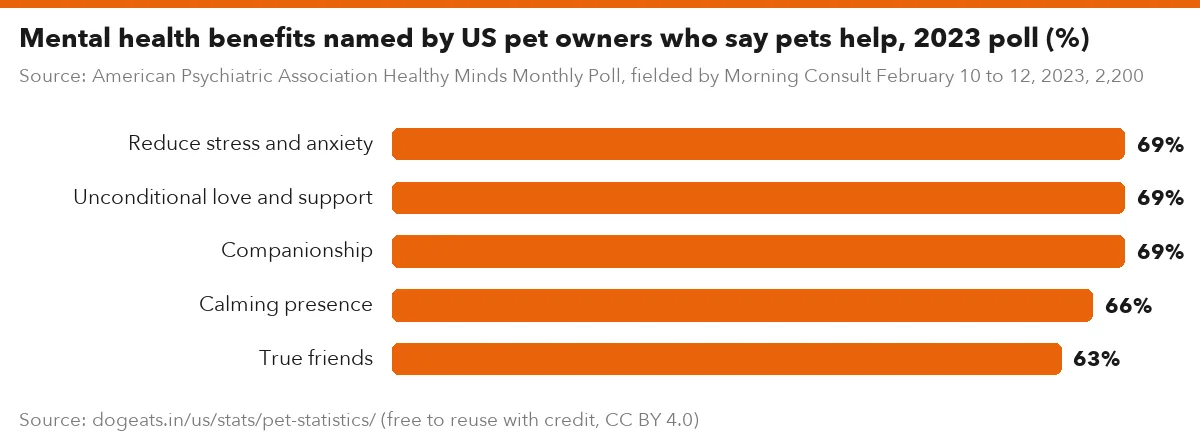
Most owners say their pets help their mental health, but research results are mixed. Large reviews find links to less isolation and some health markers, not proof that pets cause better health. Our report on whether dog owners are healthier covers the dog studies.
- 84% of pet owners said pets mostly help their mental health in a 2024 poll of 2,200 US adults (APA Healthy Minds poll, 2024).
- 1 in 5 pet owners said they have an emotional support animal, and 65% said pets offer companionship (APA Healthy Minds poll, 2024).
- 87% of pet owners reported mental health gains from pets in 2022, up from 74% in 2016, in an industry-funded HABRI survey (HABRI survey, 2022).
- 22% of US pet owners said in 2022 that a doctor or therapist had recommended a pet for their health (HABRI survey, 2022).
- 24 studies in a 2022 review linked pet ownership to less social isolation in adults, and to less loneliness in post-COVID studies (Kretzler et al., 2022).
- 7,945 English adults 50 and older were followed in a 2023 study; pet owners living alone had slower verbal memory and fluency declines (Li et al., JAMA Netw Open 2023).
- 0.63 was the relative risk of fatal heart attack for past cat owners against non-owners in a 2009 study of 4,435 US adults (Qureshi et al., 2009).
- 21 studies with 159,322 people showed no overall link between pets and depression in a 2025 international meta-analysis; cats showed a small raised risk (Moshfeghinia et al., 2025).
- 22 studies of children and teens were reviewed in 2017, and most linked pets with better emotional development, though study quality varied (Purewal et al., IJERPH 2017).
- 49% of Swedish children with no pets as babies had ever had an allergy, against none with five or more pets (2018 study) (Hesselmar et al., PLOS One 2018).
- 25,138 adults aged 70 and over were covered in a 2022 review tying regular dog contact to fewer anxiety symptoms, not less depression (Maurice et al., 2022).
- 87% of dog owners and 86% of cat owners said pets help their mental health in a 2023 poll, against 62% of other pet owners (APA Healthy Minds poll, 2023).
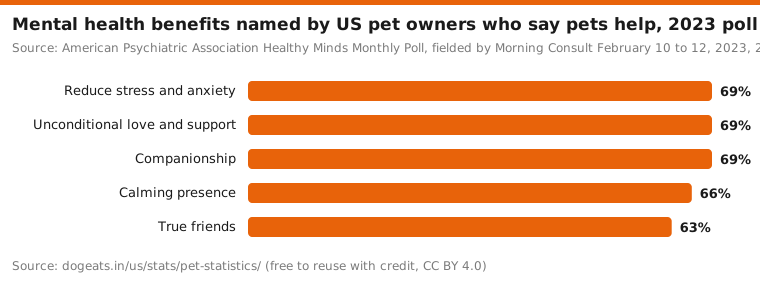
Source: American Psychiatric Association Healthy Minds Monthly Poll, fielded by Morning Consult February 10 to 12, 2023, 2,200 adults. Asked of owners who said pets positively affect their mental health.
Show the numbers
| Label | % |
|---|---|
| Reduce stress and anxiety | 69% |
| Unconditional love and support | 69% |
| Companionship | 69% |
| Calming presence | 66% |
| True friends | 63% |
Embed this chart
Frequently asked questions
How many pets are in the US in 2026?
The AVMA estimates 88.9 million pet dogs and 77.0 million pet cats in US homes in 2026. That works out to about 48.5 dogs and cats for every 100 Americans, before counting fish, birds and other pets.
What percentage of US households have a pet?
APPA puts it at 95 million households in 2025, roughly 7 in 10 homes on the household base implied by its own survey. The AVMA counts 43.7% of households with a dog and 34.1% with a cat in 2026.
What is the most common pet in the US?
Dogs, in 58.9 million households in 2026, followed by cats in 46.0 million, by AVMA count. Fish come third in AVMA data, at 3.5 million households.
How much do Americans spend on pets a year?
APPA estimates $158 billion for 2025, and BEA consumer accounts show $192.3 billion. The average household spent $880 on pets in 2024, by BLS count.
How many pets are in shelters each year?
About 5.8 million dogs and cats entered US shelters and rescues in 2025, and 4.2 million were adopted. About 597,000 were euthanized.
How many pets have insurance in the US?
About 5.23 million dogs and 1.75 million cats were insured at the end of 2025, by NAPHIA count. It works out to under 6% of pet dogs and about 2% of pet cats.
How much has the cost of vet care gone up?
Vet prices rose 53.0% from January 2020 to September 2026 and 4.6% in the latest 12 months, BLS data show. All consumer prices rose 30.6% over the same period.
Do pets improve mental health?
In a 2024 poll, 84% of US pet owners said pets help their mental health. Reviews of studies find links to less isolation, but a 2025 meta-analysis of 21 studies found no overall link with depression.
Methodology and limitations
We compiled this hub on 16 and 17 October 2026 from primary sources only. These include federal agencies such as BLS, BEA, Census, CDC, FDA, USDA and DOT, peer-reviewed papers, state statutes and SEC filings. We also used the original surveys of the AVMA, APPA, NAPHIA and Shelter Animals Count.
Every statistic was taken from a page or file we opened in this session, with the number, unit, population and year checked on the page. Sites that block scripts, such as avma.org, transportation.gov and aavmc.org, were opened in a browser. Figures reused from our live US reports were traced back and re-opened at the original source.
We rejected numbers found only in roundups, blogs or press coverage, numbers whose source would not load, and figures we could not match exactly. Data run from 2001 to October 2026; anything older than three years carries its year in the bullet. Survey and company figures are labeled with their publisher.
Some figures are our own calculations, noted where they appear. These are price changes from BLS index values, dogs and cats per 100 residents, insured shares of the AVMA pet counts, and the "all other markets" export figure. Each is rounded once from unrounded inputs. We plan to update this hub monthly.
Sources
- AVMA, U.S. pet ownership statistics (2026 Sourcebook) (2026), Cited inline in the ownership section
- US Bureau of Economic Analysis, National Income and Product Accounts, Table 2.5.5 line 92 (DPETRC) (2025), Cited inline in the spending section
- Shelter Animals Count, 2025 Annual Data Report (2025), Cited inline in the shelters section
- Also consulted: American Pet Products Association, 2026 State of the Industry release (2025), Pew Research Center, About half of U.S. pet owners say their pets are as much a part of their family as a human member (2023), US Census Bureau (population); AVMA (pets), Population growth slows (Vintage 2025 estimates) (2025-2026), US Bureau of Labor Statistics, American Time Use Survey, Table A-1, 2025 (2025), AVMA, Dogs still reign, but cats are closing the gap (2026), AVMA, Pet population continues to increase while pet spending declines (2024), American Pet Products Association, 2026 Cat Report release (2025), Rover, The Cost of Cat Parenthood in 2026 (2026), Loss, Will and Marra (Nature Communications), The impact of free-ranging domestic cats on wildlife of the United States (2013), JAVMA (CDC authors), Rabies surveillance in the United States during 2024 (2024), Pet Poison Helpline, Top 10 Pet Poisons of 2025 (2025), American Pet Products Association, 2025 Fish & Reptile Report release (2025), American Pet Products Association, 2025 Bird, Small Animal & Horse Report release (2025), American Horse Council, 2023 Economic Impact of the Horse Industry in the USA (2023), USDA National Agricultural Statistics Service, 2022 Census of Agriculture, Table 29 Equine inventory (2022), FDA (eCFR), 21 CFR 1240.62 (current), CDC, Salmonella Outbreak Linked to Pet Turtles (2026), CDC, Salmonella Outbreaks Linked to Backyard Poultry (2025), US Bureau of Labor Statistics, CE Table 1101, Quintiles of income before taxes, 2024 (2024), US Bureau of Labor Statistics, CE Table 1800, Region of residence, 2024 (2024), US Bureau of Labor Statistics, CE Table 1700, Area type, 2024 (2024), US Bureau of Labor Statistics, CE Table 2100, Race of reference person, 2024 (2024), American Pet Products Association, Industry trends and stats (2025), US Bureau of Labor Statistics, Consumer Expenditure Survey, Pets (CXUPETSLB0101M) (2024), US Bureau of Labor Statistics, CE detailed expenditure means, all consumer units, 2024 (2024), US Bureau of Labor Statistics, CPI-U Pets, pet products and services (CUUR0000SERB) (Jan 2020 to Sep 2026), US Bureau of Labor Statistics, CPI-U All items (CUUR0000SA0) (Sep 2026), US Bureau of Labor Statistics, CPI-U Pet services incl. veterinary (CUUR0000SS62053) (Jan 2020 to Sep 2026), US Bureau of Labor Statistics, CPI-U Pets and pet supplies (CUUR0000SS61032) (Sep 2026), Chewy, Inc., Form 10-K, fiscal year ended February 1, 2026 (FY2025), Central Garden & Pet Company, Form 10-K, fiscal year ended September 27, 2025 (FY2025), US Census Bureau, County Business Patterns 2023, US file (NAICS 311111, 453910, 541940, 812910) (2023), US Bureau of Labor Statistics, Occupational Outlook Handbook: Animal Care and Service Workers (2025), US Bureau of Labor Statistics, CPI-U Pet food and treats (CUUR0000SS61031) (Jan 2020 to Sep 2026), Pet Food Institute, US pet food finds opportunity in 2025 despite trade uncertainty (2025), Freshpet, Inc., Form 10-K, year ended December 31, 2025 (2025), FDA Center for Veterinary Medicine, Get the Facts! Raw Pet Food Diets can be Dangerous to You and Your Pet (2010-2012), FDA, FDA Alert: Certain Lots of Sportmix Pet Food Recalled for Potentially Fatal Levels of Aflatoxin (2021), FDA, Cat and Dog Food Manufacturers Required to Consider H5N1 in Food Safety Plans (2025), FDA (company announcement), Savage Pet Recalls Savage Cat Food Chicken (2025), CDC, Salmonella Outbreak Linked to Dry Dog Food, November 2023 (2023), US Bureau of Labor Statistics, CPI-U Veterinarian services (CUUR0000SS62054) (Jan 2020 to Sep 2026), AVMA, U.S. veterinarian numbers (2025), US Bureau of Labor Statistics, Occupational Outlook Handbook: Veterinarians (2025), US Bureau of Labor Statistics, Occupational Outlook Handbook: Veterinary Technologists and Technicians (2025), AVMA, New veterinary graduates face rising debt, lower real income (2026), AAVMC, Annual Data Report 2025-2026 (2016-2026), USDA Economic Research Service, EIB-311 (2010-2026), Zoetis Inc., Form 10-K, year ended December 31, 2025 (2025), Elanco Animal Health, Form 10-K, year ended December 31, 2025 (2025), IDEXX Laboratories, Form 10-K, year ended December 31, 2025 (2025), Petco Health and Wellness Company, Form 10-K, fiscal year ended January 31, 2026 (Jan 2026), NAPHIA, State of the Industry Report 2026 highlights (2025 data), NAPHIA, Industry data: State of the Industry Report 2026 (2025 data), Trupanion, Inc., Form 10-K, year ended December 31, 2025 (2025), National Association of Insurance Commissioners, Pet Insurance Model Act (MO-633) (2022), ASPCA, U.S. Animal Shelter Statistics (2025), Shelter Animals Count, 2025 Annual Data Report (PDF) (2025), Shelter Animals Count, Data Drop: A closer look at age and reunification trends (2025), Shelter Animals Count, 2026 Mid-Year Data Summary (2026), Best Friends Animal Society (advocacy group), 2025 national shelter data release (2025), Best Friends Animal Society (advocacy group), Pet Lifesaving Dashboard (2025), Weiss, Slater and Lord (Animals), Frequency of Lost Dogs and Cats in the United States and the Methods Used to Locate Them (2012), Lord et al. (JAVMA), Characterization of animals with microchips entering animal shelters (2007-2008), Zillow Research, Charlotte is America's most pet-friendly rental market (2026), Zillow, Saying yes to pets pays off for landlords (2025), US Bureau of Labor Statistics, CE Table 1500, Housing tenure, 2024 (2024), Colorado General Assembly, HB23-1068 Pet Animal Ownership In Housing (2023), North Dakota Legislative Assembly, North Dakota Century Code chapter 47-16 (current), Kansas Legislature, K.S.A. 58-2550 (current), State of Delaware, 25 Del. C. 5514 (current), HUD (eCFR), 24 CFR 5.318 (current), HUD (Federal Register), Notification of Withdrawal of Fair Housing and Equal Opportunity Guidance Documents (2025), US DOT (Federal Register), Traveling by Air With Service Animals, final rule (2021), US Department of Transportation, Air Travel Consumer Report, February 2026 (2025), US Department of Justice, ADA Requirements: Service Animals (current), USDA APHIS (eCFR), 9 CFR 2.1 (current), Association for Pet Obesity Prevention, 2022 Pet Obesity Prevalence Survey (2022), ASPCA, The Top 10 Toxins of 2025 (2025), CDC, About Toxoplasmosis (current), CDC, Psittacosis Surveillance and Trends (2010-2025), CDC, Healthy Pets: Reptiles and Amphibians (current), CDC, Rabies: Protecting Public Health (current), CDC, Nonfatal Fall-Related Injuries Associated with Dogs and Cats, United States, 2001-2006 (2001-2006), McGrath et al. (Schizophrenia Bulletin), Cat Ownership and Schizophrenia-Related Disorders and Psychotic-Like Experiences: A Systematic Review and Meta-Analysis (2023), American Psychiatric Association, Healthy Minds Monthly Poll on pets (2024), Human Animal Bond Research Institute, HABRI benchmark survey release (2022), Kretzler et al., Pet ownership, loneliness, and social isolation: a systematic review (2022), Li et al. (JAMA Network Open), Pet Ownership, Living Alone, and Cognitive Decline Among Adults 50 Years and Older (2010-2019), Qureshi et al., Cat ownership and the Risk of Fatal Cardiovascular Diseases (NHANES II follow-up) (2009), Moshfeghinia et al. (Annals of General Psychiatry), Pet ownership and risk of depression: a systematic review and meta-analysis (2025), Purewal et al. (IJERPH), Companion Animals and Child/Adolescent Development: A Systematic Review of the Evidence (2017), Hesselmar et al. (PLOS One), Pet-keeping in early life reduces the risk of allergy in a dose-dependent fashion (2018), Maurice et al., Dog ownership and mental health among community-dwelling older adults: a systematic review (2022), American Pet Products Association, APPA releases 2025 State of the Industry report (2024), AVMA, Evolving pet owner economics: What data reveal for veterinary teams (2025), ASPCA, The Official Top 10 Toxins of 2024 (2024), AVMA, Facing economic uncertainty, clients delay veterinary visits (2021-2023), American Psychiatric Association, Healthy Minds Monthly Poll, March 2023 (2023), NAPHIA, State of the Industry Report 2025 highlights (2020 to 2024), New York State Senate, General Business Law 753-f (current), US Congress (GovInfo), Pets Evacuation and Transportation Standards Act of 2006, Public Law 109-308 (2006).
Cite, embed and download
This report, its data and its images are free to reuse under a Creative Commons Attribution 4.0 licence. Credit dogeats.in with a link to this page. Every chart has its own embed code, every table has a CSV and an image download, and the images below are ready for social posts, slides and articles.
Cite this report
Link to this report
Every chart and table as an image