Data report · Updated October 2026
US dog shelter and adoption statistics: intake, adoptions, euthanasia and the capacity crisis
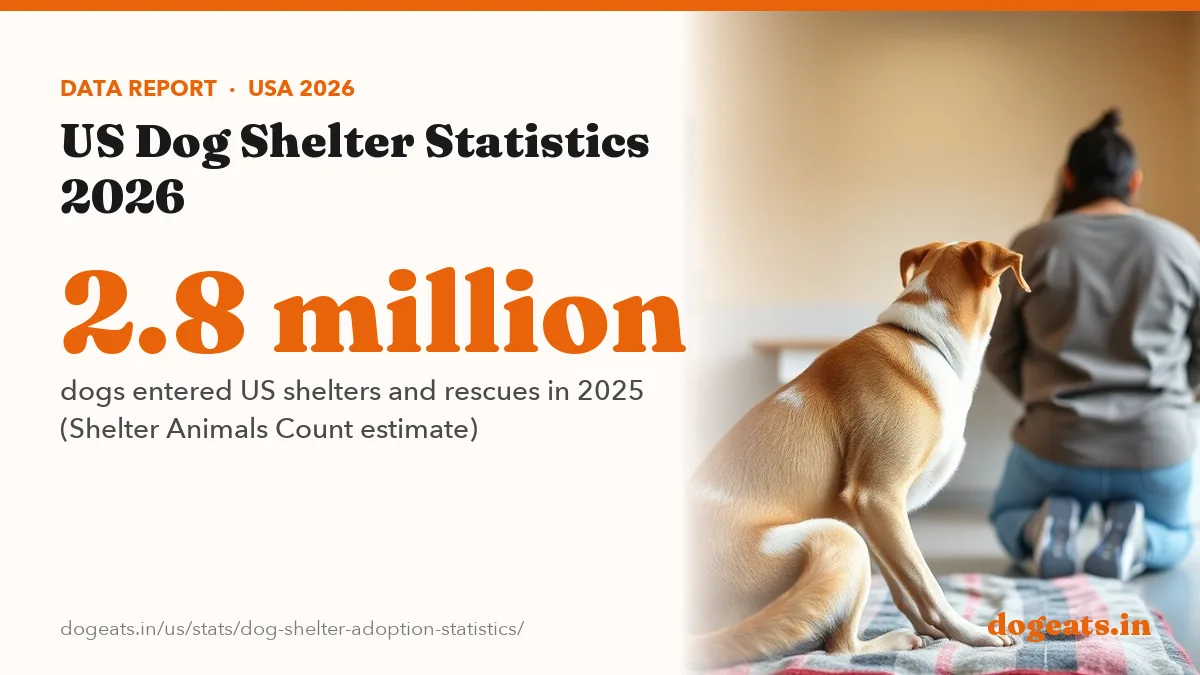
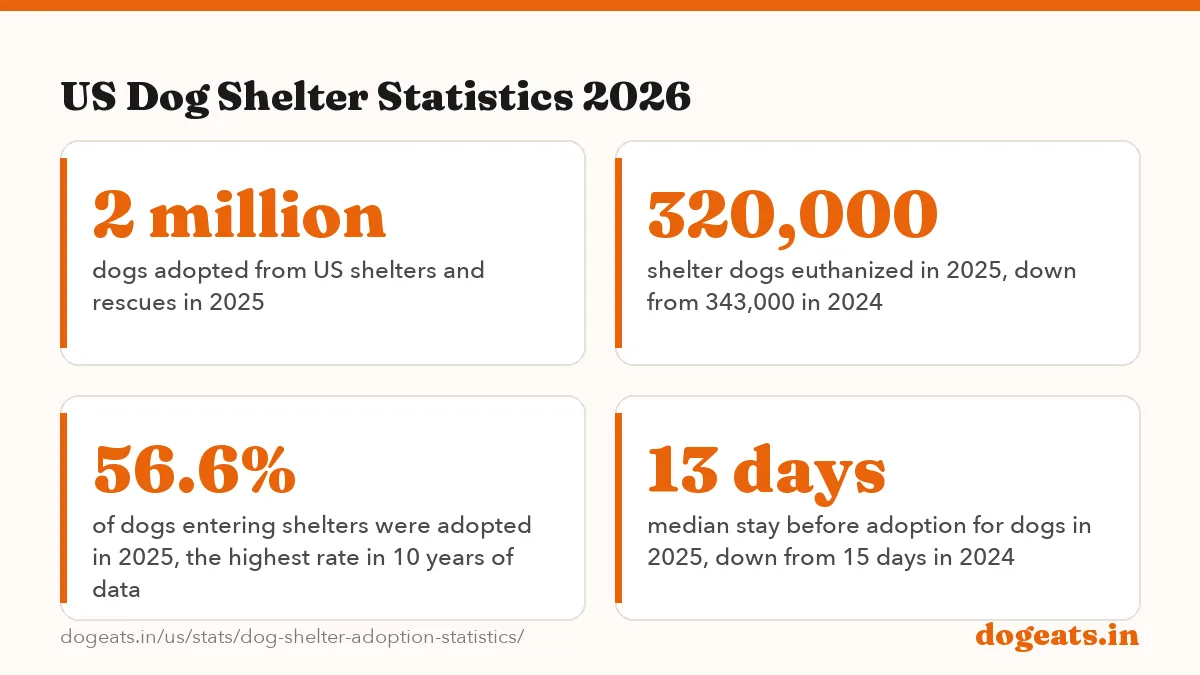
An estimated 2.8 million dogs entered US shelters and rescues in 2025, and about 2 million dogs were adopted, Shelter Animals Count reports. About 320,000 dogs were euthanized, 7% fewer than in 2024. Dogs now make up the larger share of shelter euthanasia, and shelters have taken in more dogs than they released every year since 2016.

Key findings
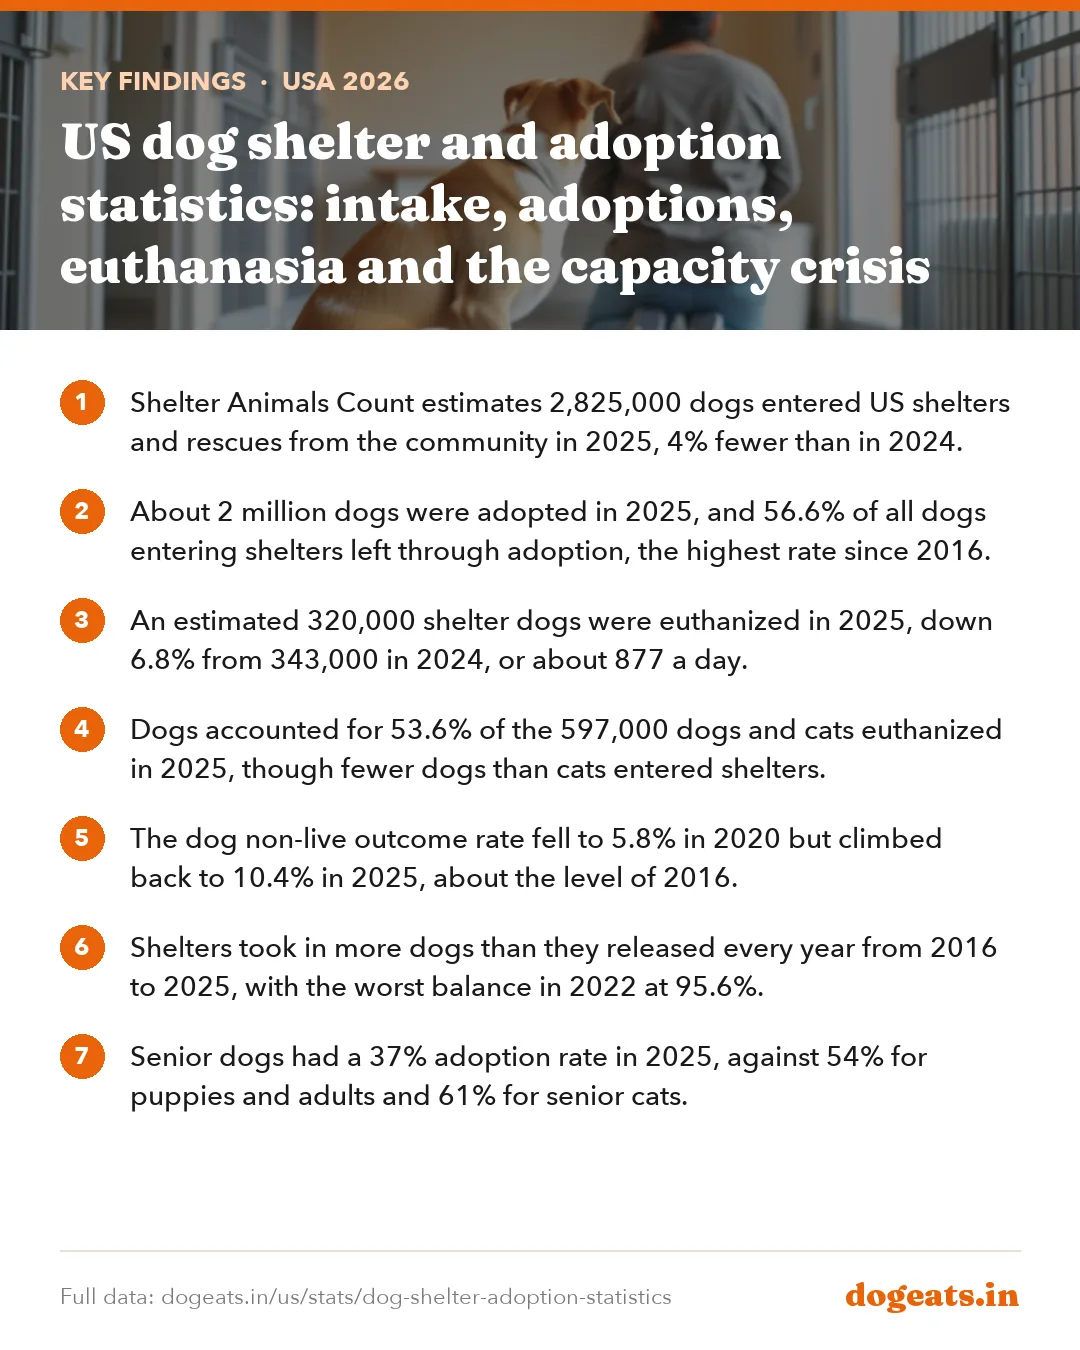
- Shelter Animals Count estimates 2,825,000 dogs entered US shelters and rescues from the community in 2025, 4% fewer than in 2024.
- About 2 million dogs were adopted in 2025, and 56.6% of all dogs entering shelters left through adoption, the highest rate since 2016.
- An estimated 320,000 shelter dogs were euthanized in 2025, down 6.8% from 343,000 in 2024, or about 877 a day.
- Dogs accounted for 53.6% of the 597,000 dogs and cats euthanized in 2025, though fewer dogs than cats entered shelters.
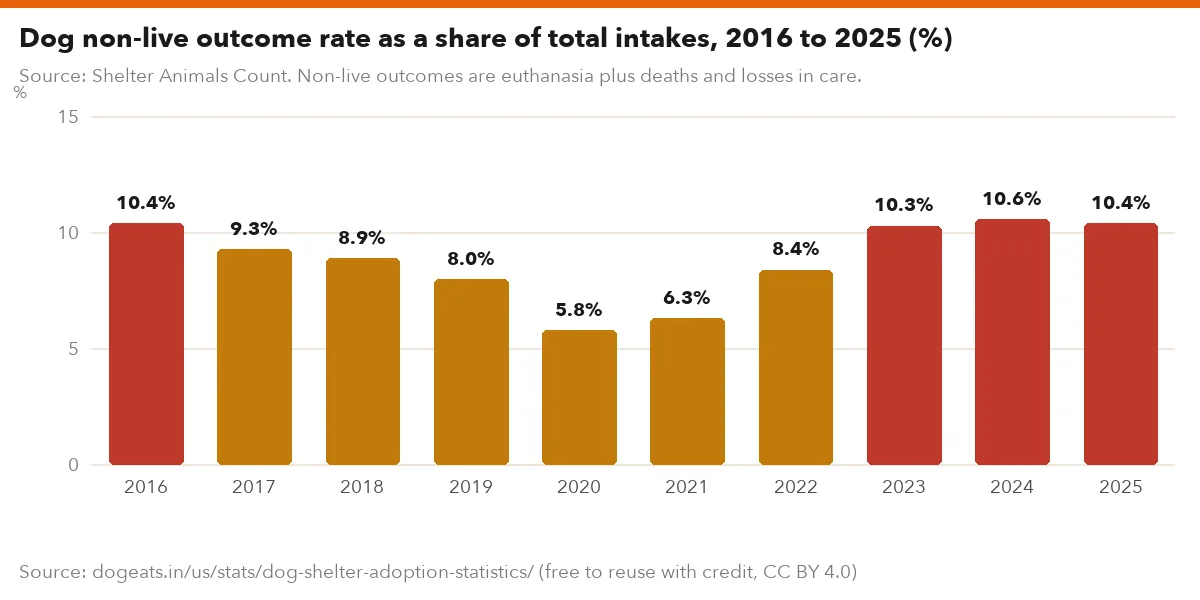
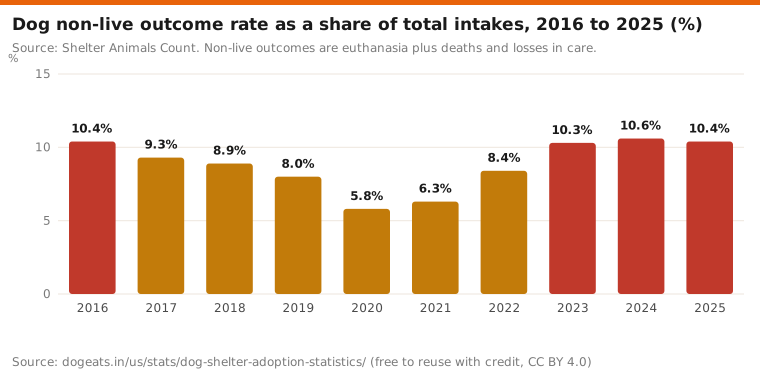
- The dog non-live outcome rate fell to 5.8% in 2020 but climbed back to 10.4% in 2025, about the level of 2016.
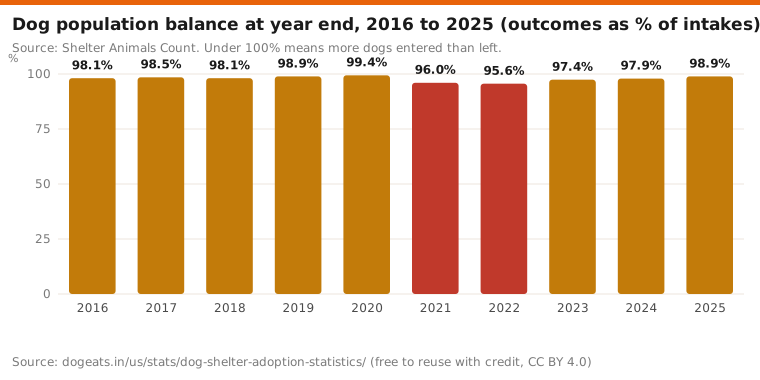
- Shelters took in more dogs than they released every year from 2016 to 2025, with the worst balance in 2022 at 95.6%.
- Senior dogs had a 37% adoption rate in 2025, against 54% for puppies and adults and 61% for senior cats.
- Large dogs had the highest non-live outcome rate of any size at 12%, and 90% of dog non-live outcomes were euthanasia.
- Stray dogs were returned to owners 34% of the time in 2025, against 6% for stray cats.
- The US has at least 13,471 animal sheltering organizations, made up of 4,100 shelters and 9,371 rescues.
How many dogs enter US shelters each year?
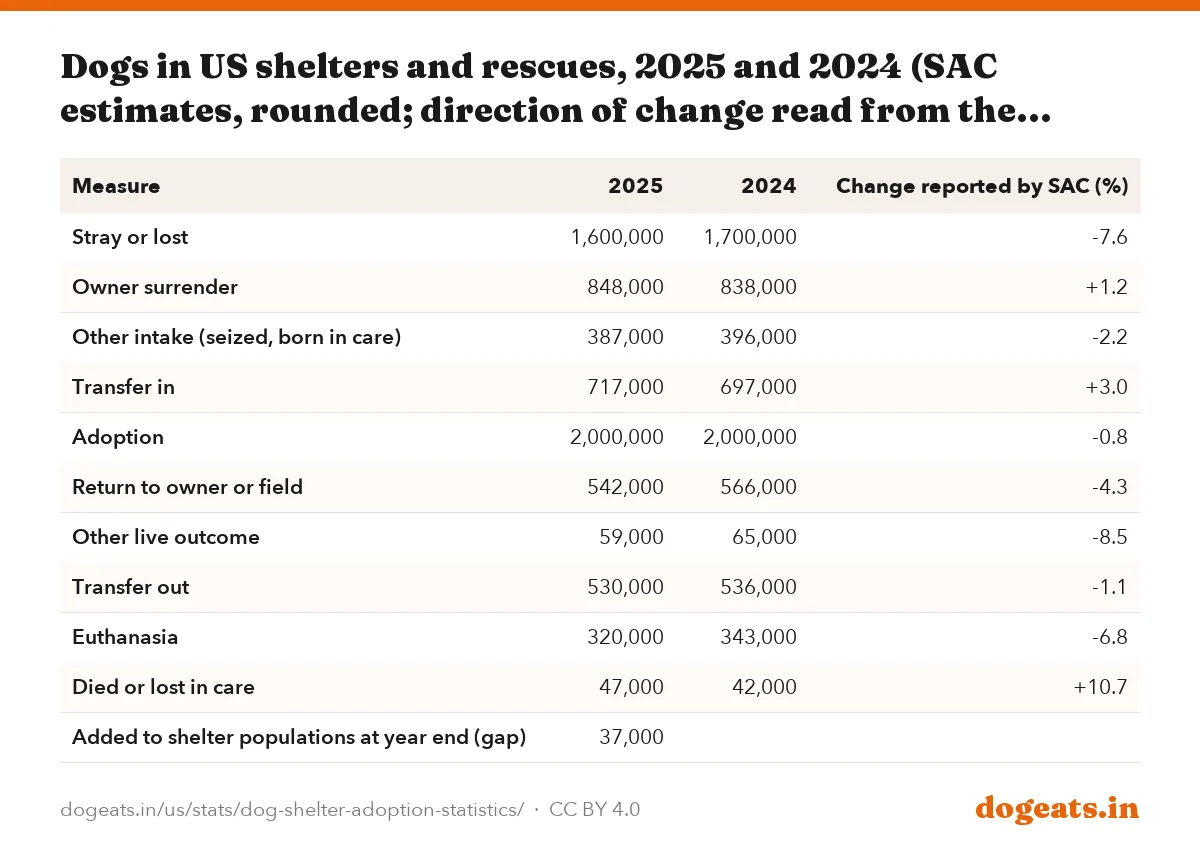
About 2.8 million dogs entered US shelters and rescues from the community in 2025, Shelter Animals Count (SAC) estimates. Another 717,000 dogs moved in as transfers from other organizations.
Dog intake fell 4% from 2024. Strays made up 56% of dog community intakes, owner surrenders 30% and other routes, such as seizures and births in care, 14%.
SAC is a program of the ASPCA and the main national source for shelter data. Its figures are model estimates built from monthly data reported by more than 6,000 organizations.
| Measure | 2025 | 2024 | Change reported by SAC (%) |
|---|---|---|---|
| Stray or lost | 1,600,000 | 1,700,000 | -7.6 |
| Owner surrender | 848,000 | 838,000 | +1.2 |
| Other intake (seized, born in care) | 387,000 | 396,000 | -2.2 |
| Transfer in | 717,000 | 697,000 | +3.0 |
| Adoption | 2,000,000 | 2,000,000 | -0.8 |
| Return to owner or field | 542,000 | 566,000 | -4.3 |
| Other live outcome | 59,000 | 65,000 | -8.5 |
| Transfer out | 530,000 | 536,000 | -1.1 |
| Euthanasia | 320,000 | 343,000 | -6.8 |
| Died or lost in care | 47,000 | 42,000 | +10.7 |
| Added to shelter populations at year end (gap) | 37,000 |
SAC revises past estimates every year as more organizations report. Its 2025 report puts 2024 dog euthanasia at 343,000, while the 2024 report said 334,000. We use the newest figures and note the older ones where they differ.
SAC rounds counts, so we show its own percentage changes. Dog adoptions round to 2 million in both years, but the totals imply a fall of about 0.8% while the adoption rate rose.
Dog adoption rates reached a 10-year high in 2025
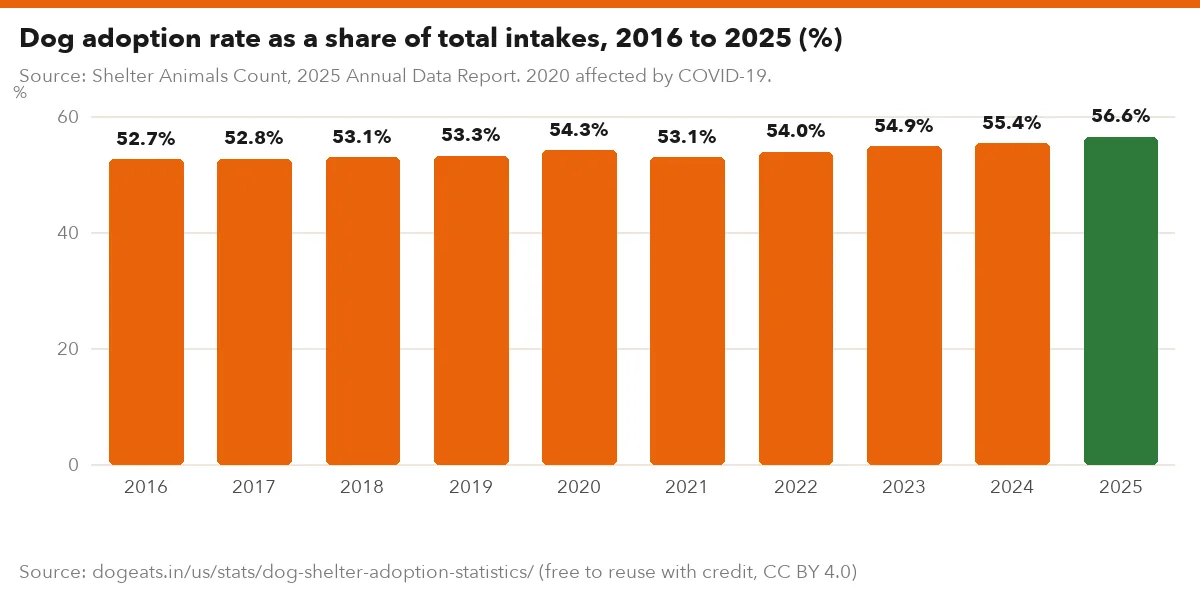
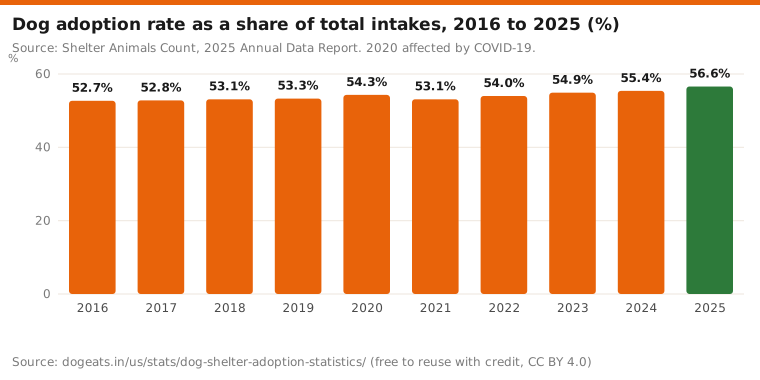
About 2 million dogs were adopted from US shelters and rescues in 2025. As a share of all dogs entering, adoptions reached 56.6%, up from 52.7% in 2016.
The count of dog adoptions has not grown. SAC's 2024 report said dog adoptions were 13.2% lower than in 2019, about 308,000 fewer. The rate rose because fewer dogs came in.

Source: Shelter Animals Count, 2025 Annual Data Report. 2020 affected by COVID-19.
Show the numbers
| Label | % |
|---|---|
| 2016 | 52.7% |
| 2017 | 52.8% |
| 2018 | 53.1% |
| 2019 | 53.3% |
| 2020 | 54.3% |
| 2021 | 53.1% |
| 2022 | 54.0% |
| 2023 | 54.9% |
| 2024 | 55.4% |
| 2025 | 56.6% |
Embed this chart
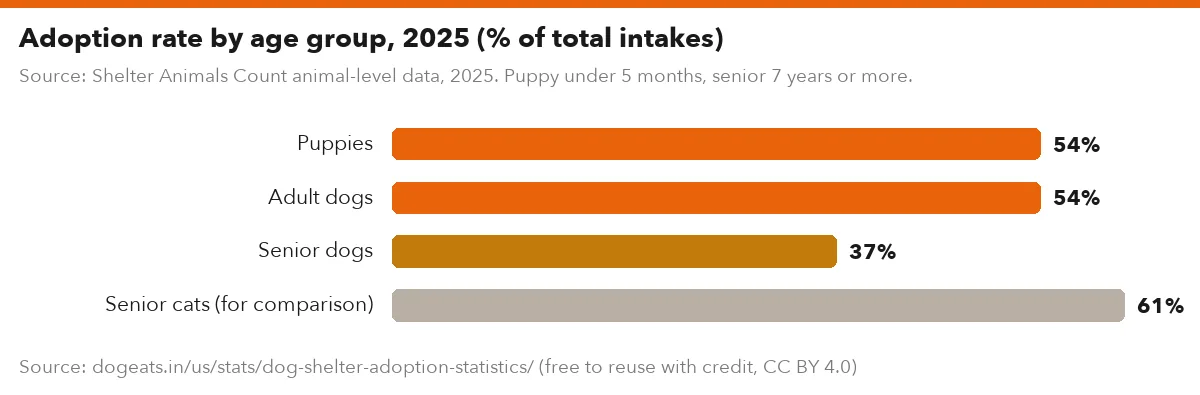
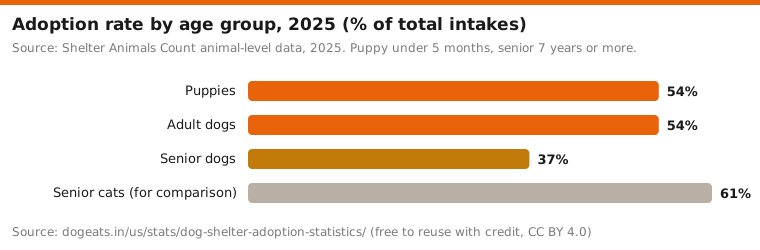
Source: Shelter Animals Count animal-level data, 2025. Puppy under 5 months, senior 7 years or more.
Show the numbers
| Label | % |
|---|---|
| Puppies | 54% |
| Adult dogs | 54% |
| Senior dogs | 37% |
| Senior cats (for comparison) | 61% |
Embed this chart
Older dogs wait longest for homes. Senior dogs had a 37% adoption rate in 2025, against 61% for senior cats, the widest dog and cat gap of any age group.
Size matters less for adoption than many people expect. Small and large dogs both had a 54% adoption rate in 2025, and medium dogs 53%. Rescues and government shelters each handled about a third of dog adoptions, at 32% and 31%.
Adopting is cheaper than buying, but a dog's running costs are the same either way. Our cost of owning a dog report covers food, vet and insurance bills.
How many shelter dogs are euthanized?
An estimated 320,000 shelter dogs were euthanized in 2025, down 6.8% from 343,000 in 2024. That works out to about 877 dogs a day.
Dogs now carry the larger share of shelter euthanasia. Of the 597,000 dogs and cats euthanized in 2025, 320,000 or 53.6% were dogs. Fewer dogs than cats entered shelters, at 2.8 million against 3 million.
Source: Shelter Animals Count. Non-live outcomes are euthanasia plus deaths and losses in care.
Show the numbers
| Label | % |
|---|---|
| 2016 | 10.4% |
| 2017 | 9.3% |
| 2018 | 8.9% |
| 2019 | 8.0% |
| 2020 | 5.8% |
| 2021 | 6.3% |
| 2022 | 8.4% |
| 2023 | 10.3% |
| 2024 | 10.6% |
| 2025 | 10.4% |
Embed this chart
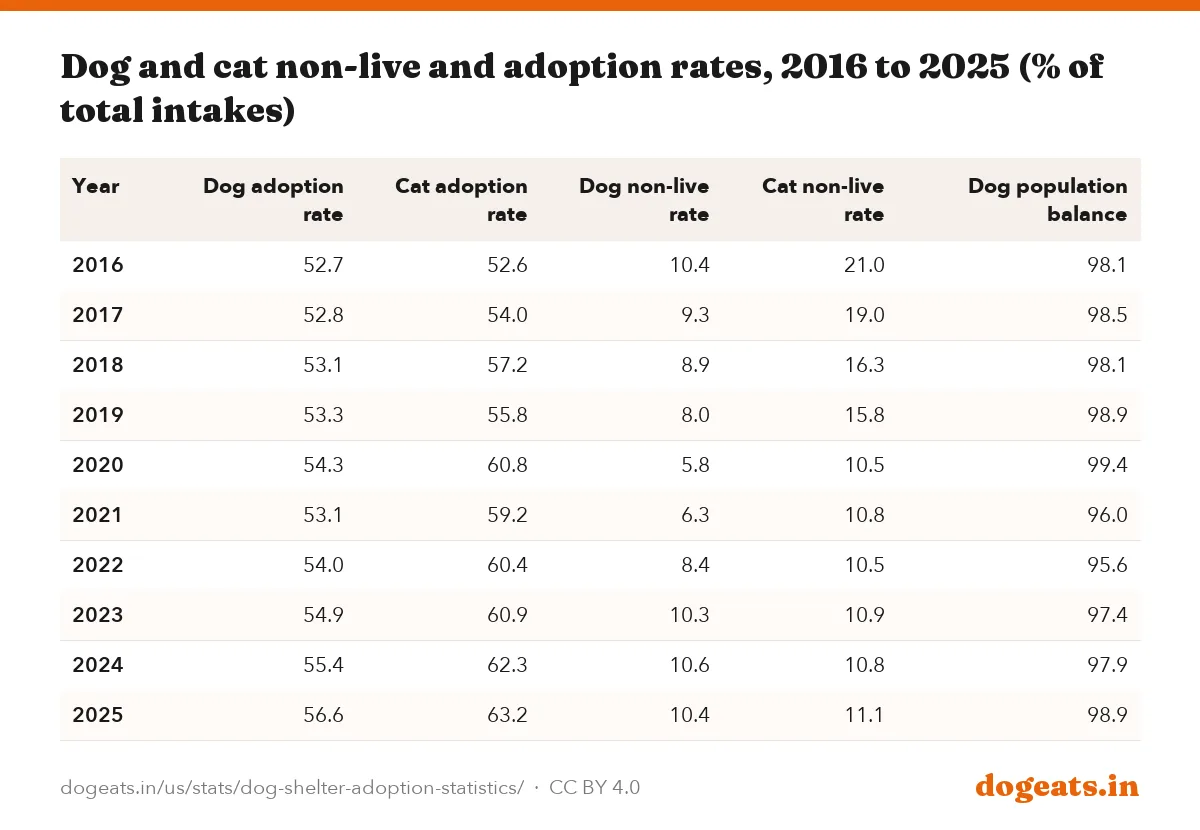
| Year | Dog adoption rate | Cat adoption rate | Dog non-live rate | Cat non-live rate | Dog population balance |
|---|---|---|---|---|---|
| 2016 | 52.7 | 52.6 | 10.4 | 21.0 | 98.1 |
| 2017 | 52.8 | 54.0 | 9.3 | 19.0 | 98.5 |
| 2018 | 53.1 | 57.2 | 8.9 | 16.3 | 98.1 |
| 2019 | 53.3 | 55.8 | 8.0 | 15.8 | 98.9 |
| 2020 | 54.3 | 60.8 | 5.8 | 10.5 | 99.4 |
| 2021 | 53.1 | 59.2 | 6.3 | 10.8 | 96.0 |
| 2022 | 54.0 | 60.4 | 8.4 | 10.5 | 95.6 |
| 2023 | 54.9 | 60.9 | 10.3 | 10.9 | 97.4 |
| 2024 | 55.4 | 62.3 | 10.6 | 10.8 | 97.9 |
| 2025 | 56.6 | 63.2 | 10.4 | 11.1 | 98.9 |
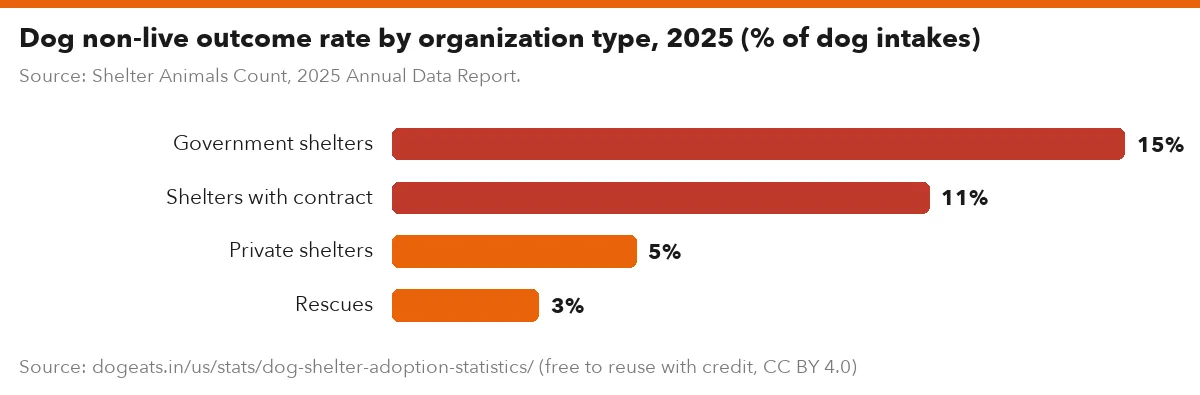
Source: Shelter Animals Count, 2025 Annual Data Report.
Show the numbers
| Label | % |
|---|---|
| Government shelters | 15% |
| Shelters with contract | 11% |
| Private shelters | 5% |
| Rescues | 3% |
Embed this chart
The trend for dogs runs against the trend for cats. Cat non-live rates fell from 21.0% in 2016 to about 11% from 2020 on. Dog rates fell to 5.8% in 2020, then climbed back to 10.4% by 2025.
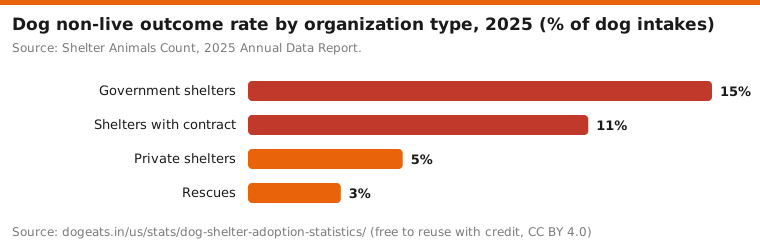
Euthanasia is concentrated in government shelters, which hold 59% of all non-live outcomes. Their dog non-live rate was 15% in 2025, against 3% at rescues.
Sources disagree on the overall trend since 2019. SAC's 2024 report said the dog and cat euthanasia rate fell from 13% in 2019 to 8% in 2024. The ASPCA's current page, citing SAC, says it fell from 10% in 2019 to 8% in 2025.
Dog shelters have filled up every year for a decade
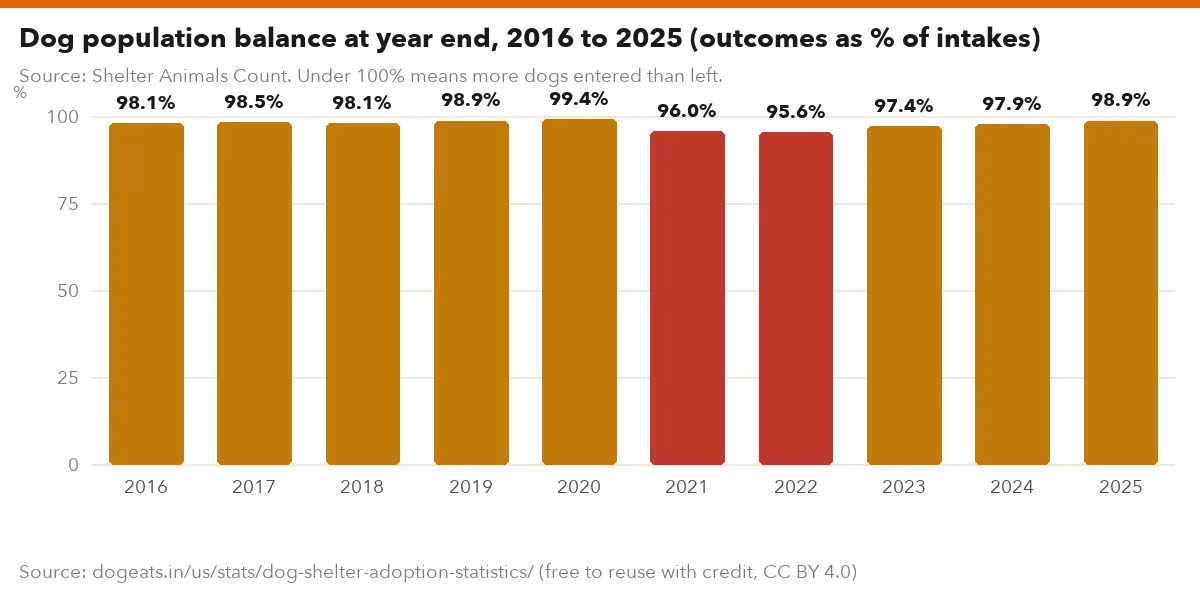
SAC measures crowding with a population balance score: dogs leaving divided by dogs entering. A score under 100% means the shelter population grew.
The dog score has been under 100% every year from 2016 to 2025. It fell hardest after the pandemic, to 96.0% in 2021 and 95.6% in 2022. In 2025 it recovered to 98.9%, still leaving 37,000 more dogs in care than at the start of the year.
Source: Shelter Animals Count. Under 100% means more dogs entered than left.
Show the numbers
| Label | % |
|---|---|
| 2016 | 98.1% |
| 2017 | 98.5% |
| 2018 | 98.1% |
| 2019 | 98.9% |
| 2020 | 99.4% |
| 2021 | 96.0% |
| 2022 | 95.6% |
| 2023 | 97.4% |
| 2024 | 97.9% |
| 2025 | 98.9% |
Embed this chart
SAC's 2024 report called it the fifth year of an ongoing capacity crisis. Dogs left more slowly as transfers between shelters dropped and fewer lost dogs went home.
Transfers out of shelters fell 37.6% for dogs between 2019 and 2024, to 524,000, the 2024 report found. SAC links the drop to reduced resources and capacity across the system.
How long do dogs stay in shelters?
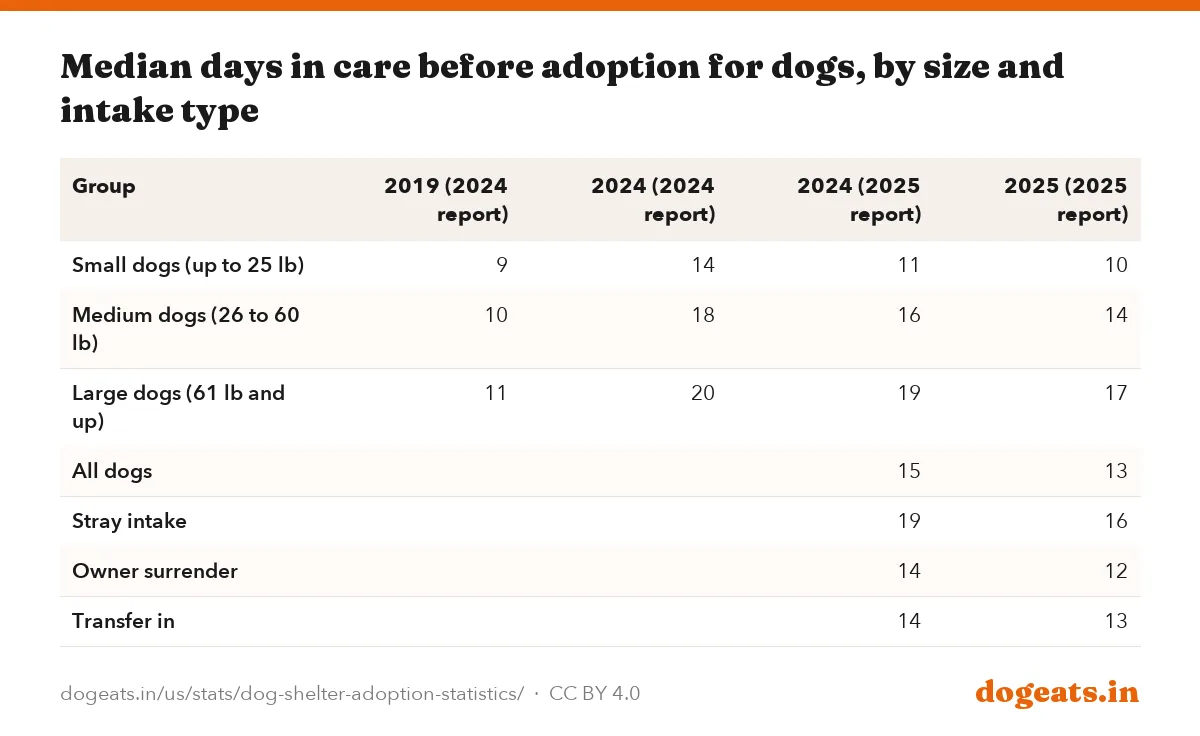
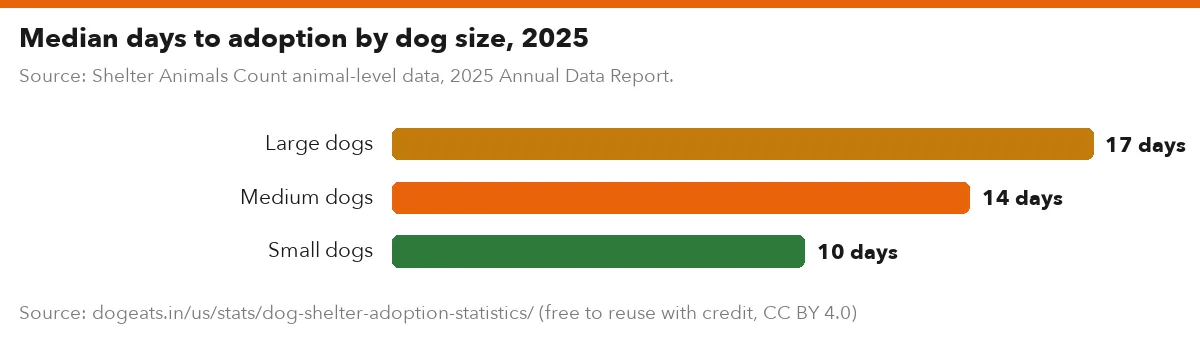
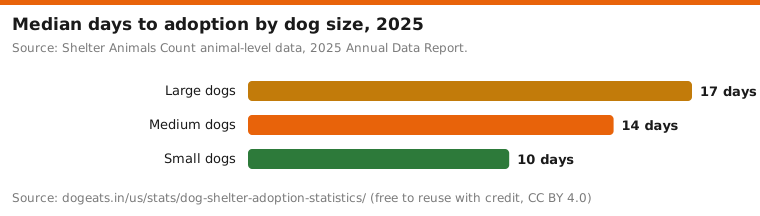
The median dog adopted in 2025 spent 13 days in care, down from 15 days in 2024, SAC's 2025 report says. Large dogs waited 17 days, medium dogs 14 and small dogs 10.
The longer view is less kind. SAC's 2024 report compared 2024 with 2019 and found stays had grown for every size. Large dogs went from 11 to 20 days, medium dogs from 10 to 18 and small dogs from 9 to 14.
| Group | 2019 (2024 report) | 2024 (2024 report) | 2024 (2025 report) | 2025 (2025 report) |
|---|---|---|---|---|
| Small dogs (up to 25 lb) | 9 | 14 | 11 | 10 |
| Medium dogs (26 to 60 lb) | 10 | 18 | 16 | 14 |
| Large dogs (61 lb and up) | 11 | 20 | 19 | 17 |
| All dogs | 15 | 13 | ||
| Stray intake | 19 | 16 | ||
| Owner surrender | 14 | 12 | ||
| Transfer in | 14 | 13 |
Source: Shelter Animals Count animal-level data, 2025 Annual Data Report.
Show the numbers
| Label | days |
|---|---|
| Large dogs | 17 days |
| Medium dogs | 14 days |
| Small dogs | 10 days |
Embed this chart
The two reports give different 2024 values for the same measure. SAC says its 2025 animal-level dataset roughly doubled after adding another software provider, so year-to-year shifts may partly reflect the new data.
Both reports agree on the order: large dogs stay longest and small dogs leave fastest.
Dogs and cats leave shelters by different routes
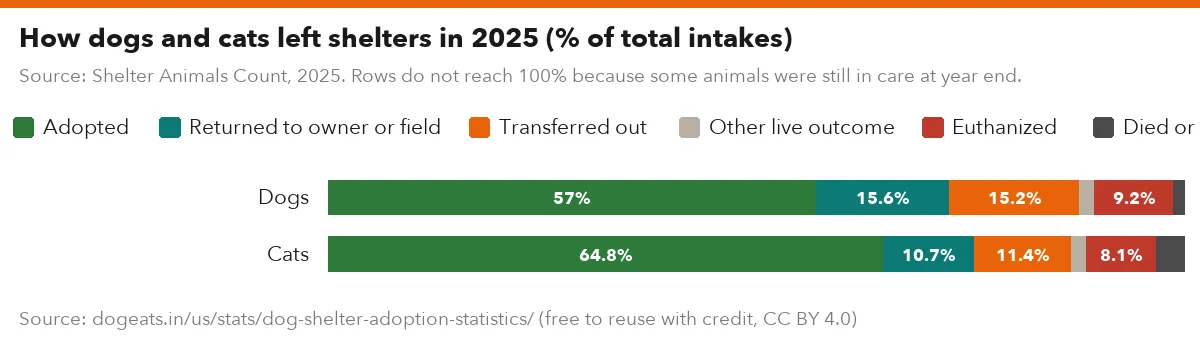
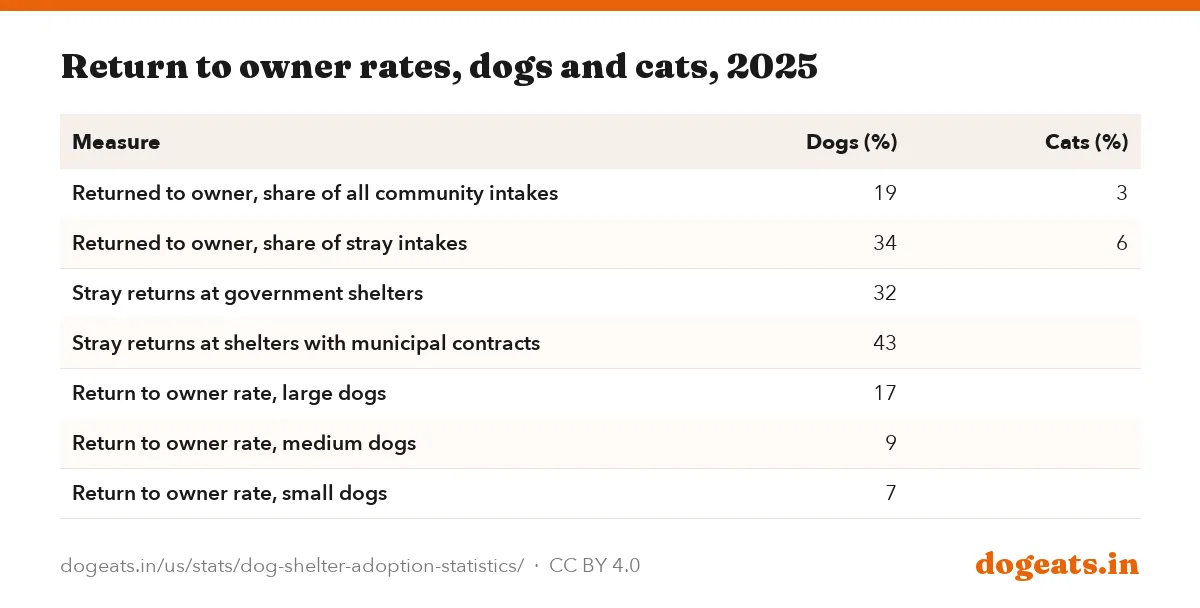
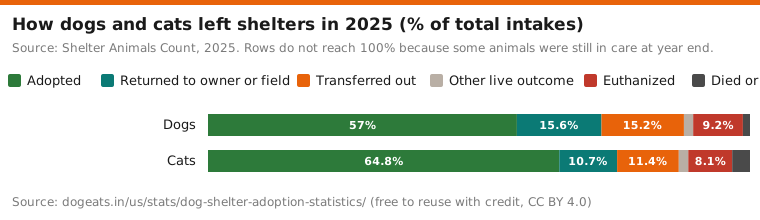
Dogs are far more likely to go home to an owner. In 2025, 19% of dog intakes ended with a return to owner, against 3% for cats. Among strays, 34% of dogs went home and 6% of cats.
Cats are adopted at a higher rate, 63.2% against 56.6% for dogs. More cats die in care, mainly very young kittens.
Source: Shelter Animals Count, 2025. Rows do not reach 100% because some animals were still in care at year end.
Show the numbers
| Label | Adopted | Returned to owner or field | Transferred out | Other live outcome | Euthanized | Died or lost in care |
|---|---|---|---|---|---|---|
| Dogs | 56.6 | 15.5 | 15.1 | 1.7 | 9.1 | 1.3 |
| Cats | 63.2 | 10.4 | 11.1 | 1.7 | 7.9 | 3.2 |
Embed this chart
| Measure | Dogs (%) | Cats (%) |
|---|---|---|
| Returned to owner, share of all community intakes | 19 | 3 |
| Returned to owner, share of stray intakes | 34 | 6 |
| Stray returns at government shelters | 32 | |
| Stray returns at shelters with municipal contracts | 43 | |
| Return to owner rate, large dogs | 17 | |
| Return to owner rate, medium dogs | 9 | |
| Return to owner rate, small dogs | 7 |
Large dogs are most likely to be reunited, at 17%, against 7% for small dogs. Yet large dogs also had the highest non-live rate, 12%, and made up 35% of dog non-live outcomes.
Returns to owners fell 3% in 2025 for dogs and cats combined, to 638,000. Shelters with municipal contracts did best, returning 43% of stray dogs.
Most shelter dogs are adults of medium size
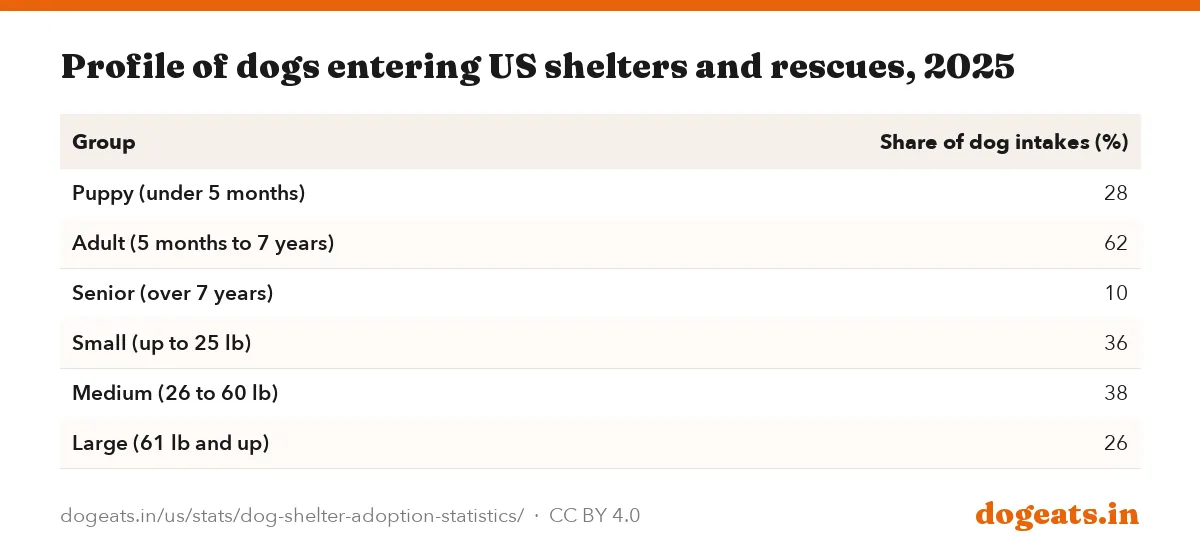
Adults made up 62% of dogs entering shelters in 2025, puppies 28% and seniors 10%. By size, 38% were medium, 36% small and 26% large.
Rescues take in smaller dogs. Small dogs were 45% of rescue dog intakes but 35% at government shelters, where large dogs were 27% to 28%.
| Group | Share of dog intakes (%) |
|---|---|
| Puppy (under 5 months) | 28 |
| Adult (5 months to 7 years) | 62 |
| Senior (over 7 years) | 10 |
| Small (up to 25 lb) | 36 |
| Medium (26 to 60 lb) | 38 |
| Large (61 lb and up) | 26 |
SAC's own text says adults were 68% of intakes, but its chart and the age shares that sum to 100% give 62%. We use 62%. Its size chart also shows large dogs at 27%, against 26% in the text.
Breed is not part of SAC's national reports. For the breeds Americans register most, see most popular dog breeds.
The South Atlantic has the most shelters and rescues
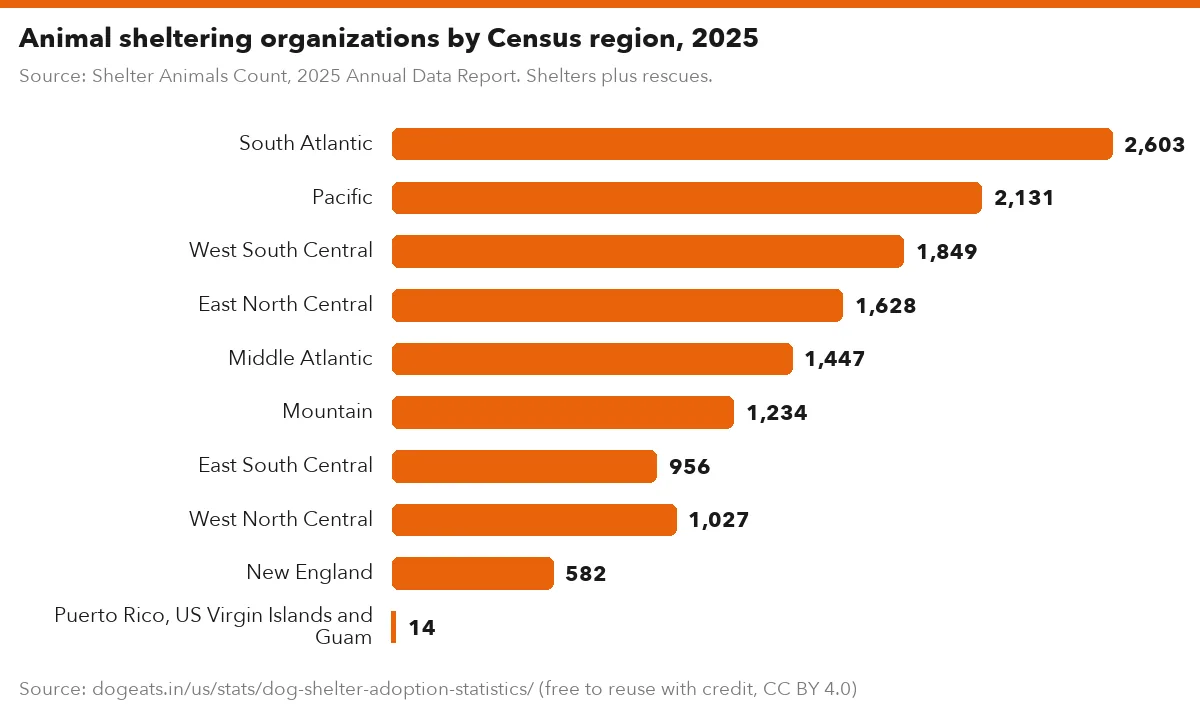
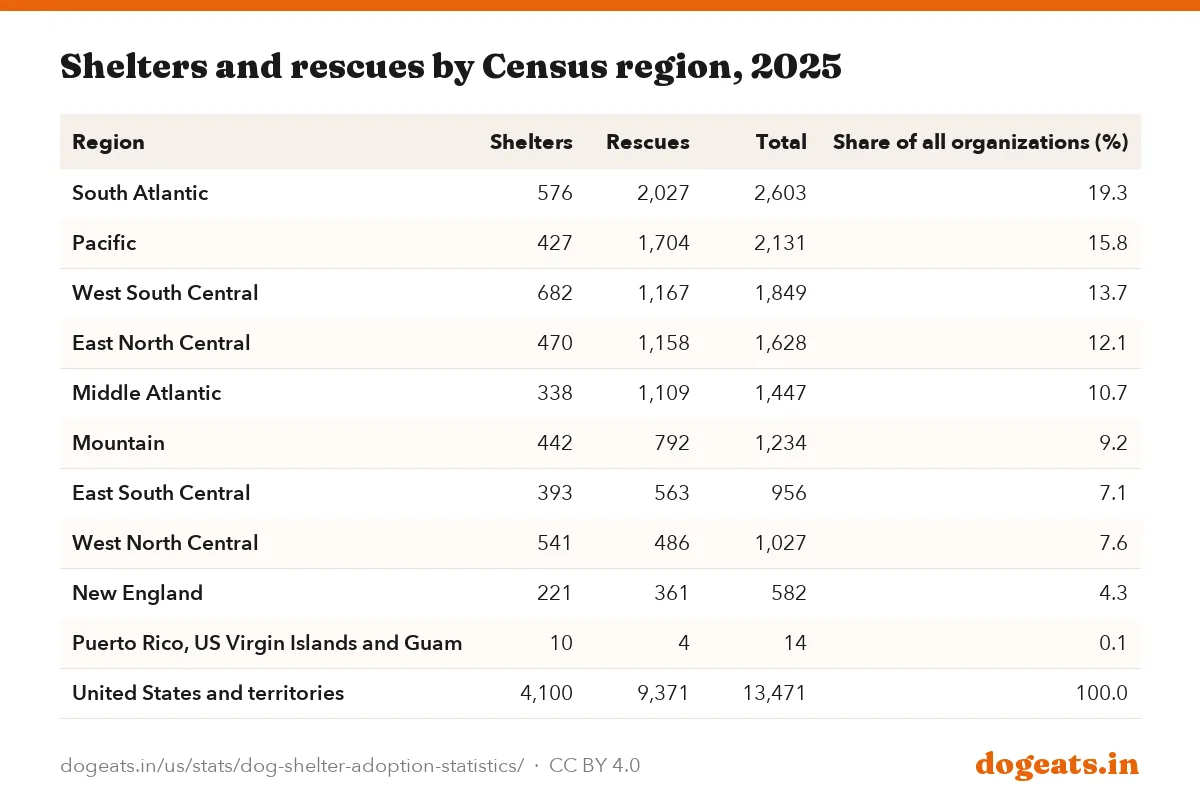
SAC counts at least 13,471 animal sheltering organizations in the US and its territories: 4,100 shelters and 9,371 rescues. Shelters handle 84% of community intakes and rescues 16%.
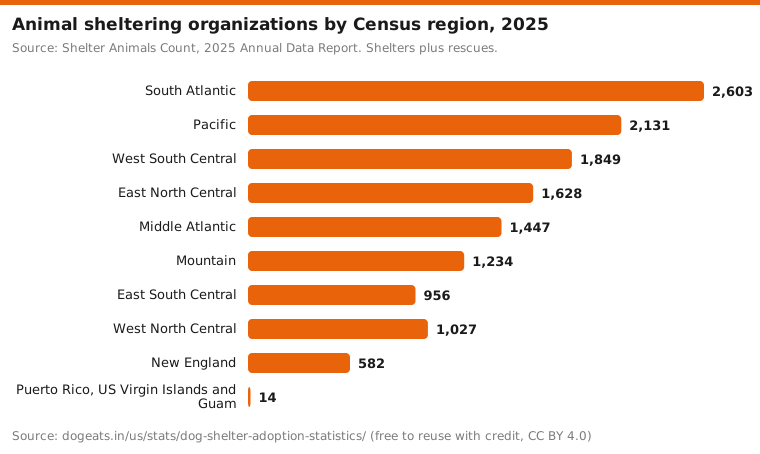
The South Atlantic region, from Delaware to Florida, has the most organizations at 2,603. The Pacific region follows with 2,131.
Source: Shelter Animals Count, 2025 Annual Data Report. Shelters plus rescues.
Show the numbers
| Label | organizations |
|---|---|
| South Atlantic | 2,603 |
| Pacific | 2,131 |
| West South Central | 1,849 |
| East North Central | 1,628 |
| Middle Atlantic | 1,447 |
| Mountain | 1,234 |
| East South Central | 956 |
| West North Central | 1,027 |
| New England | 582 |
| Puerto Rico, US Virgin Islands and Guam | 14 |
Embed this chart
| Region | Shelters | Rescues | Total | Share of all organizations (%) |
|---|---|---|---|---|
| South Atlantic | 576 | 2,027 | 2,603 | 19.3 |
| Pacific | 427 | 1,704 | 2,131 | 15.8 |
| West South Central | 682 | 1,167 | 1,849 | 13.7 |
| East North Central | 470 | 1,158 | 1,628 | 12.1 |
| Middle Atlantic | 338 | 1,109 | 1,447 | 10.7 |
| Mountain | 442 | 792 | 1,234 | 9.2 |
| East South Central | 393 | 563 | 956 | 7.1 |
| West North Central | 541 | 486 | 1,027 | 7.6 |
| New England | 221 | 361 | 582 | 4.3 |
| Puerto Rico, US Virgin Islands and Guam | 10 | 4 | 14 | 0.1 |
| United States and territories | 4,100 | 9,371 | 13,471 | 100.0 |
SAC publishes state-level figures through an interactive dashboard, not as a table in its annual reports. We could not extract verified state counts of dog intake or euthanasia, so this report stops at the regional level.
Counting organizations is not the same as counting capacity. A single county shelter can take in more dogs than dozens of small foster-based rescues.
How the national shelter numbers are estimated
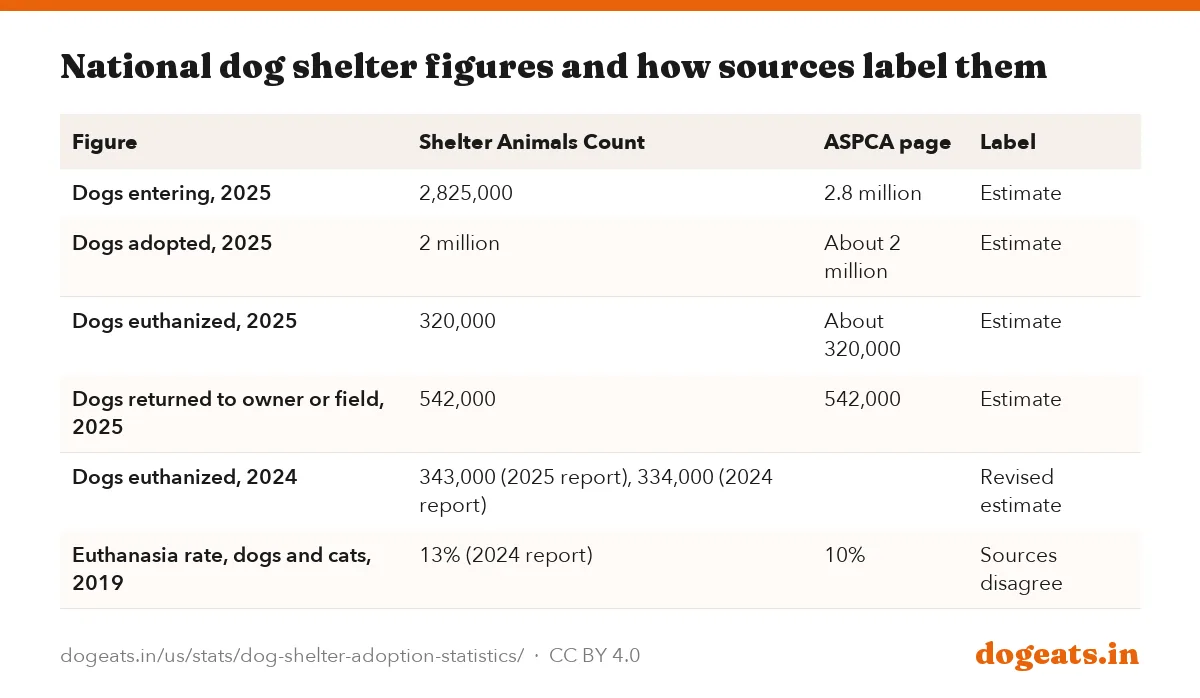
Every national shelter figure here is an estimate. SAC models national totals from the organizations that report to it.
The ASPCA's own shelter statistics page now reprints SAC's figures and labels them estimates. It gives about 2 million dog adoptions, 320,000 dog euthanasias and 542,000 dogs returned to owners in 2025.
| Figure | Shelter Animals Count | ASPCA page | Label |
|---|---|---|---|
| Dogs entering, 2025 | 2,825,000 | 2.8 million | Estimate |
| Dogs adopted, 2025 | 2 million | About 2 million | Estimate |
| Dogs euthanized, 2025 | 320,000 | About 320,000 | Estimate |
| Dogs returned to owner or field, 2025 | 542,000 | 542,000 | Estimate |
| Dogs euthanized, 2024 | 343,000 (2025 report), 334,000 (2024 report) | Revised estimate | |
| Euthanasia rate, dogs and cats, 2019 | 13% (2024 report) | 10% | Sources disagree |
- SAC's model uses monthly data from more than 6,000 organizations for 2016 to 2025, plus demographic data.
- SAC moved to a machine learning model in 2024, and each new report replaces earlier estimates.
- Rates in this report are SAC's own, mostly as a share of total intakes including transfers.
- Figures for 2020 reflect COVID-19 closures and should not be read as a normal year.
If you are adopting soon, the first weeks matter. Our holiday food dangers report lists the foods new owners most often get wrong, and dog ownership statistics shows how many US homes have dogs.
Frequently asked questions
How many dogs enter US shelters each year?
Shelter Animals Count estimates 2,825,000 dogs entered US shelters and rescues from the community in 2025, 4% fewer than in 2024. Another 717,000 dogs arrived as transfers between organizations.
How many shelter dogs are adopted each year?
About 2 million dogs were adopted from US shelters and rescues in 2025. That equals 56.6% of all dogs entering, the highest rate in SAC's 10 years of data.
How many dogs are euthanized in US shelters each year?
An estimated 320,000 shelter dogs were euthanized in 2025, down from 343,000 in 2024. It works out to about 877 dogs a day, and dogs were 53.6% of all dog and cat euthanasia.
Are more dogs or cats euthanized in shelters?
More dogs. In 2025 shelters euthanized about 320,000 dogs and 277,000 cats, even though about 3 million cats entered against 2.8 million dogs.
How long do dogs stay in shelters before adoption?
The median was 13 days in 2025, down from 15 days in 2024. Large dogs waited 17 days, medium dogs 14 and small dogs 10.
Why are US shelters full?
More dogs have entered shelters than left every year since 2016, with the worst years in 2021 and 2022. Fewer transfers between shelters, fewer lost dogs returned home and longer stays for large dogs all add to the backlog.
Are senior dogs harder to adopt?
Yes. Senior dogs had a 37% adoption rate in 2025, against 54% for puppies and adult dogs. Senior cats did much better, at 61%.
How many animal shelters are there in the US?
Shelter Animals Count lists at least 13,471 organizations: 4,100 shelters and 9,371 rescues. The South Atlantic region has the most, with 2,603.
Are the national shelter numbers exact counts?
No. They are Shelter Animals Count estimates modeled from organizations that report data, and they are revised each year. The ASPCA republishes the same figures and labels them estimates.
Methodology and limitations
This report uses Shelter Animals Count's 2025 Annual Data Report as its main source, with its 2024 Annual Analysis for comparisons with 2019. We opened every source listed below and read figures from the report text and charts.
Daily euthanasia, dog share of euthanasia, percentage changes and regional totals are dogeats.in calculations from SAC's published figures. SAC rounds most counts to the nearest 1,000.
Where SAC's 2025 report revised a 2024 figure, we use the revised number and show the earlier one in a table. Where SAC's text and charts disagree, we say which we used.
Sources
- Shelter Animals Count, 2025 Annual Data Report (PDF), 2025 dog and cat intakes and outcomes, 10-year rates, population balance, length of stay, organizations
- Shelter Animals Count, 2024 Annual Analysis (PDF), 2019 comparisons, 2019 and 2024 length of stay, transfers, capacity crisis
- ASPCA, US Animal Shelter Statistics, Estimates of dog adoptions, euthanasia and returns, 2019 to 2025 euthanasia rate
- Also consulted: Shelter Animals Count, 2025 Annual Data Report web summary, Shelter Animals Count press release, February 2026.
Cite, embed and download
This report, its data and its images are free to reuse under a Creative Commons Attribution 4.0 licence. Credit dogeats.in with a link to this page. Every chart has its own embed code, every table has a CSV and an image download, and the images below are ready for social posts, slides and articles.
Cite this report
Link to this report
Every chart and table as an image