Tracker · Updated October 2026
Pet inflation in the US: how fast vet bills and pet food prices are going up
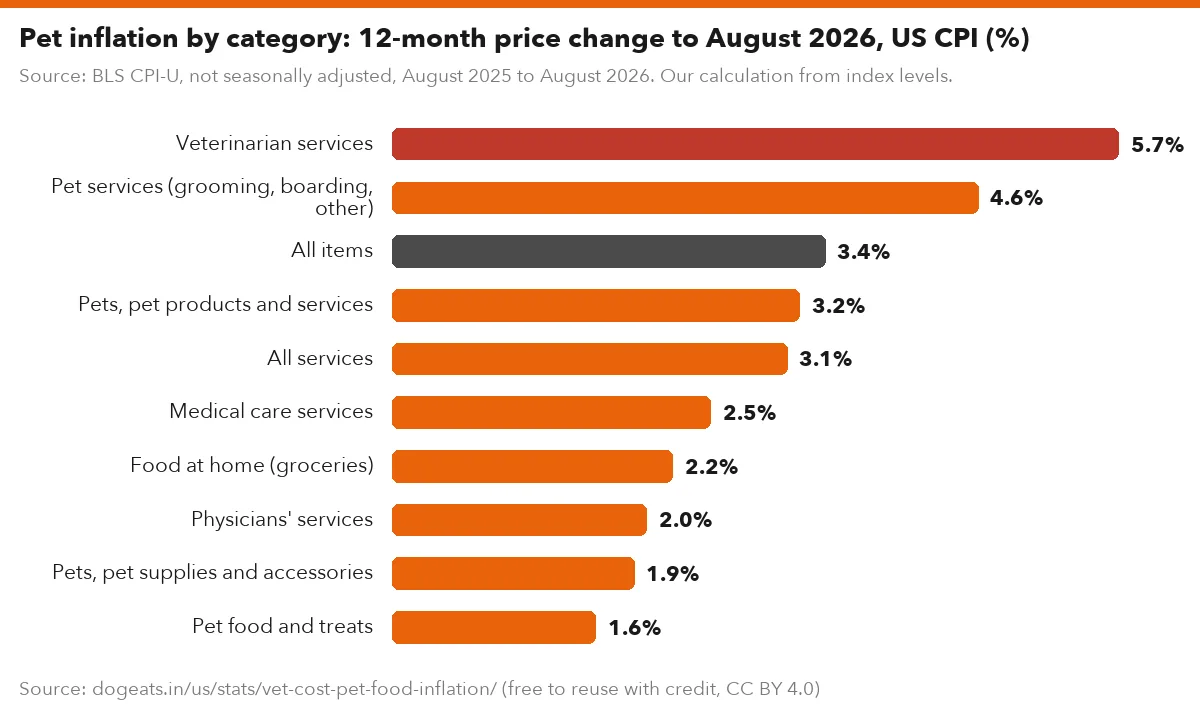
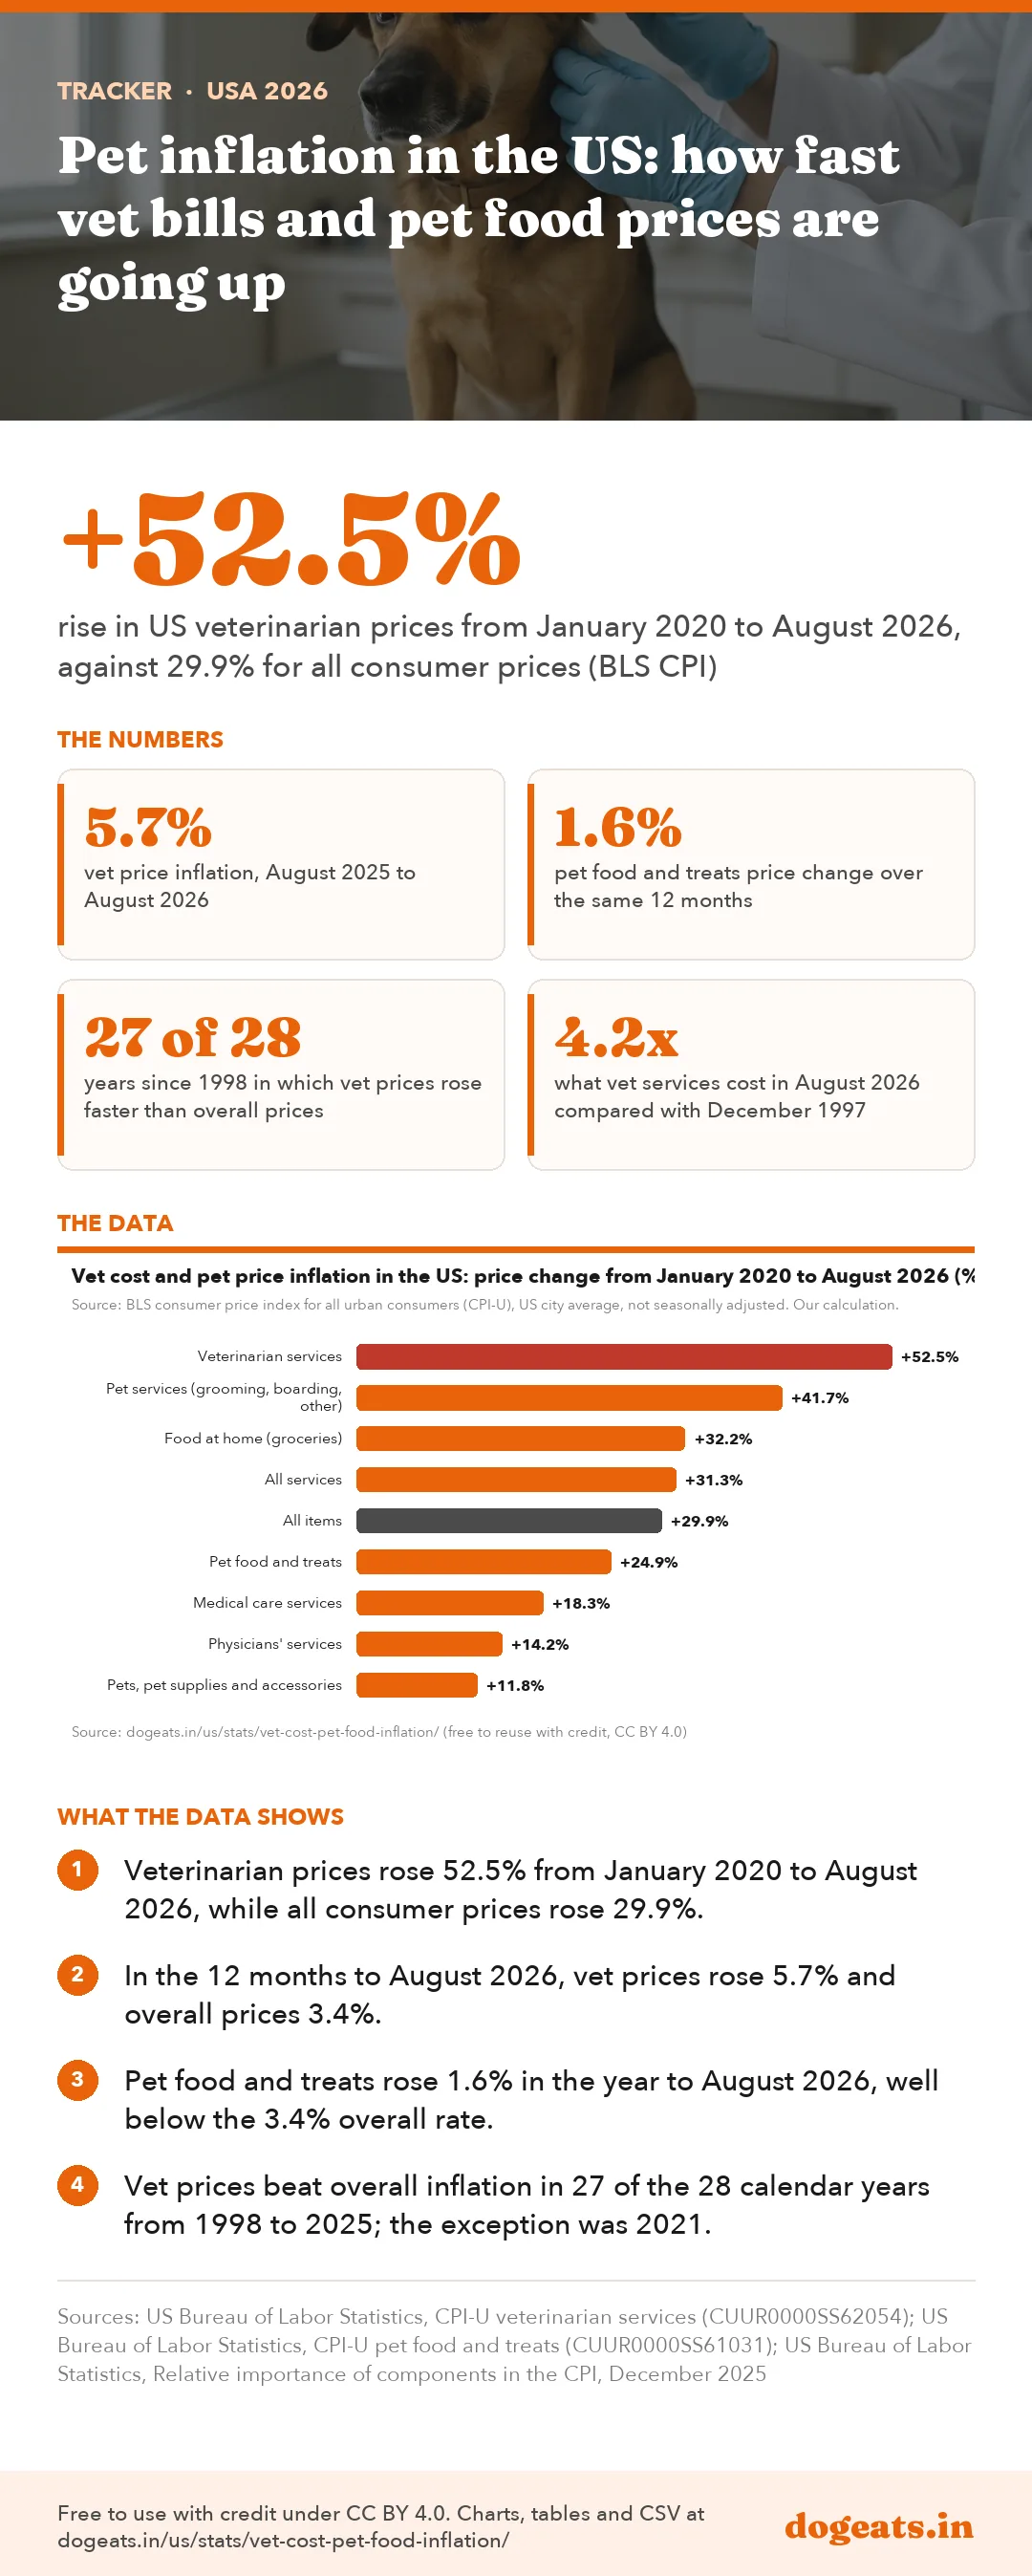
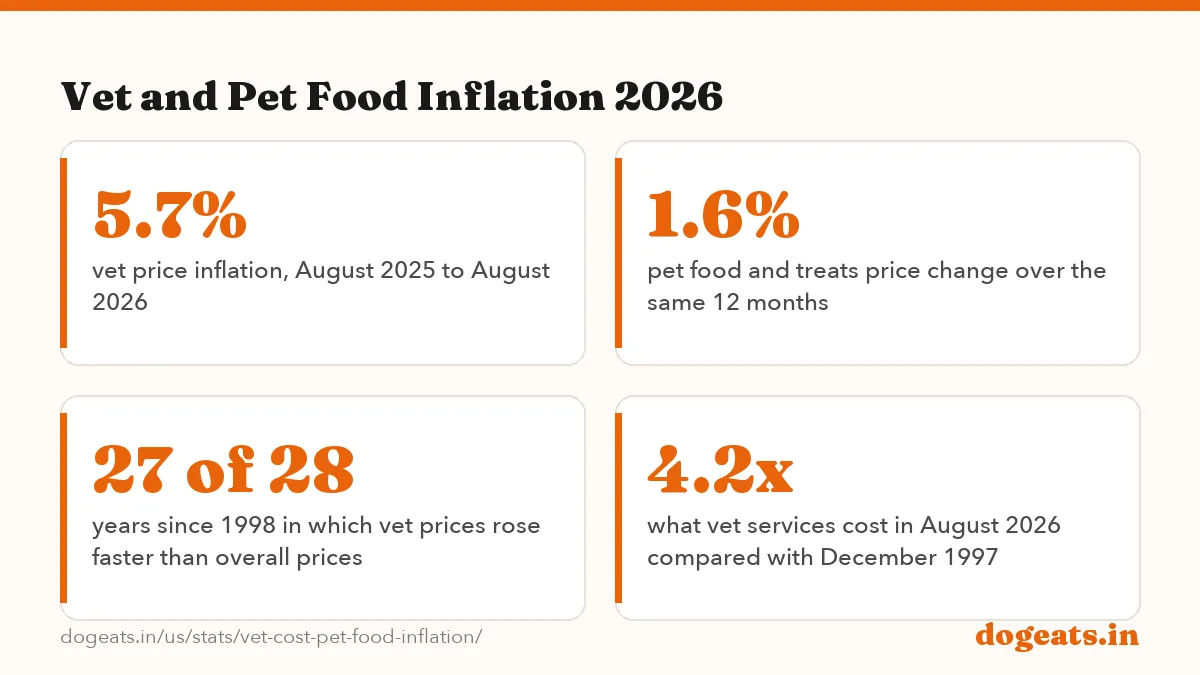
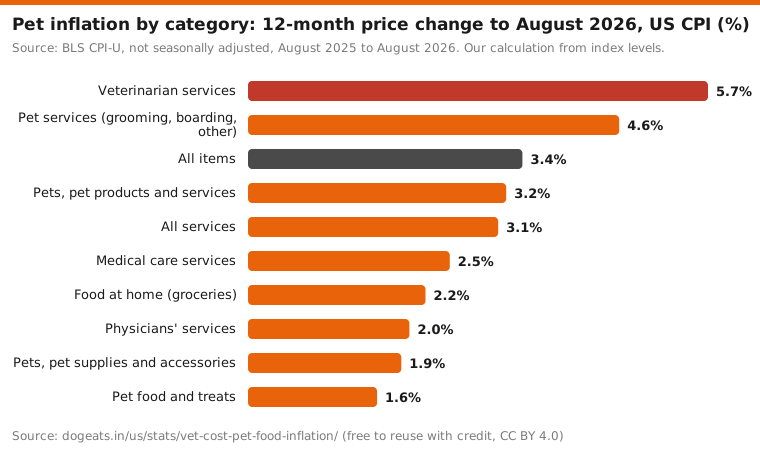
Vet bills are going up faster than prices in general. The consumer price index for veterinarian services rose 5.7% in the year to August 2026, against 3.4% for all items, BLS data show. Pet food prices rose 1.6%, after falling through much of 2024 and early 2025.
Key findings
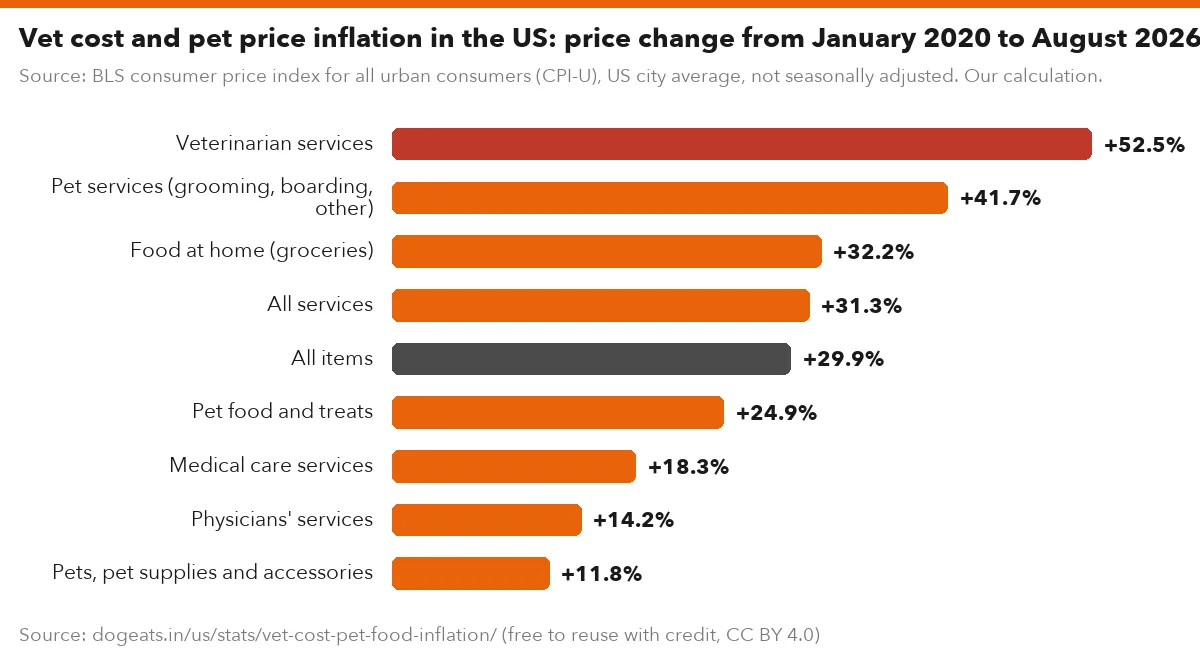
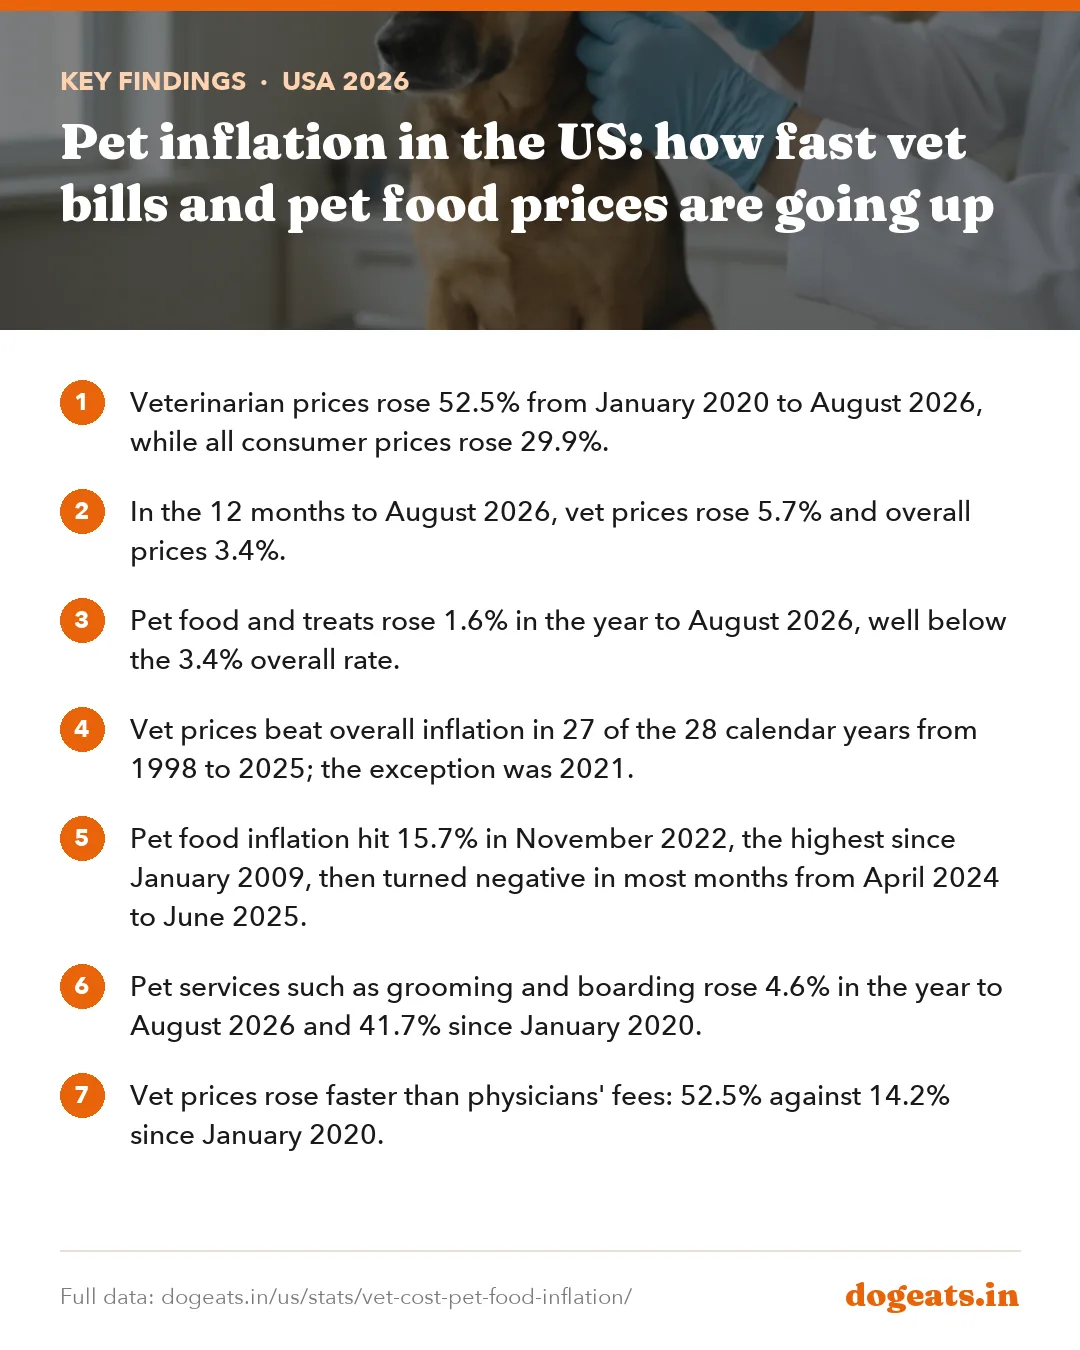
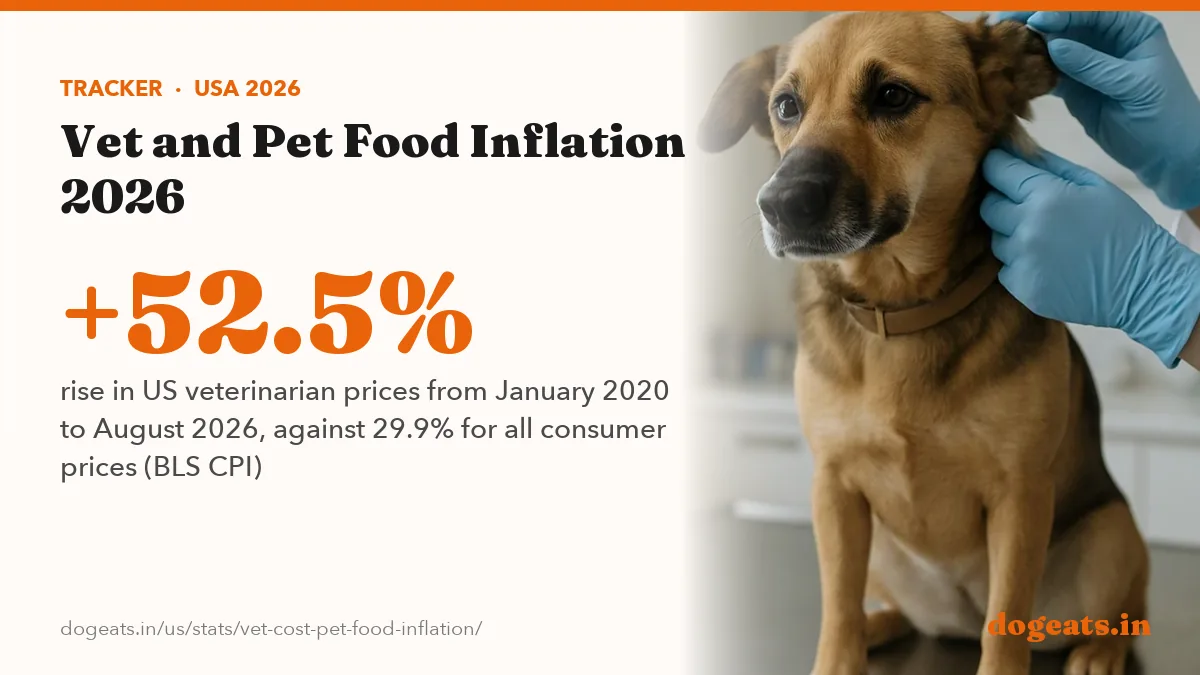
- Veterinarian prices rose 52.5% from January 2020 to August 2026, while all consumer prices rose 29.9%.
- In the 12 months to August 2026, vet prices rose 5.7% and overall prices 3.4%.
- Pet food and treats rose 1.6% in the year to August 2026, well below the 3.4% overall rate.
- Vet prices beat overall inflation in 27 of the 28 calendar years from 1998 to 2025; the exception was 2021.
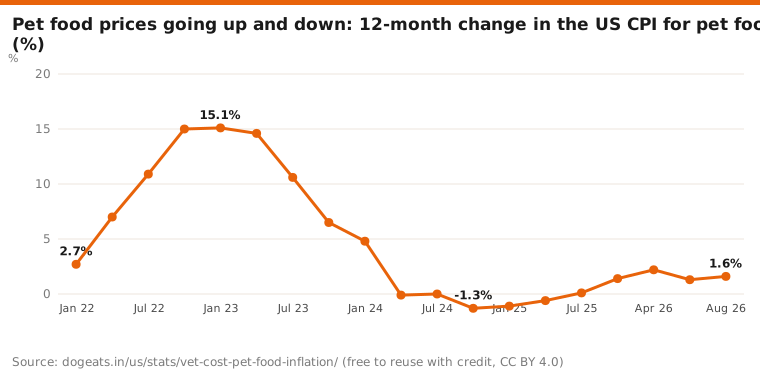
- Pet food inflation hit 15.7% in November 2022, the highest since January 2009, then turned negative in most months from April 2024 to June 2025.
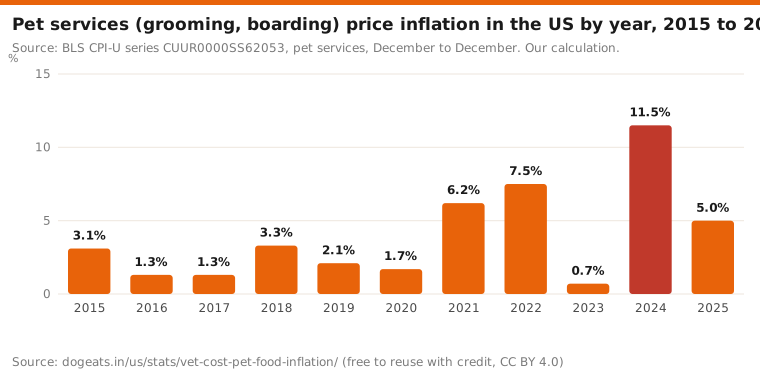
- Pet services such as grooming and boarding rose 4.6% in the year to August 2026 and 41.7% since January 2020.
- Vet prices rose faster than physicians' fees: 52.5% against 14.2% since January 2020.
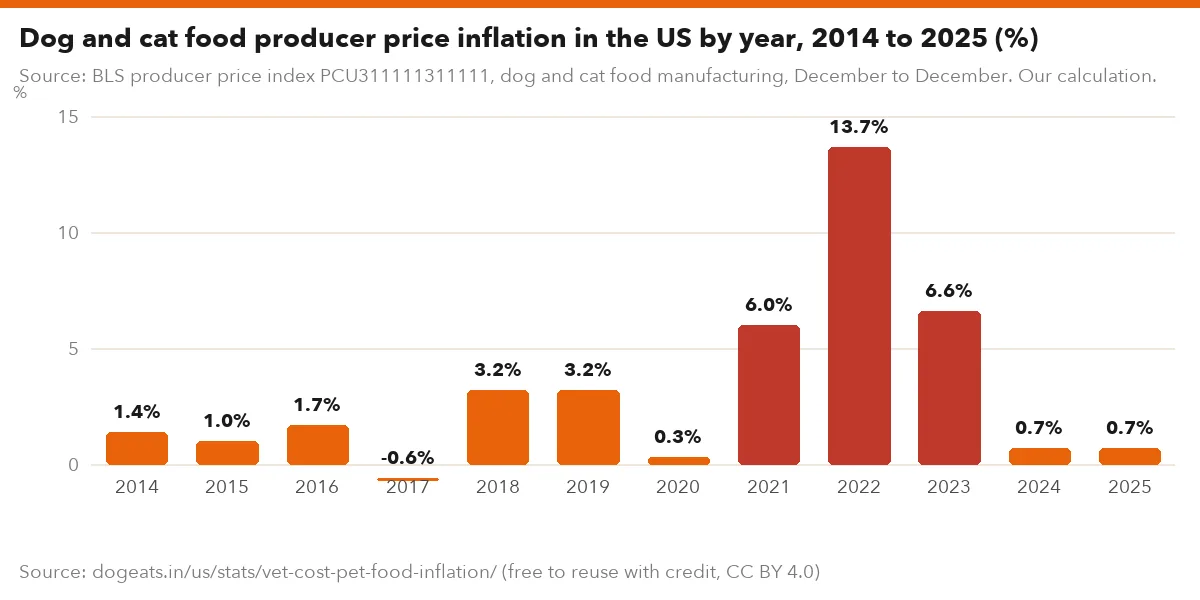
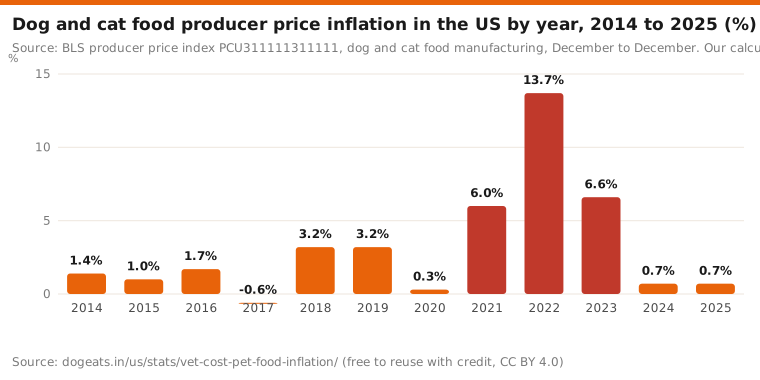
- Producer prices for dog and cat food rose 13.7% in 2022 and just 0.7% in each of 2024 and 2025.
- Pets, pet products and services carry 1.158% of the weight in the consumer price index, as of December 2025.
Are vet bills going up?
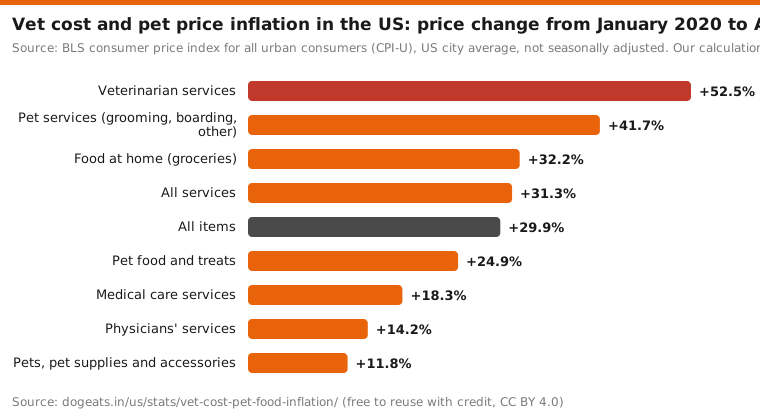
Yes, and faster than most prices. The consumer price index for veterinarian services rose 52.5% from January 2020 to August 2026. All consumer prices rose 29.9% over the same period.
Grooming, boarding and other pet services rose 41.7%. Pet food and treats rose 24.9%, less than groceries overall at 32.2%.
Vet care also outpaced human health care in this index. Physicians' services rose 14.2% and all medical care services 18.3% since January 2020.
Source: BLS consumer price index for all urban consumers (CPI-U), US city average, not seasonally adjusted. Our calculation.
Show the numbers
| Label | % |
|---|---|
| Veterinarian services | +52.5% |
| Pet services (grooming, boarding, other) | +41.7% |
| Food at home (groceries) | +32.2% |
| All services | +31.3% |
| All items | +29.9% |
| Pet food and treats | +24.9% |
| Medical care services | +18.3% |
| Physicians' services | +14.2% |
| Pets, pet supplies and accessories | +11.8% |
Embed this chart
The CPI tracks price changes for the same services over time. It does not show what any one clinic charges or how much owners spend in total.
Pet inflation in the latest 12 months
In the 12 months to August 2026, veterinarian prices rose 5.7%. Overall consumer prices rose 3.4%, so vet care inflation ran 2.3 points higher.
Pet services rose 4.6%. The broad pets, pet products and services index rose 3.2%, close to overall inflation.
Pet food and treats rose 1.6%, and pets, supplies and accessories 1.9%. Goods for pets are rising more slowly than services for pets.
Source: BLS CPI-U, not seasonally adjusted, August 2025 to August 2026. Our calculation from index levels.
Show the numbers
| Label | % |
|---|---|
| Veterinarian services | 5.7% |
| Pet services (grooming, boarding, other) | 4.6% |
| All items | 3.4% |
| Pets, pet products and services | 3.2% |
| All services | 3.1% |
| Medical care services | 2.5% |
| Food at home (groceries) | 2.2% |
| Physicians' services | 2.0% |
| Pets, pet supplies and accessories | 1.9% |
| Pet food and treats | 1.6% |
Embed this chart
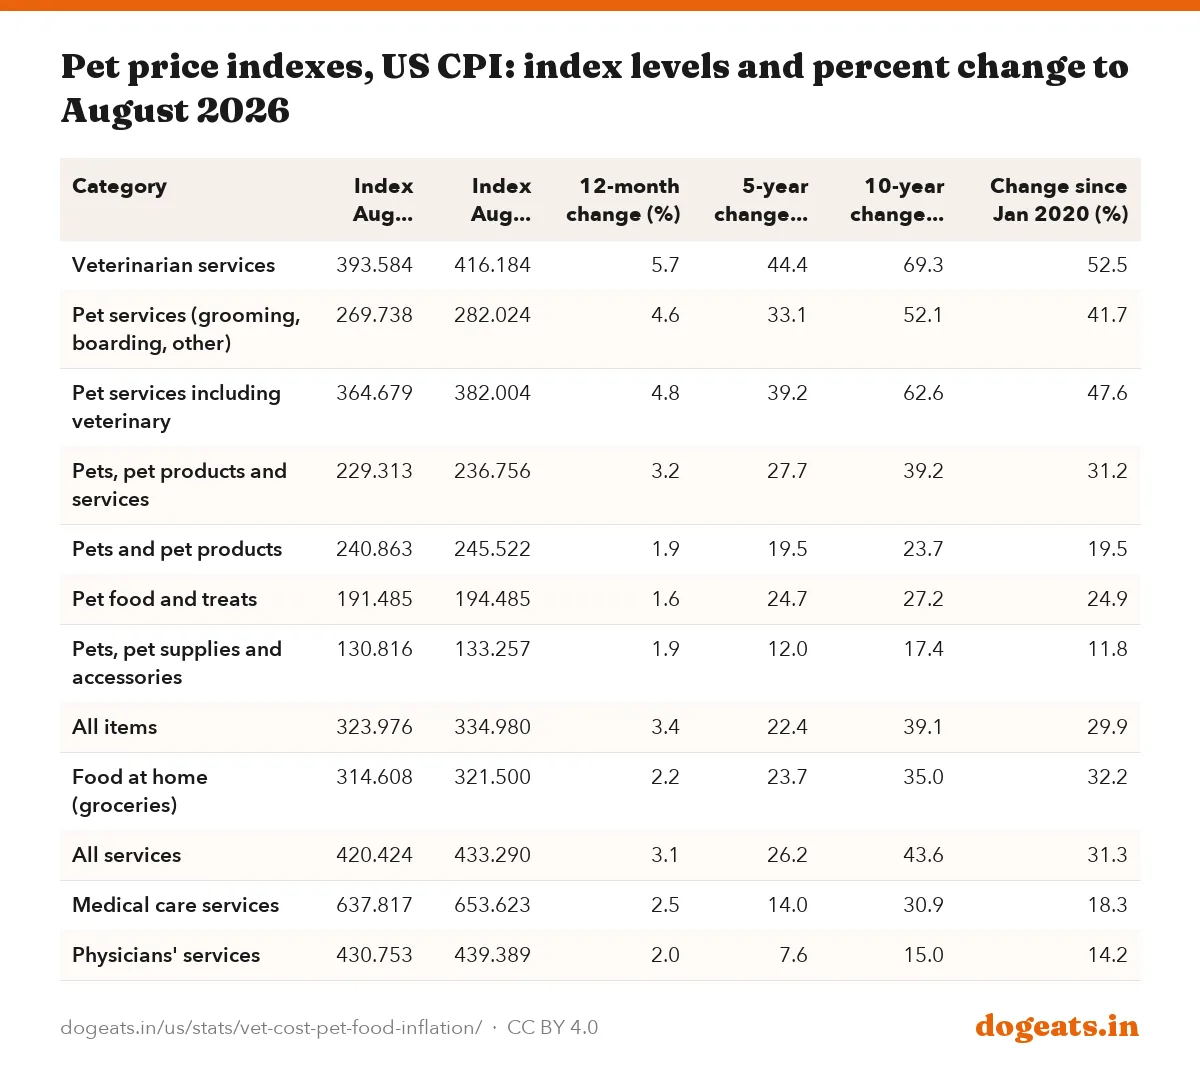
| Category | Index Aug 2025 | Index Aug 2026 | 12-month change (%) | 5-year change (%) | 10-year change (%) | Change since Jan 2020 (%) |
|---|---|---|---|---|---|---|
| Veterinarian services | 393.584 | 416.184 | 5.7 | 44.4 | 69.3 | 52.5 |
| Pet services (grooming, boarding, other) | 269.738 | 282.024 | 4.6 | 33.1 | 52.1 | 41.7 |
| Pet services including veterinary | 364.679 | 382.004 | 4.8 | 39.2 | 62.6 | 47.6 |
| Pets, pet products and services | 229.313 | 236.756 | 3.2 | 27.7 | 39.2 | 31.2 |
| Pets and pet products | 240.863 | 245.522 | 1.9 | 19.5 | 23.7 | 19.5 |
| Pet food and treats | 191.485 | 194.485 | 1.6 | 24.7 | 27.2 | 24.9 |
| Pets, pet supplies and accessories | 130.816 | 133.257 | 1.9 | 12.0 | 17.4 | 11.8 |
| All items | 323.976 | 334.980 | 3.4 | 22.4 | 39.1 | 29.9 |
| Food at home (groceries) | 314.608 | 321.500 | 2.2 | 23.7 | 35.0 | 32.2 |
| All services | 420.424 | 433.290 | 3.1 | 26.2 | 43.6 | 31.3 |
| Medical care services | 637.817 | 653.623 | 2.5 | 14.0 | 30.9 | 18.3 |
| Physicians' services | 430.753 | 439.389 | 2.0 | 7.6 | 15.0 | 14.2 |
On a seasonally adjusted basis, vet prices rose 1.1% from July to August 2026, against 0.4% for all items. Pet food slipped 0.1% in the month.
Most pet series are set to 100 in December 1997. Pets and pet products, all items, groceries and the medical series use a 1982 to 1984 base, so compare percent changes, not levels.
Vet prices have beaten inflation almost every year since 1998
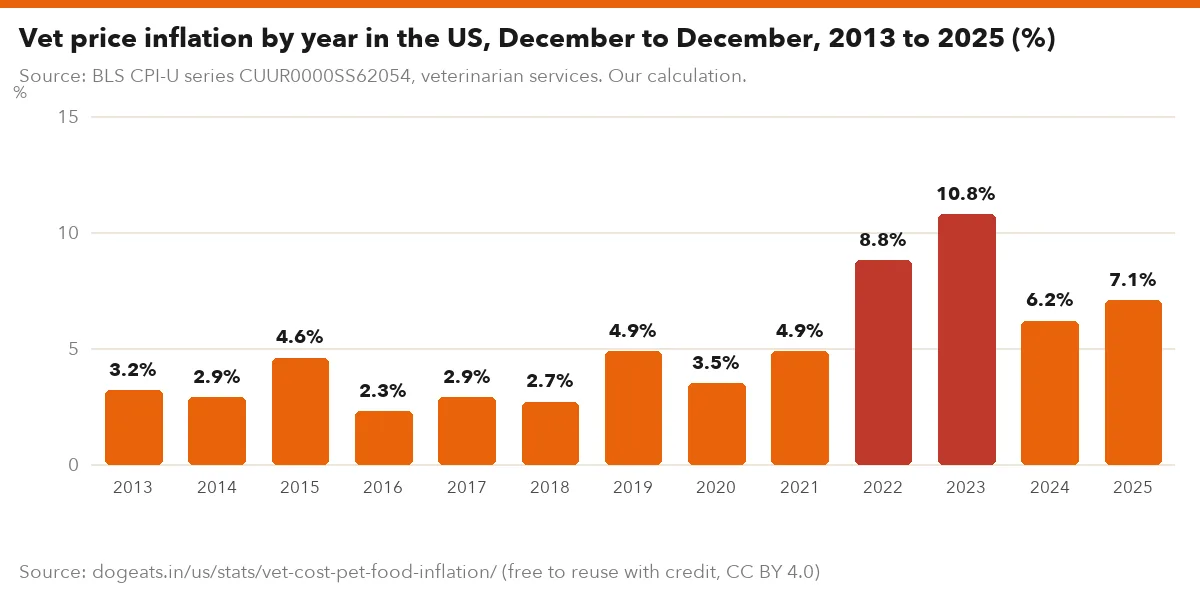
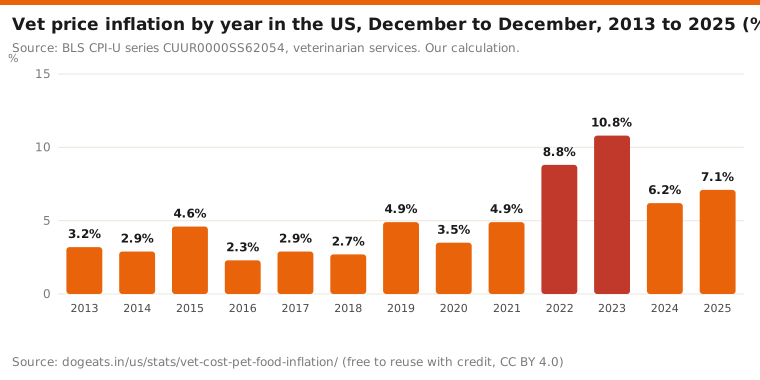
Vet prices rose faster than overall prices in 27 of the 28 calendar years from 1998 to 2025, measured December to December. The only exception was 2021, when overall prices jumped 7.0% and vet prices 4.9%.
The fastest years were recent. Vet prices rose 8.8% in 2022, 10.8% in 2023, 6.2% in 2024 and 7.1% in 2025.
The peak 12-month rise was 11.6% in September 2022. Over the four years from December 2021 to December 2025, vet prices rose 37.0%, against 16.2% for all items.
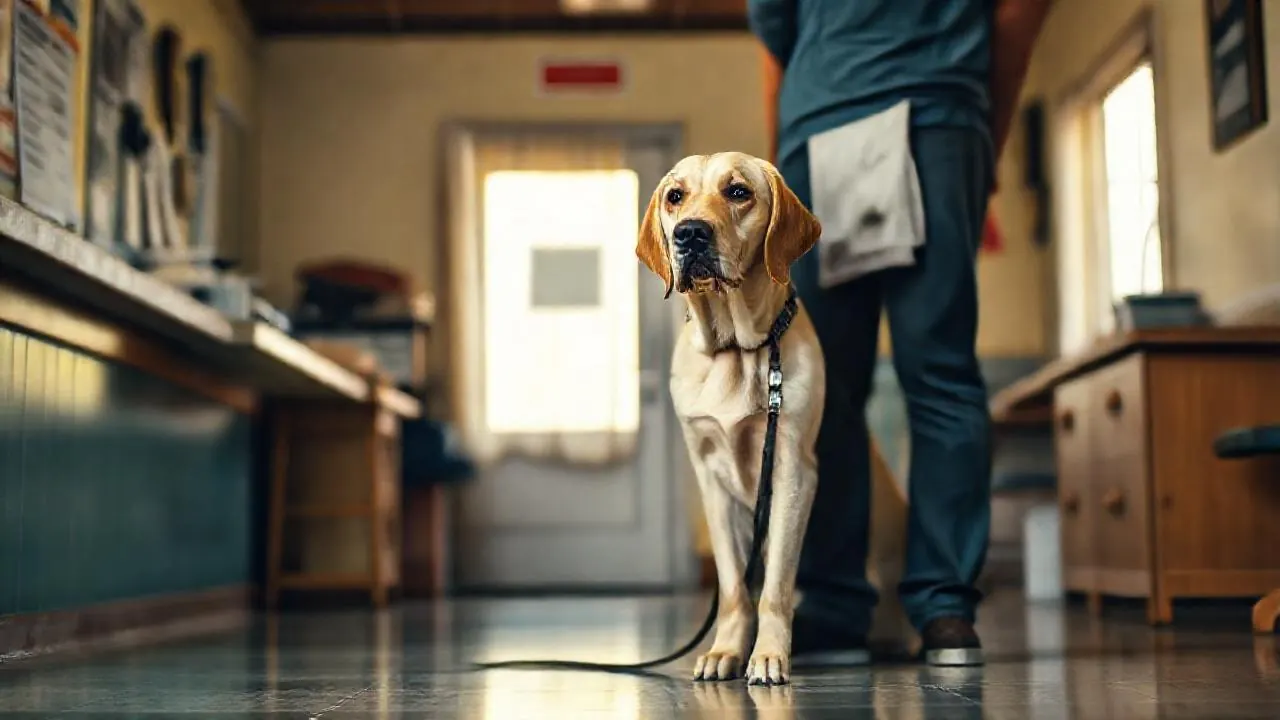
Source: BLS CPI-U series CUUR0000SS62054, veterinarian services. Our calculation.
Show the numbers
| Label | % |
|---|---|
| 2013 | 3.2% |
| 2014 | 2.9% |
| 2015 | 4.6% |
| 2016 | 2.3% |
| 2017 | 2.9% |
| 2018 | 2.7% |
| 2019 | 4.9% |
| 2020 | 3.5% |
| 2021 | 4.9% |
| 2022 | 8.8% |
| 2023 | 10.8% |
| 2024 | 6.2% |
| 2025 | 7.1% |
Embed this chart
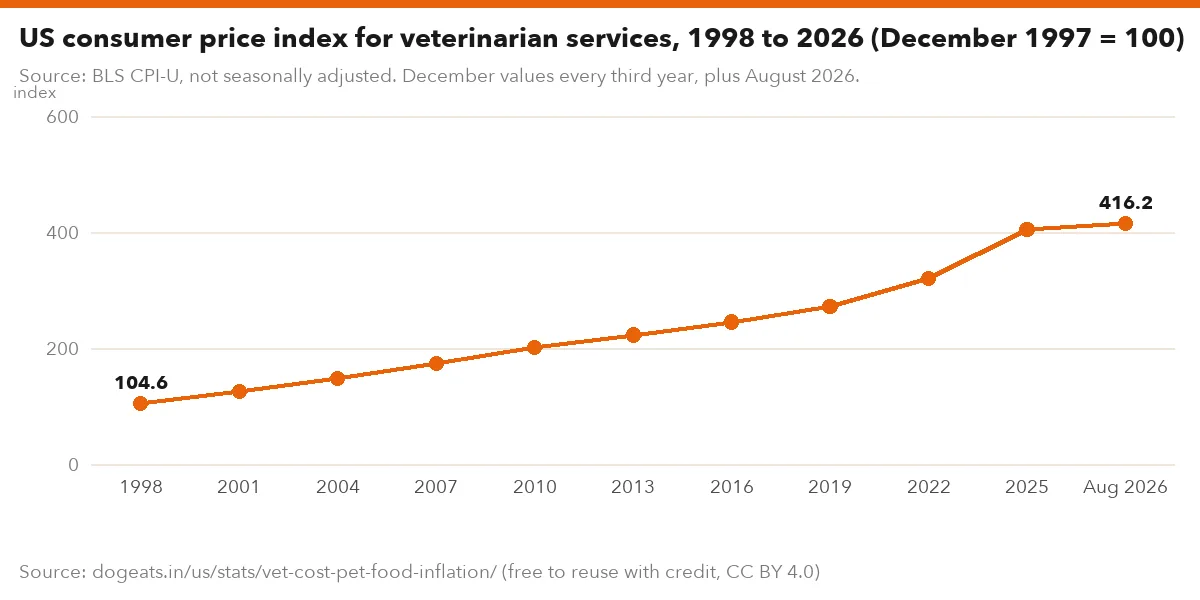
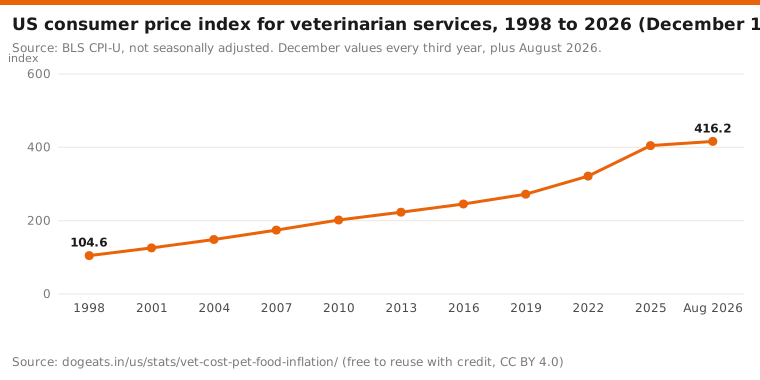
Source: BLS CPI-U, not seasonally adjusted. December values every third year, plus August 2026.
Show the numbers
| Label | index |
|---|---|
| 1998 | 104.6 |
| 2001 | 125.7 |
| 2004 | 148.6 |
| 2007 | 174.4 |
| 2010 | 201.7 |
| 2013 | 223.1 |
| 2016 | 245.5 |
| 2019 | 272.1 |
| 2022 | 321.4 |
| 2025 | 404.9 |
| Aug 2026 | 416.2 |
Embed this chart
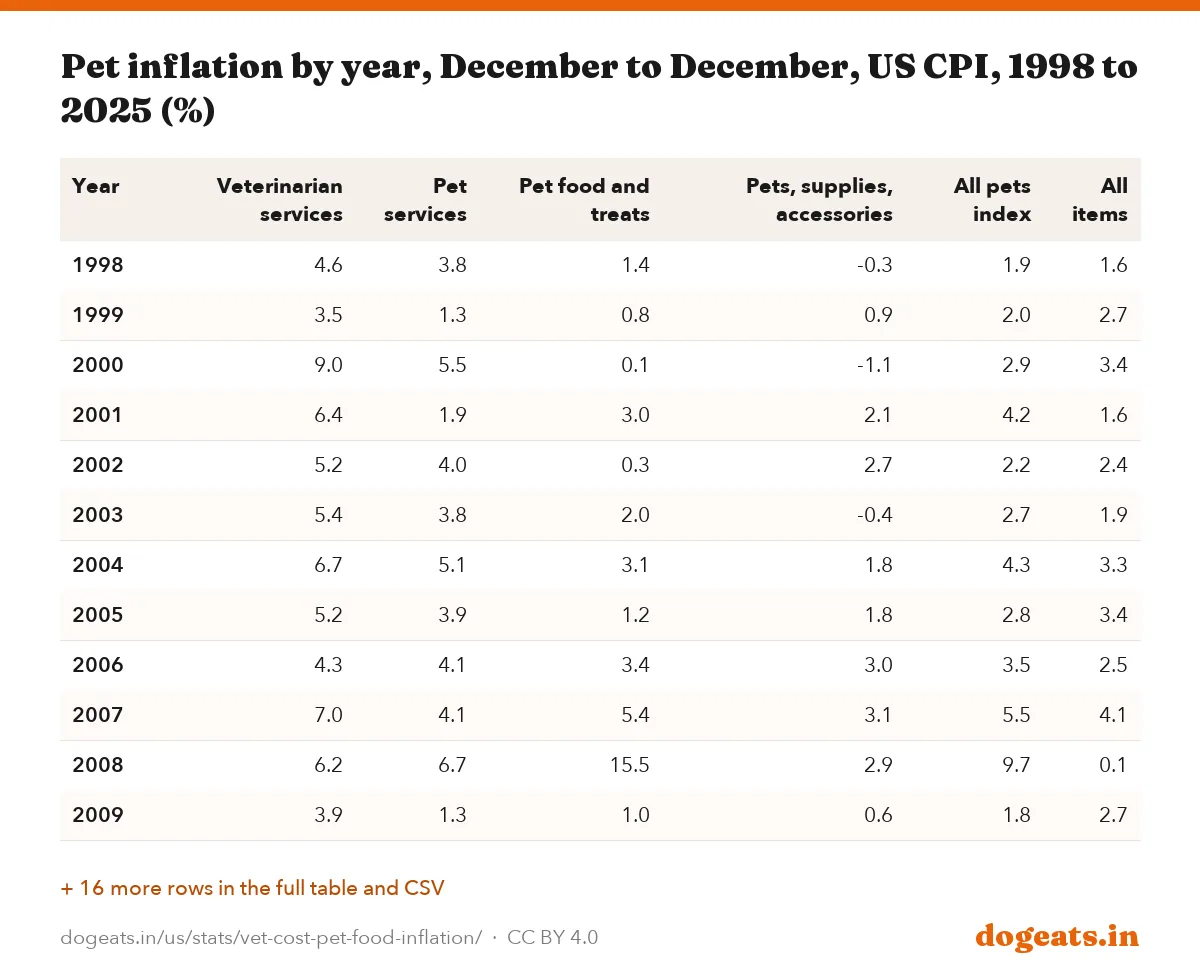
| Year | Veterinarian services | Pet services | Pet food and treats | Pets, supplies, accessories | All pets index | All items |
|---|---|---|---|---|---|---|
| 1998 | 4.6 | 3.8 | 1.4 | -0.3 | 1.9 | 1.6 |
| 1999 | 3.5 | 1.3 | 0.8 | 0.9 | 2.0 | 2.7 |
| 2000 | 9.0 | 5.5 | 0.1 | -1.1 | 2.9 | 3.4 |
| 2001 | 6.4 | 1.9 | 3.0 | 2.1 | 4.2 | 1.6 |
| 2002 | 5.2 | 4.0 | 0.3 | 2.7 | 2.2 | 2.4 |
| 2003 | 5.4 | 3.8 | 2.0 | -0.4 | 2.7 | 1.9 |
| 2004 | 6.7 | 5.1 | 3.1 | 1.8 | 4.3 | 3.3 |
| 2005 | 5.2 | 3.9 | 1.2 | 1.8 | 2.8 | 3.4 |
| 2006 | 4.3 | 4.1 | 3.4 | 3.0 | 3.5 | 2.5 |
| 2007 | 7.0 | 4.1 | 5.4 | 3.1 | 5.5 | 4.1 |
| 2008 | 6.2 | 6.7 | 15.5 | 2.9 | 9.7 | 0.1 |
| 2009 | 3.9 | 1.3 | 1.0 | 0.6 | 1.8 | 2.7 |
| 2010 | 4.8 | 2.0 | -0.1 | -2.4 | 1.2 | 1.5 |
| 2011 | 4.6 | 4.5 | 3.6 | 2.2 | 3.6 | 3.0 |
| 2012 | 2.4 | 2.2 | 2.9 | -2.4 | 1.6 | 1.7 |
| 2013 | 3.2 | 3.0 | 1.1 | -0.7 | 1.3 | 1.5 |
| 2014 | 2.9 | 1.8 | 0.4 | 0.4 | 1.2 | 0.8 |
| 2015 | 4.6 | 3.1 | -1.5 | -2.4 | 0.4 | 0.7 |
| 2016 | 2.3 | 1.3 | -0.1 | 1.5 | 1.3 | 2.1 |
| 2017 | 2.9 | 1.3 | -1.9 | -1.0 | 0.1 | 2.1 |
| 2018 | 2.7 | 3.3 | 1.3 | 3.3 | 2.4 | 1.9 |
| 2019 | 4.9 | 2.1 | 3.4 | 2.2 | 3.6 | 2.3 |
| 2020 | 3.5 | 1.7 | -0.7 | -3.3 | 0.4 | 1.4 |
| 2021 | 4.9 | 6.2 | 2.4 | 3.4 | 4.1 | 7.0 |
| 2022 | 8.8 | 7.5 | 15.2 | 8.7 | 10.9 | 6.5 |
| 2023 | 10.8 | 0.7 | 5.1 | 0.1 | 5.1 | 3.4 |
| 2024 | 6.2 | 11.5 | -1.7 | 1.5 | 2.0 | 2.9 |
| 2025 | 7.1 | 5.0 | 1.2 | 1.0 | 3.5 | 2.7 |
Over the full series, the vet index climbed from 100 in December 1997 to 416.2 in August 2026, a rise of 316.2%. All items rose 107.7% over the same span.
Our sibling report on the cost of owning a dog uses yearly averages of the same BLS series. Its figures differ slightly from the December-to-December changes here.
Are pet food prices going up?
Pet food prices are rising again, but slowly. The CPI for pet food and treats rose 1.6% in the year to August 2026, under half the overall rate of 3.4%.
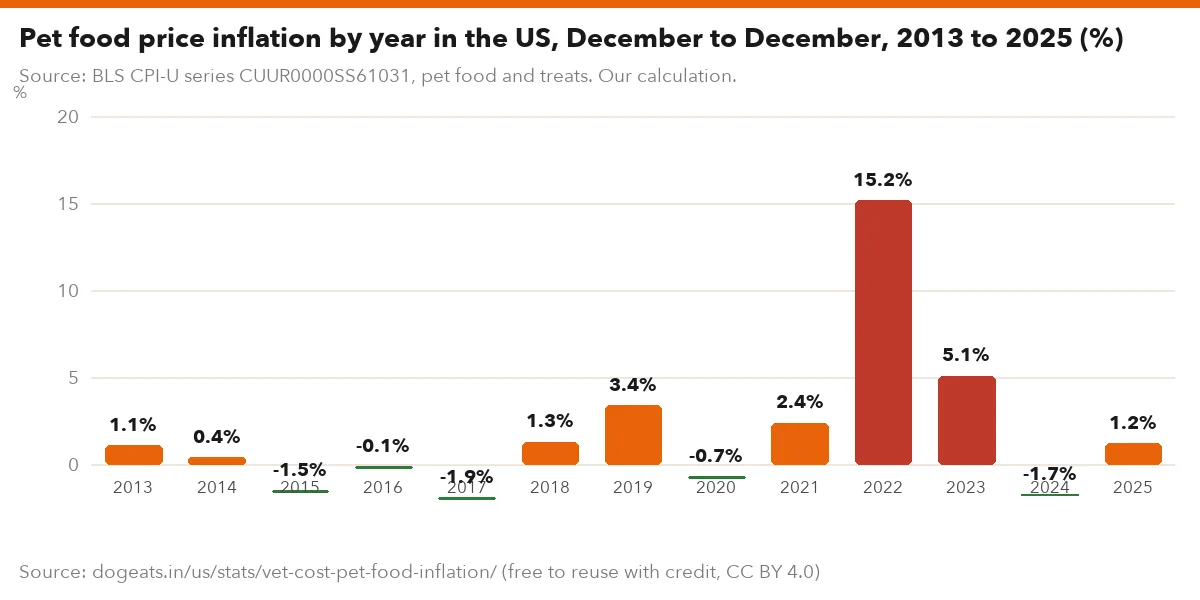
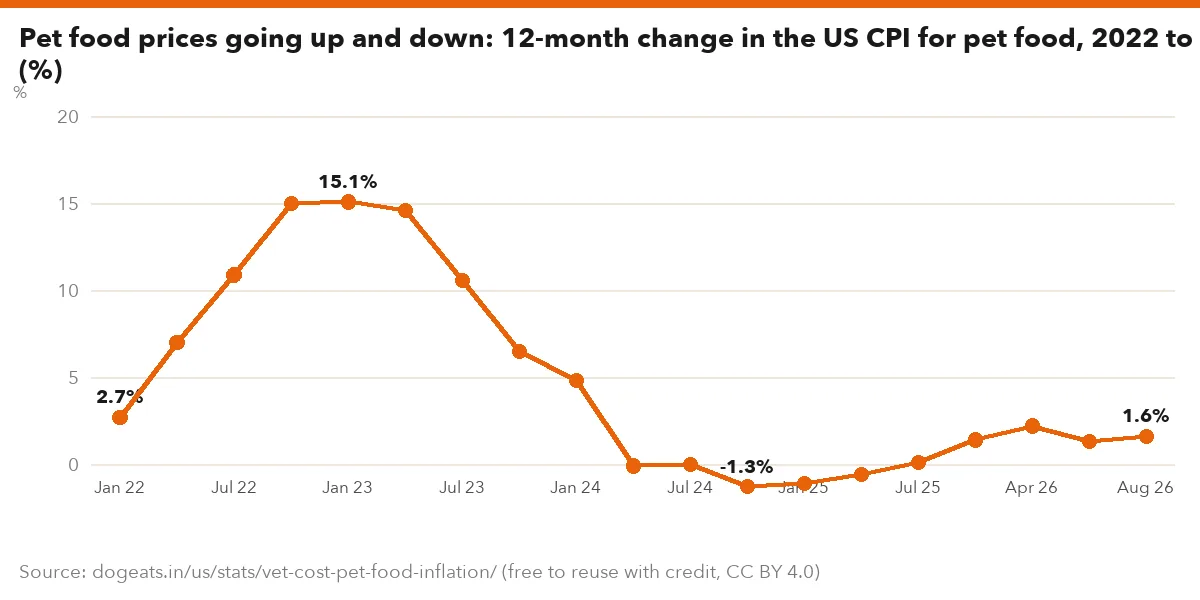
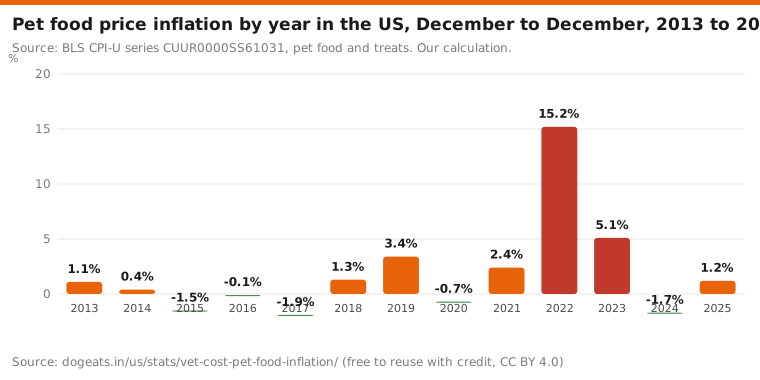
The big jump came in 2022. Pet food prices rose 15.2% that year and 5.1% in 2023, a combined 21.0% over two years. Annual pet food inflation reached 15.7% in November 2022, the highest since 16.1% in January 2009.
Prices then eased. Pet food fell 1.7% in 2024, and the 12-month change was negative in 14 of the 15 published months from April 2024 to June 2025.
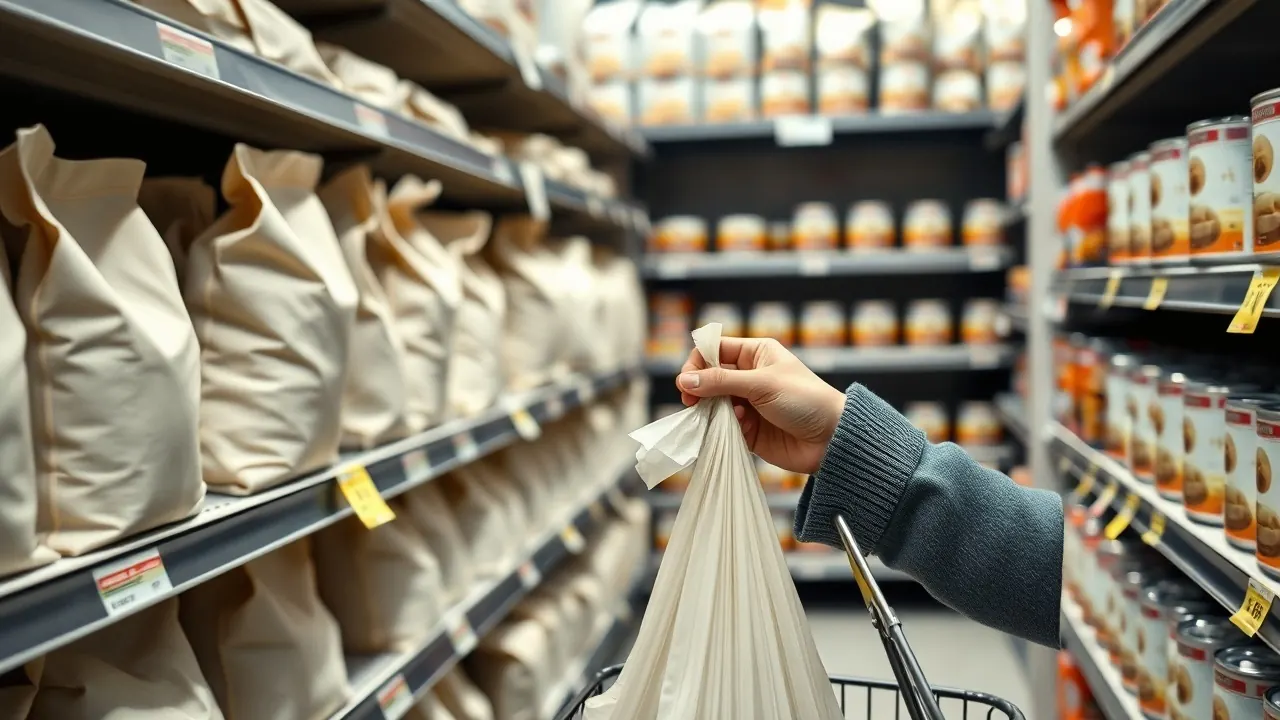
Source: BLS CPI-U series CUUR0000SS61031, pet food and treats. Our calculation.
Show the numbers
| Label | % |
|---|---|
| 2013 | 1.1% |
| 2014 | 0.4% |
| 2015 | -1.5% |
| 2016 | -0.1% |
| 2017 | -1.9% |
| 2018 | 1.3% |
| 2019 | 3.4% |
| 2020 | -0.7% |
| 2021 | 2.4% |
| 2022 | 15.2% |
| 2023 | 5.1% |
| 2024 | -1.7% |
| 2025 | 1.2% |
Embed this chart
Source: BLS CPI-U. Quarterly points plus August 2026. October 2025 was not published.
Show the numbers
| Label | % |
|---|---|
| Jan 22 | 2.7% |
| Apr 22 | 7.0% |
| Jul 22 | 10.9% |
| Oct 22 | 15.0% |
| Jan 23 | 15.1% |
| Apr 23 | 14.6% |
| Jul 23 | 10.6% |
| Oct 23 | 6.5% |
| Jan 24 | 4.8% |
| Apr 24 | -0.1% |
| Jul 24 | -0.0% |
| Oct 24 | -1.3% |
| Jan 25 | -1.1% |
| Apr 25 | -0.6% |
| Jul 25 | 0.1% |
| Jan 26 | 1.4% |
| Apr 26 | 2.2% |
| Jul 26 | 1.3% |
| Aug 26 | 1.6% |
Embed this chart
Pet food rose 24.9% from January 2020 to August 2026, slower than overall prices at 29.9%. Over 10 years to August 2026 it rose 27.2%, against 39.1% for all items.
A price index does not capture shrinking bag sizes or shifts to premium brands unless BLS adjusts for them. Owners who trade up will see bigger bills than the index shows.
What pet food makers charge
The producer price index for dog and cat food manufacturing tracks what makers receive for their products. It measures prices at the factory gate, not on the shelf.
Producer prices rose 6.0% in 2021 and 13.7% in 2022, December to December. They rose 6.6% in 2023, then 0.7% in 2024 and 0.7% in 2025.
From December 2019 to December 2025, producer prices for dog and cat food rose 30.6%. The consumer price of pet food and treats rose 22.3% over the same years.
Source: BLS producer price index PCU311111311111, dog and cat food manufacturing, December to December. Our calculation.
Show the numbers
| Label | % |
|---|---|
| 2014 | 1.4% |
| 2015 | 1.0% |
| 2016 | 1.7% |
| 2017 | -0.6% |
| 2018 | 3.2% |
| 2019 | 3.2% |
| 2020 | 0.3% |
| 2021 | 6.0% |
| 2022 | 13.7% |
| 2023 | 6.6% |
| 2024 | 0.7% |
| 2025 | 0.7% |
Embed this chart
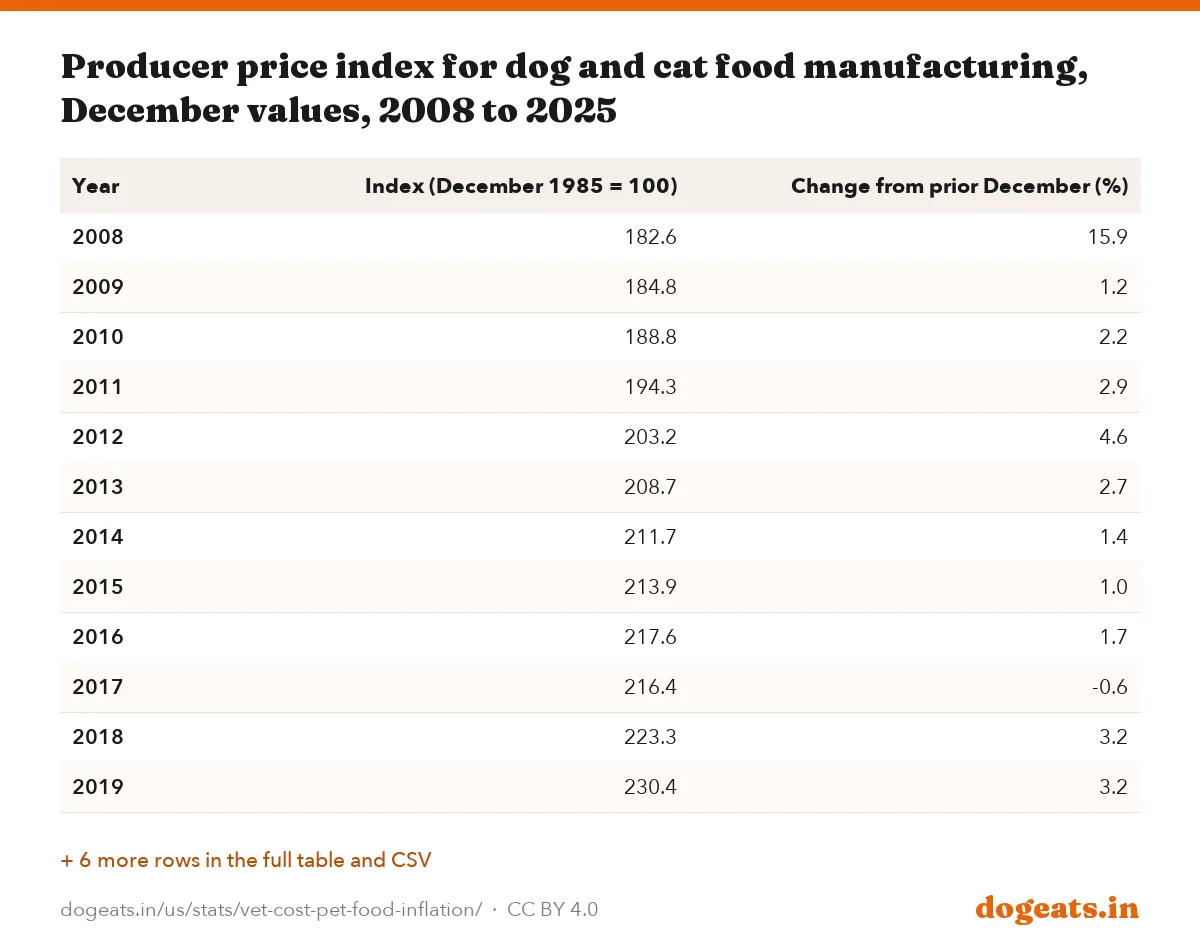
| Year | Index (December 1985 = 100) | Change from prior December (%) |
|---|---|---|
| 2008 | 182.6 | 15.9 |
| 2009 | 184.8 | 1.2 |
| 2010 | 188.8 | 2.2 |
| 2011 | 194.3 | 2.9 |
| 2012 | 203.2 | 4.6 |
| 2013 | 208.7 | 2.7 |
| 2014 | 211.7 | 1.4 |
| 2015 | 213.9 | 1.0 |
| 2016 | 217.6 | 1.7 |
| 2017 | 216.4 | -0.6 |
| 2018 | 223.3 | 3.2 |
| 2019 | 230.4 | 3.2 |
| 2020 | 231.1 | 0.3 |
| 2021 | 244.966 | 6.0 |
| 2022 | 278.438 | 13.7 |
| 2023 | 296.774 | 6.6 |
| 2024 | 298.919 | 0.7 |
| 2025 | 300.967 | 0.7 |
The latest producer figure, for August 2026, is 304.254, up 1.1% on a year earlier. BLS marks the last four months as preliminary and subject to revision.
The highest 12-month rise in the producer series since 2008 was 18.1%, in August 2008.
Grooming and boarding prices are rising fast too
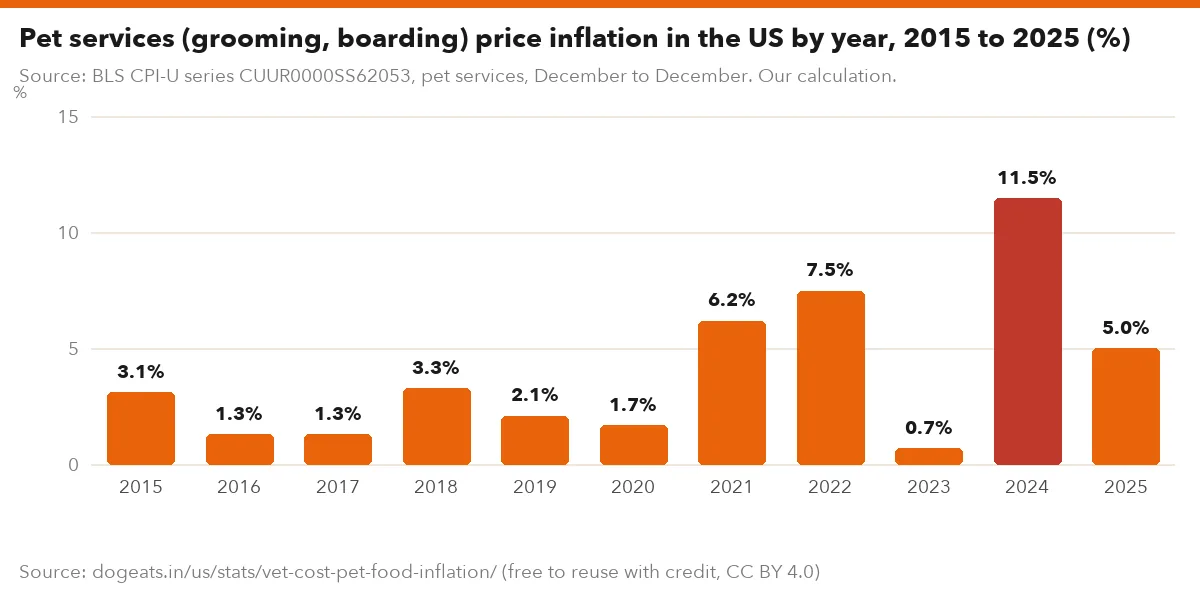
The CPI for pet services covers grooming, boarding, training and similar services, but not vet care. It rose 4.6% in the year to August 2026.
Pet services rose 11.5% in 2024, the series' fastest calendar-year rise since it began in 1998. It rose 5.0% in 2025.
Over 10 years to August 2026, pet services rose 52.1%. Vet services rose 69.3% and all items 39.1%.
Source: BLS CPI-U series CUUR0000SS62053, pet services, December to December. Our calculation.
Show the numbers
| Label | % |
|---|---|
| 2015 | 3.1% |
| 2016 | 1.3% |
| 2017 | 1.3% |
| 2018 | 3.3% |
| 2019 | 2.1% |
| 2020 | 1.7% |
| 2021 | 6.2% |
| 2022 | 7.5% |
| 2023 | 0.7% |
| 2024 | 11.5% |
| 2025 | 5.0% |
Embed this chart
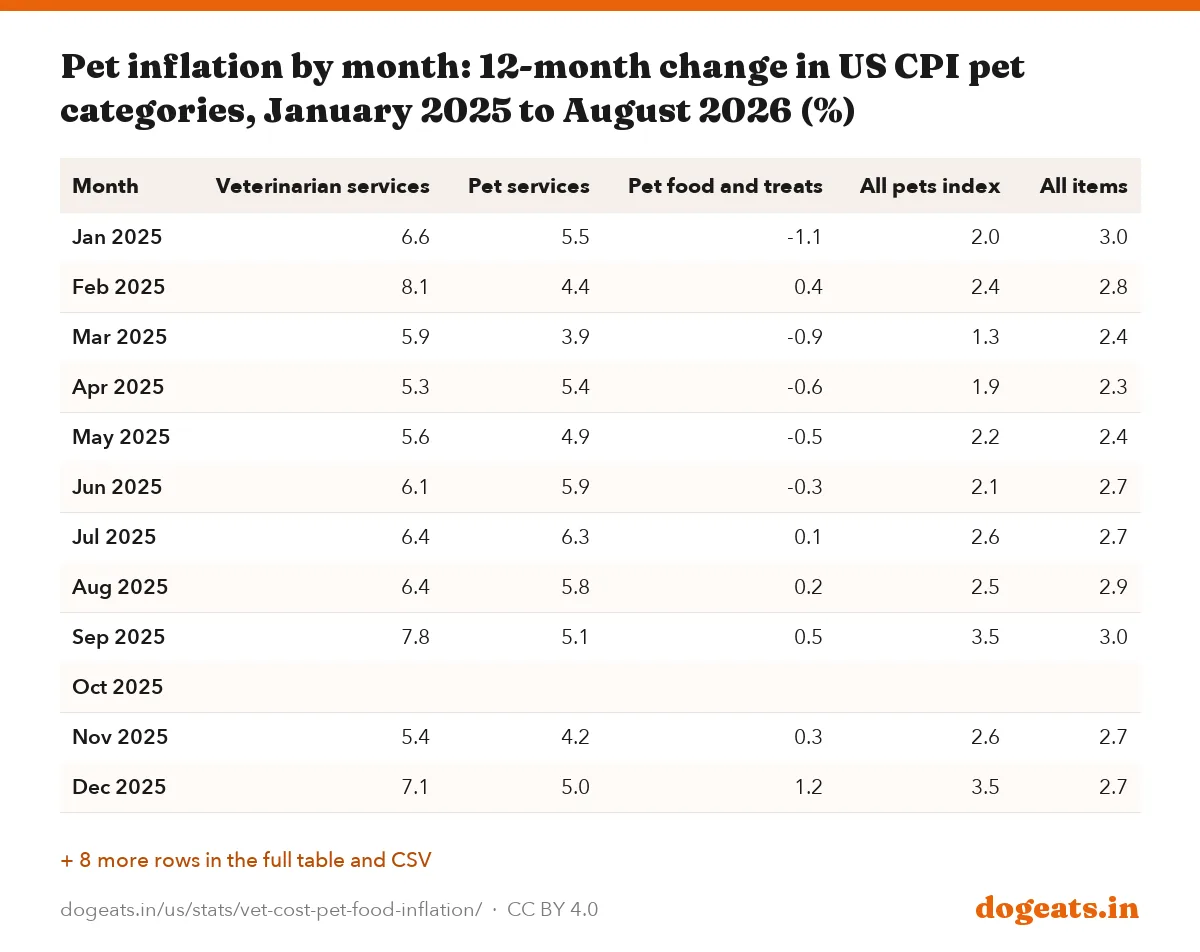
| Month | Veterinarian services | Pet services | Pet food and treats | All pets index | All items |
|---|---|---|---|---|---|
| Jan 2025 | 6.6 | 5.5 | -1.1 | 2.0 | 3.0 |
| Feb 2025 | 8.1 | 4.4 | 0.4 | 2.4 | 2.8 |
| Mar 2025 | 5.9 | 3.9 | -0.9 | 1.3 | 2.4 |
| Apr 2025 | 5.3 | 5.4 | -0.6 | 1.9 | 2.3 |
| May 2025 | 5.6 | 4.9 | -0.5 | 2.2 | 2.4 |
| Jun 2025 | 6.1 | 5.9 | -0.3 | 2.1 | 2.7 |
| Jul 2025 | 6.4 | 6.3 | 0.1 | 2.6 | 2.7 |
| Aug 2025 | 6.4 | 5.8 | 0.2 | 2.5 | 2.9 |
| Sep 2025 | 7.8 | 5.1 | 0.5 | 3.5 | 3.0 |
| Oct 2025 | |||||
| Nov 2025 | 5.4 | 4.2 | 0.3 | 2.6 | 2.7 |
| Dec 2025 | 7.1 | 5.0 | 1.2 | 3.5 | 2.7 |
| Jan 2026 | 7.4 | 5.7 | 1.4 | 3.4 | 2.4 |
| Feb 2026 | 5.3 | 7.3 | 1.4 | 3.3 | 2.4 |
| Mar 2026 | 5.6 | 7.8 | 2.3 | 4.3 | 3.3 |
| Apr 2026 | 5.5 | 6.6 | 2.2 | 3.8 | 3.8 |
| May 2026 | 4.9 | 7.0 | 1.8 | 3.2 | 4.2 |
| Jun 2026 | 5.1 | 6.3 | 1.3 | 3.2 | 3.5 |
| Jul 2026 | 4.7 | 5.1 | 1.3 | 3.0 | 3.4 |
| Aug 2026 | 5.7 | 4.6 | 1.6 | 3.2 | 3.4 |
BLS did not publish October 2025 index values because of the 2025 lapse in federal appropriations, so the October 2025 row is blank.
What $100 of pet spending then costs now
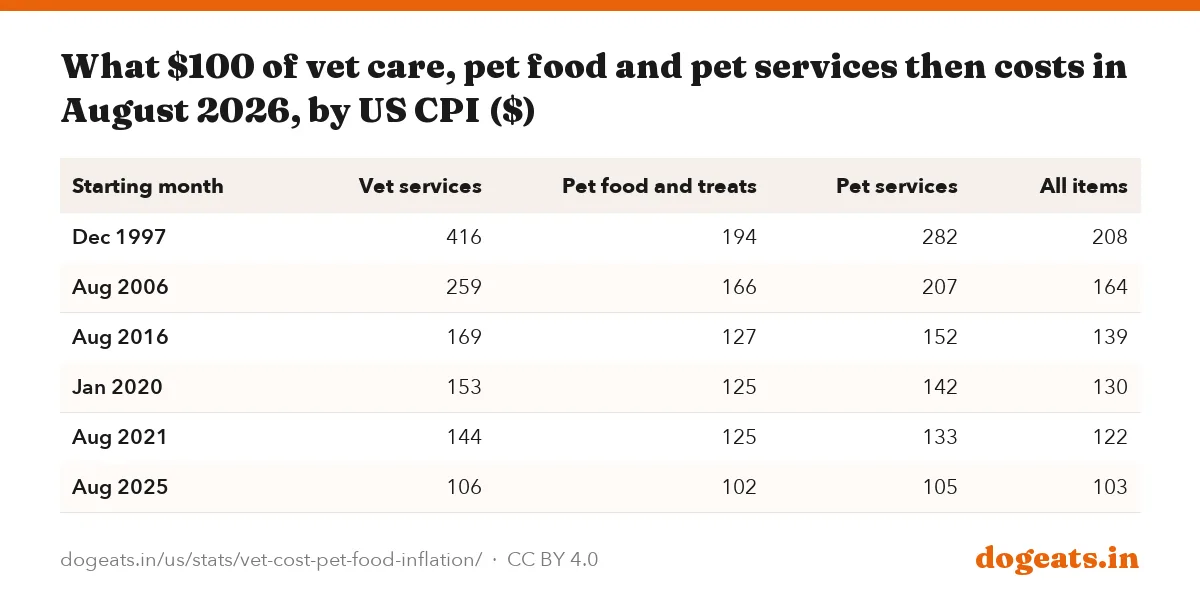
Price indexes translate into dollars. Vet services that cost $100 in August 2016 cost about $169 in August 2026, based on the CPI.
The same $100 of pet food in August 2016 cost about $127. A $100 basket of all consumer goods and services cost about $139.
Back to December 1997, $100 of vet care has become about $416. That is the 4.2-fold rise in the stat card above.
| Starting month | Vet services | Pet food and treats | Pet services | All items |
|---|---|---|---|---|
| Dec 1997 | 416 | 194 | 282 | 208 |
| Aug 2006 | 259 | 166 | 207 | 164 |
| Aug 2016 | 169 | 127 | 152 | 139 |
| Jan 2020 | 153 | 125 | 142 | 130 |
| Aug 2021 | 144 | 125 | 133 | 122 |
| Aug 2025 | 106 | 102 | 105 | 103 |
These are index calculations, not average bills. A clinic that changed its services, or a pet that needs more care with age, can produce very different bills.
For what owners spend in total, see our pet industry spending and pet insurance statistics reports.
How much pets count in the consumer price index
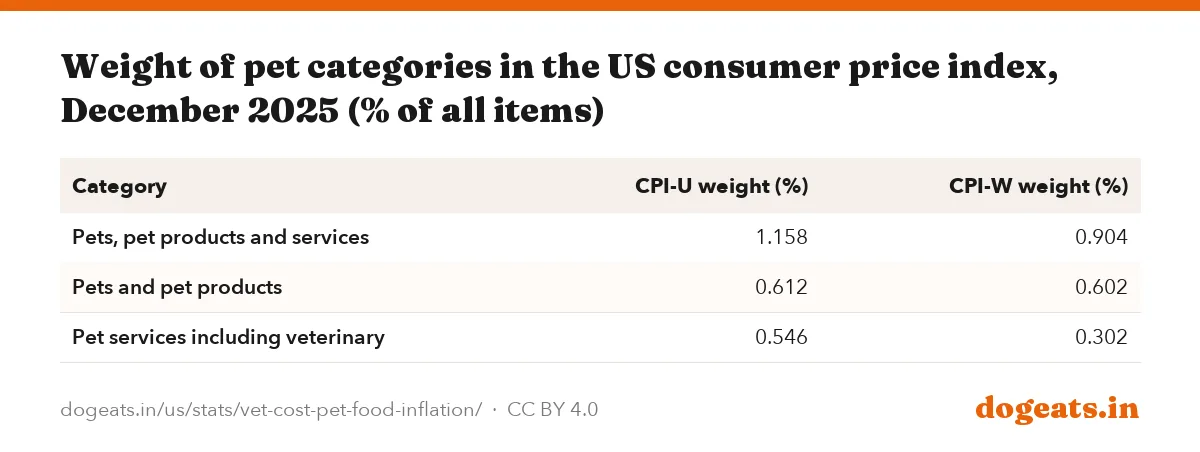
BLS weights each item by its share of consumer spending. In December 2025, pets, pet products and services made up 1.158% of the CPI-U.
Pets and pet products, mostly food and supplies, made up 0.612%. Pet services including vet care made up 0.546%.
Pet services weigh less in the CPI-W, which covers wage earners and clerical workers: 0.302%, against 0.546% in the CPI-U. Households in the CPI-W population spend a smaller share of their budgets on pet services.
| Category | CPI-U weight (%) | CPI-W weight (%) |
|---|---|---|
| Pets, pet products and services | 1.158 | 0.904 |
| Pets and pet products | 0.612 | 0.602 |
| Pet services including veterinary | 0.546 | 0.302 |
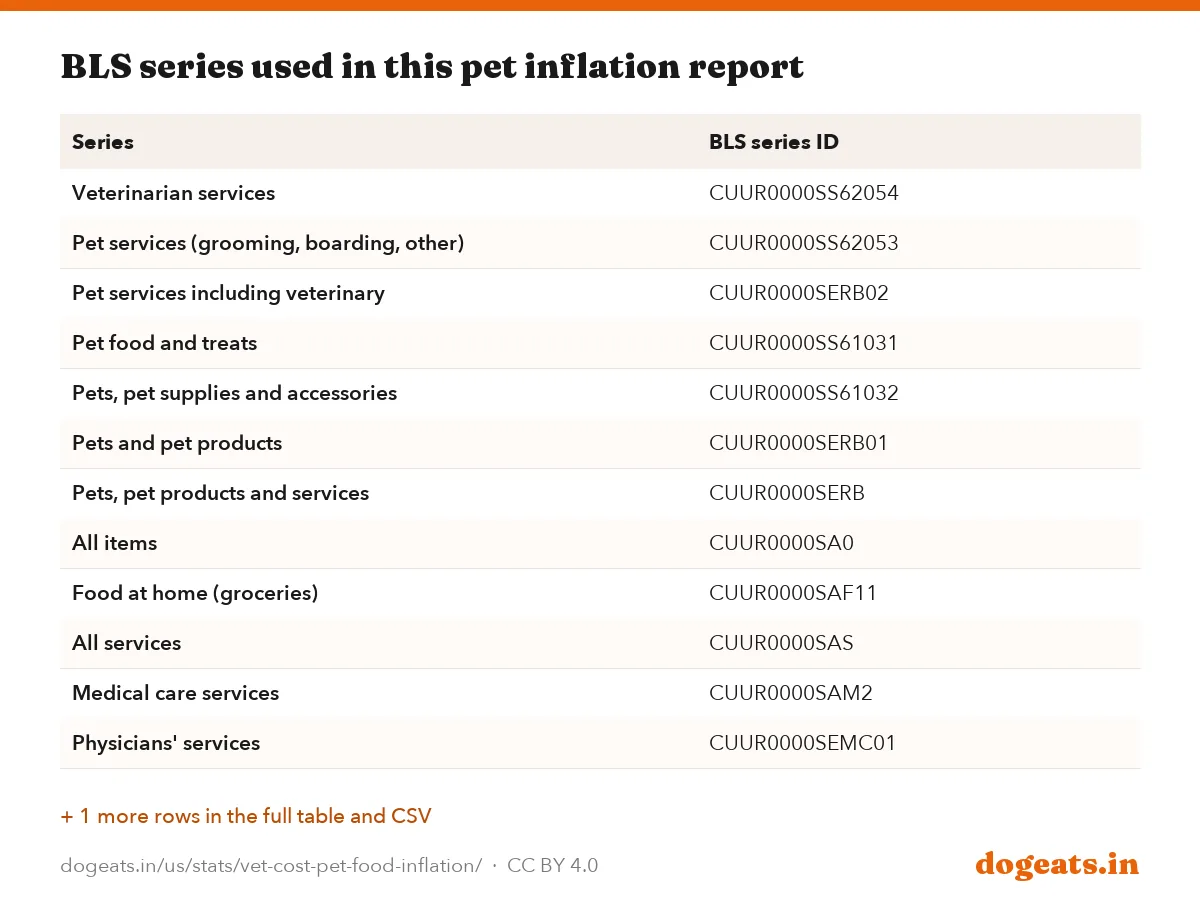
| Series | BLS series ID |
|---|---|
| Veterinarian services | CUUR0000SS62054 |
| Pet services (grooming, boarding, other) | CUUR0000SS62053 |
| Pet services including veterinary | CUUR0000SERB02 |
| Pet food and treats | CUUR0000SS61031 |
| Pets, pet supplies and accessories | CUUR0000SS61032 |
| Pets and pet products | CUUR0000SERB01 |
| Pets, pet products and services | CUUR0000SERB |
| All items | CUUR0000SA0 |
| Food at home (groceries) | CUUR0000SAF11 |
| All services | CUUR0000SAS |
| Medical care services | CUUR0000SAM2 |
| Physicians' services | CUUR0000SEMC01 |
| Dog and cat food manufacturing (producer prices) | PCU311111311111 |
For the workforce behind vet prices, see our report on veterinarians by state.
What the price indexes do not tell you
The CPI measures price change for a fixed set of goods and services. It does not show average vet bills, regional prices or what a specific clinic charges.
BLS publishes these pet series only for the US city average. There are no state or metro pet price indexes, so this report cannot rank states.
Recent months can be revised for seasonally adjusted data, and the producer price index revises its last four months. We used the values available on October 11, 2026.
Frequently asked questions
Why are vet bills going up so much?
BLS price data show vet services rising faster than overall prices almost every year since 1998. Vet prices rose 52.5% from January 2020 to August 2026, against 29.9% for all items. The index shows how much prices rose, not why.
How much have vet prices gone up in the last year?
The CPI for veterinarian services rose 5.7% from August 2025 to August 2026. Overall consumer prices rose 3.4% over the same period.
Are pet food prices going up?
Yes, slowly. Pet food and treats rose 1.6% in the year to August 2026. Prices jumped 15.2% in 2022 and fell 1.7% in 2024.
What is pet inflation right now?
The broad CPI for pets, pet products and services rose 3.2% in the year to August 2026. Within it, vet services rose 5.7%, pet services 4.6% and pet food 1.6%.
How much have vet prices risen in 10 years?
From August 2016 to August 2026, the CPI for veterinarian services rose 69.3%. All consumer prices rose 39.1% over the same decade.
Did vet prices ever rise slower than inflation?
In the BLS data since 1998, only once on a calendar-year basis. In 2021, vet prices rose 4.9% while overall prices rose 7.0%.
How much have grooming and boarding prices gone up?
The CPI for pet services, which covers grooming and boarding but not vet care, rose 4.6% in the year to August 2026. It rose 11.5% in 2024, its fastest year in the series.
Where does this pet inflation data come from?
From the US Bureau of Labor Statistics consumer price index for all urban consumers, US city average. We downloaded the series from the BLS data API and computed every change ourselves.
Methodology and limitations
We downloaded monthly CPI-U index values for 12 series, US city average, from the BLS public data API on October 11, 2026. The latest month available was August 2026.
Percent changes are our calculations from published index levels, which BLS rounds to three decimals. Annual changes are December to December. Twelve-month changes compare the same month a year apart.
Monthly changes for July to August 2026 use seasonally adjusted series. All other figures use series that are not seasonally adjusted.
Producer prices come from the BLS producer price index for dog and cat food manufacturing. CPI weights come from the BLS relative importance table for December 2025.
Sources
- US Bureau of Labor Statistics, CPI-U veterinarian services (CUUR0000SS62054), Vet price index 1997 to August 2026
- US Bureau of Labor Statistics, CPI-U pet food and treats (CUUR0000SS61031), Pet food price index 1997 to August 2026
- US Bureau of Labor Statistics, Relative importance of components in the CPI, December 2025, Weights of pet categories
- Also consulted: BLS, CPI-U pet services (CUUR0000SS62053), BLS, CPI-U pets, pet products and services (CUUR0000SERB), BLS, CPI-U all items (CUUR0000SA0), BLS, Producer price index, dog and cat food manufacturing (PCU311111311111), BLS Public Data API.
Cite, embed and download
This report, its data and its images are free to reuse under a Creative Commons Attribution 4.0 licence. Credit dogeats.in with a link to this page. Every chart has its own embed code, every table has a CSV and an image download, and the images below are ready for social posts, slides and articles.
Cite this report
Link to this report
Every chart and table as an image