Data report · Updated October 2026
US pet industry spending: $158 billion a year, by category, year and household
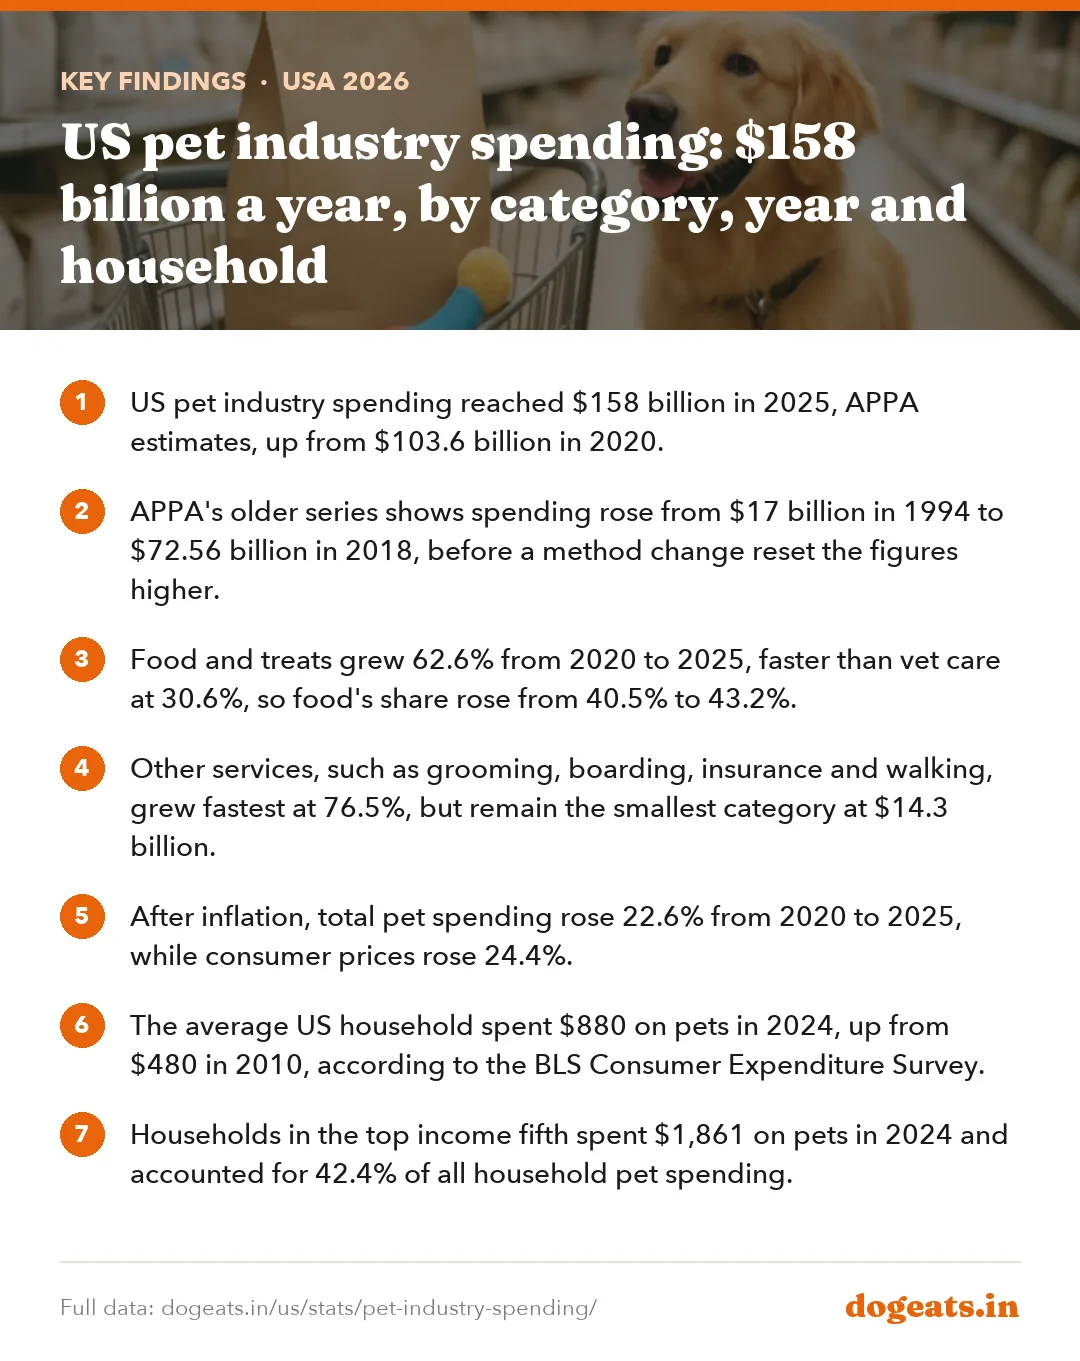
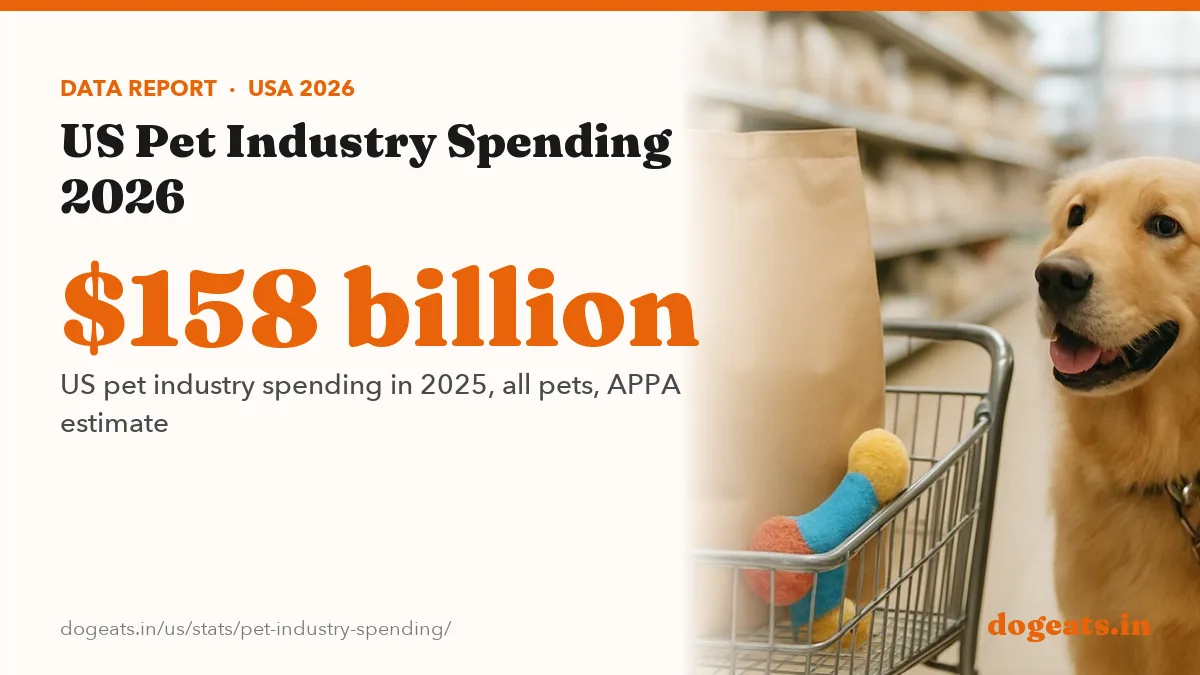
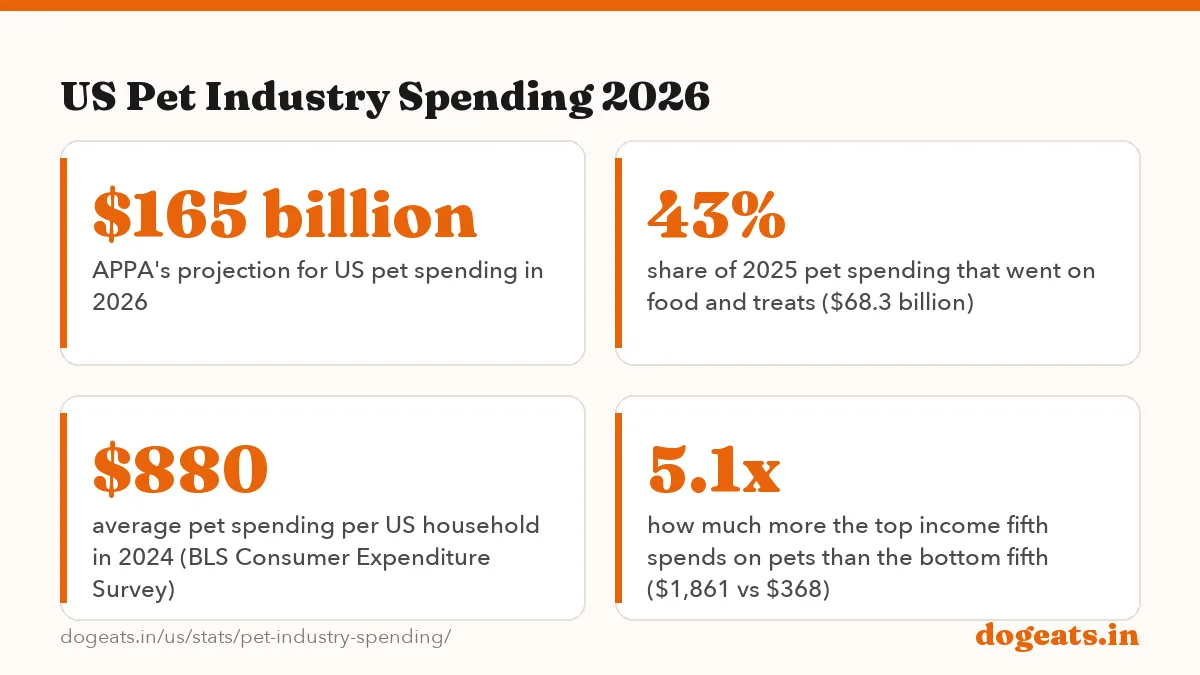
Americans spent $158 billion on their pets in 2025, the American Pet Products Association (APPA) estimates, and it projects $165 billion for 2026. Food and treats took $68.3 billion, or 43% of the total. Government survey data put the average US household's pet spending at $880 in 2024.
Key findings
- US pet industry spending reached $158 billion in 2025, APPA estimates, up from $103.6 billion in 2020.
- APPA's older series shows spending rose from $17 billion in 1994 to $72.56 billion in 2018, before a method change reset the figures higher.
- Food and treats grew 62.6% from 2020 to 2025, faster than vet care at 30.6%, so food's share rose from 40.5% to 43.2%.
- Other services, such as grooming, boarding, insurance and walking, grew fastest at 76.5%, but remain the smallest category at $14.3 billion.
- After inflation, total pet spending rose 22.6% from 2020 to 2025, while consumer prices rose 24.4%.
- The average US household spent $880 on pets in 2024, up from $480 in 2010, according to the BLS Consumer Expenditure Survey.
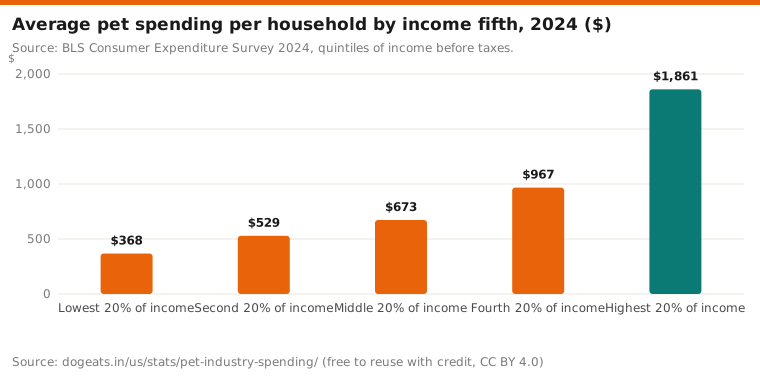
- Households in the top income fifth spent $1,861 on pets in 2024 and accounted for 42.4% of all household pet spending.
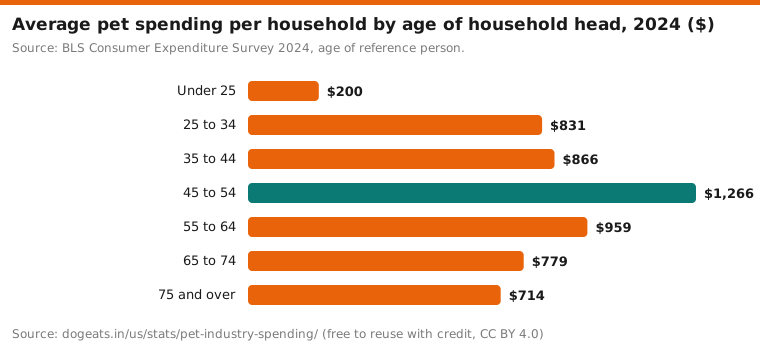
- Households headed by someone aged 45 to 54 spent the most on pets in 2024, $1,266, while those under 25 spent $200.
- Renters spent $386 on pets in 2024, about a third of the $1,147 spent by homeowners.
How much do Americans spend on pets each year?
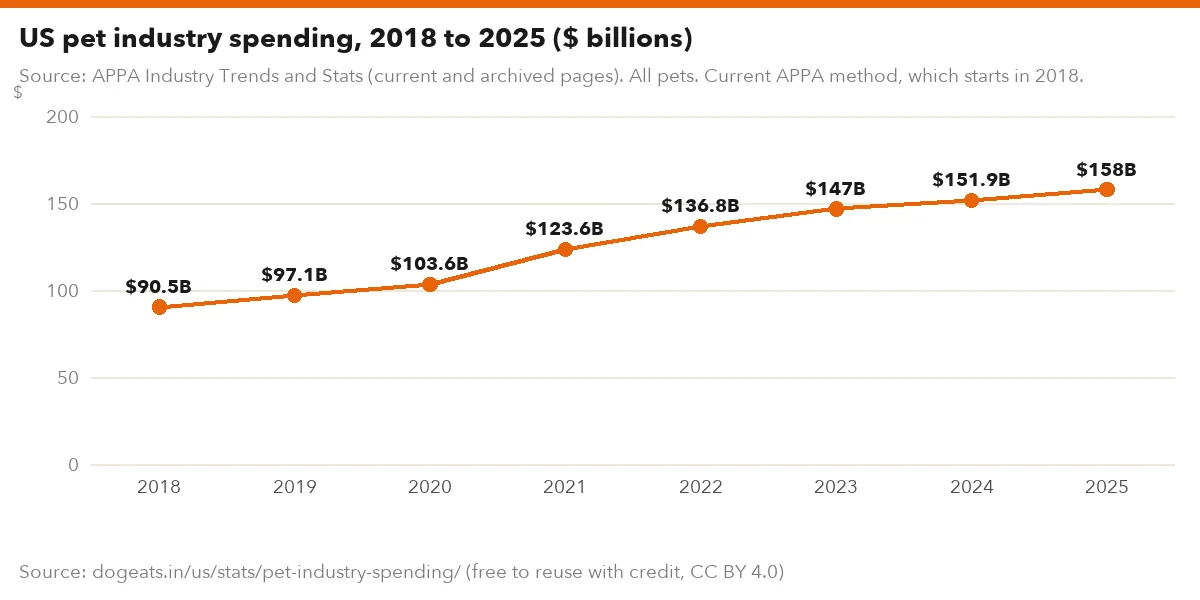
Americans spent $158 billion on pets in 2025, according to the American Pet Products Association (APPA). The trade group projects $165 billion for 2026. These figures cover all pets, including dogs, cats, fish, birds, reptiles and small animals.
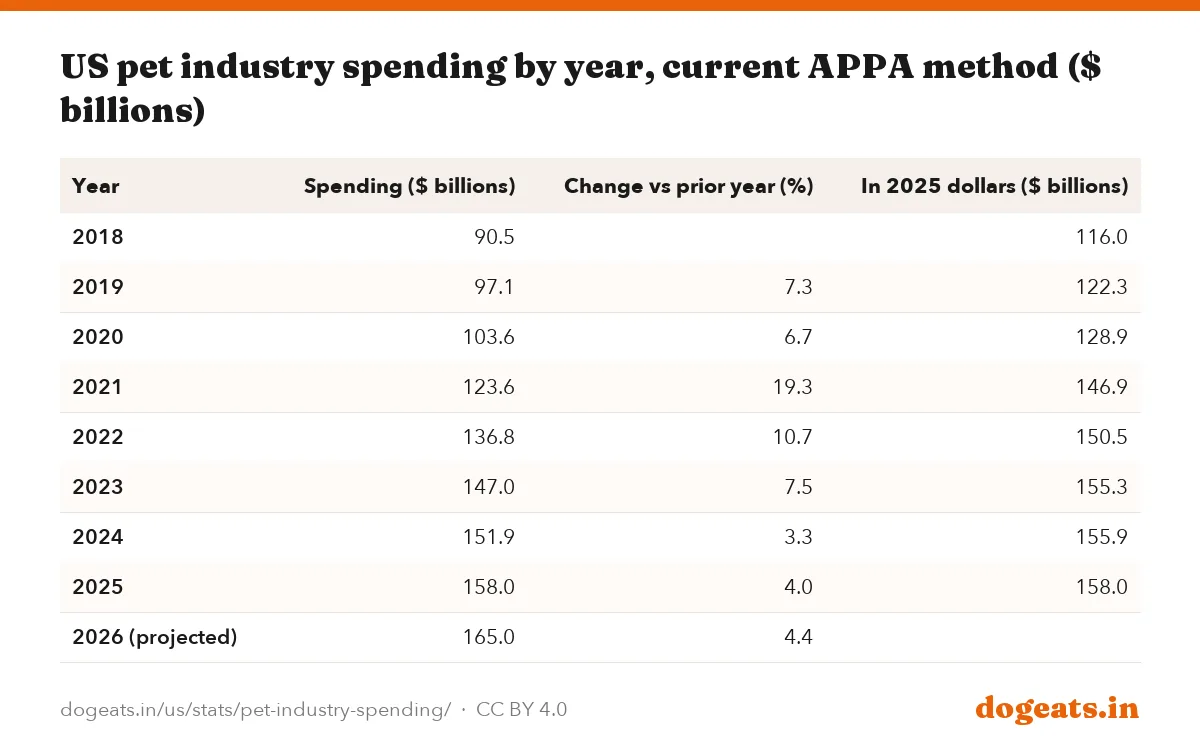
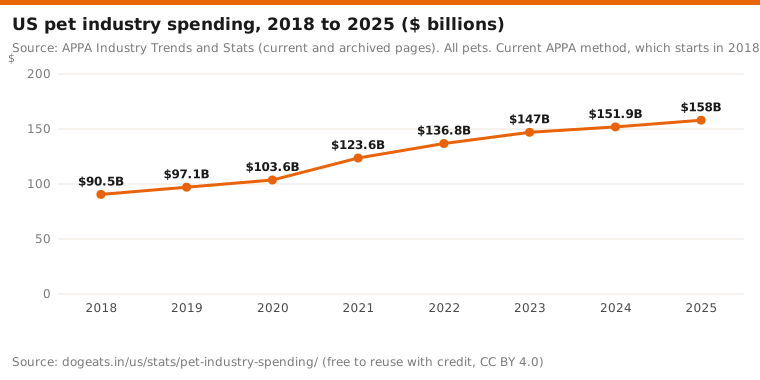
Spending has risen every year in APPA's current series. It went from $90.5 billion in 2018 to $158 billion in 2025, a rise of about 75% in seven years. The biggest jump came in 2021, the first full year of the pandemic, when spending grew 19.3%.
Growth has slowed since then. Spending rose 3.3% in 2024 and about 4% in 2025, based on APPA's rounded totals. APPA itself reports 2025 growth as 3.7%. For 2026 it projects growth of about 4.4%, and says roughly 2 points of that come from inflation.
Source: APPA Industry Trends and Stats (current and archived pages). All pets. Current APPA method, which starts in 2018.
Show the numbers
| Label | $ |
|---|---|
| 2018 | $90.5B |
| 2019 | $97.1B |
| 2020 | $103.6B |
| 2021 | $123.6B |
| 2022 | $136.8B |
| 2023 | $147B |
| 2024 | $151.9B |
| 2025 | $158B |
Embed this chart
| Year | Spending ($ billions) | Change vs prior year (%) | In 2025 dollars ($ billions) |
|---|---|---|---|
| 2018 | 90.5 | 116.0 | |
| 2019 | 97.1 | 7.3 | 122.3 |
| 2020 | 103.6 | 6.7 | 128.9 |
| 2021 | 123.6 | 19.3 | 146.9 |
| 2022 | 136.8 | 10.7 | 150.5 |
| 2023 | 147.0 | 7.5 | 155.3 |
| 2024 | 151.9 | 3.3 | 155.9 |
| 2025 | 158.0 | 4.0 | 158.0 |
| 2026 (projected) | 165.0 | 4.4 |
The 2025 total works out to roughly $1,660 for each of the 95 million US households that APPA says own a pet. The division is ours, not APPA's. It also includes spending that never passes through a household budget, so treat it as a rough scale marker. APPA's survey also counts 71 million dog-owning households in 2025, 53% of US households, up from 51% in 2024.
Pet spending has grown for three decades
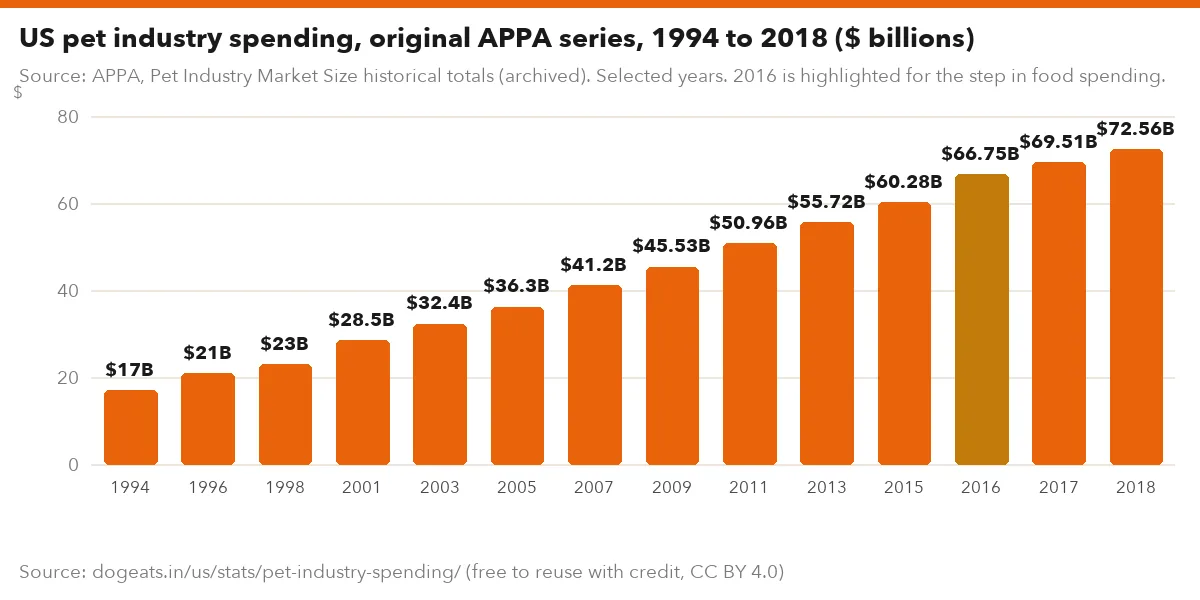
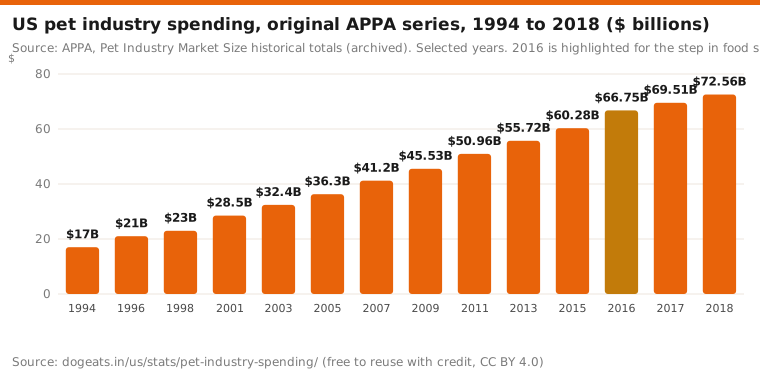
APPA has published a national pet spending figure since 1994, when it put the total at $17 billion. Its original series ran to 2018, when it reached $72.56 billion. Over those 24 years spending grew about 6.2% a year before inflation.
In 2020 APPA changed its method and restated 2018 at $90.5 billion, about 25% higher. The new figures add data from Nielsen, Euromonitor and Packaged Facts, plus channels it had missed before. The two series cannot be joined into one line.
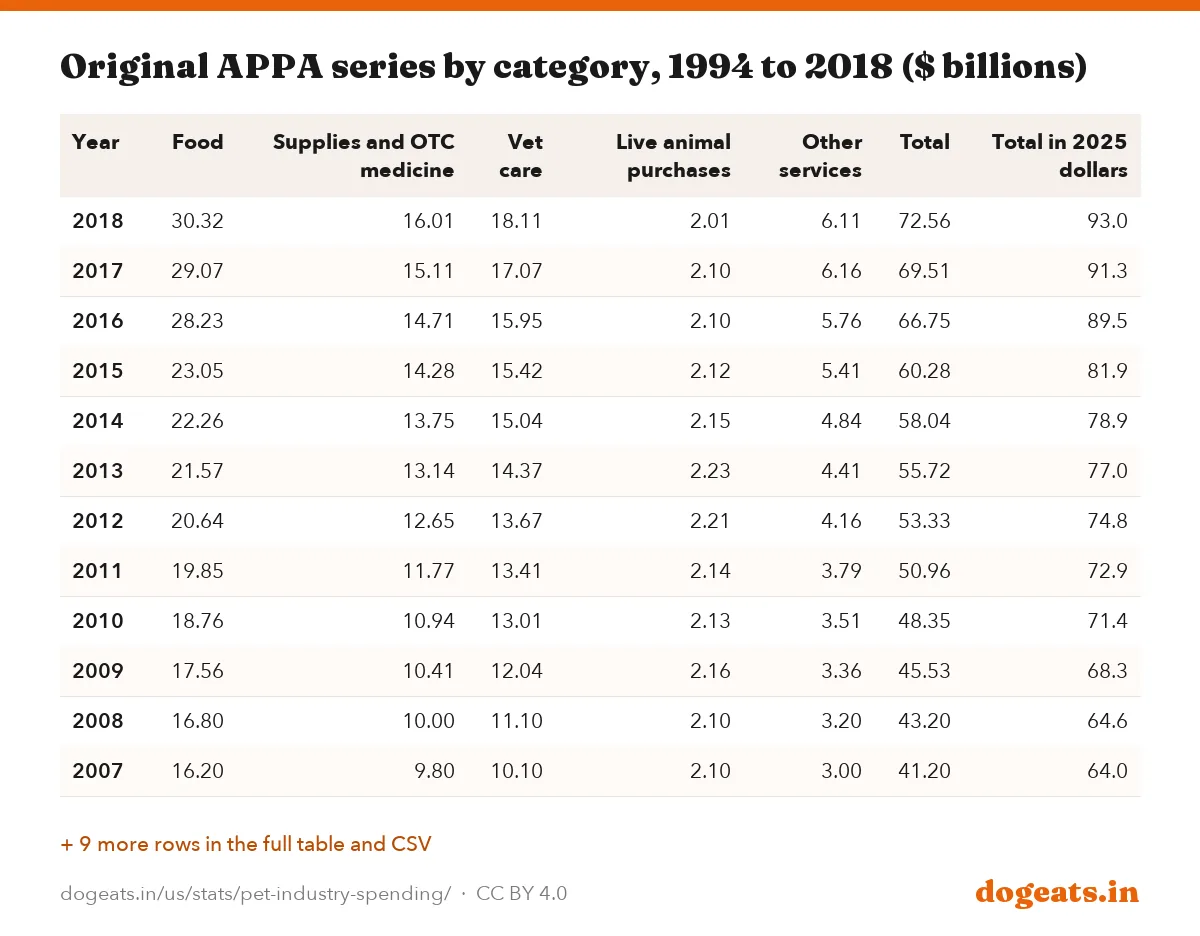
The old series has one odd step. Food spending jumped from $23.05 billion in 2015 to $28.23 billion in 2016, which pushed the total up 10.7% that year. APPA's notes do not explain the jump, so it may reflect a change in sources rather than a real surge.
Source: APPA, Pet Industry Market Size historical totals (archived). Selected years. 2016 is highlighted for the step in food spending.
Show the numbers
| Label | $ |
|---|---|
| 1994 | $17B |
| 1996 | $21B |
| 1998 | $23B |
| 2001 | $28.5B |
| 2003 | $32.4B |
| 2005 | $36.3B |
| 2007 | $41.2B |
| 2009 | $45.53B |
| 2011 | $50.96B |
| 2013 | $55.72B |
| 2015 | $60.28B |
| 2016 | $66.75B |
| 2017 | $69.51B |
| 2018 | $72.56B |
Embed this chart
| Year | Food | Supplies and OTC medicine | Vet care | Live animal purchases | Other services | Total | Total in 2025 dollars |
|---|---|---|---|---|---|---|---|
| 2018 | 30.32 | 16.01 | 18.11 | 2.01 | 6.11 | 72.56 | 93.0 |
| 2017 | 29.07 | 15.11 | 17.07 | 2.10 | 6.16 | 69.51 | 91.3 |
| 2016 | 28.23 | 14.71 | 15.95 | 2.10 | 5.76 | 66.75 | 89.5 |
| 2015 | 23.05 | 14.28 | 15.42 | 2.12 | 5.41 | 60.28 | 81.9 |
| 2014 | 22.26 | 13.75 | 15.04 | 2.15 | 4.84 | 58.04 | 78.9 |
| 2013 | 21.57 | 13.14 | 14.37 | 2.23 | 4.41 | 55.72 | 77.0 |
| 2012 | 20.64 | 12.65 | 13.67 | 2.21 | 4.16 | 53.33 | 74.8 |
| 2011 | 19.85 | 11.77 | 13.41 | 2.14 | 3.79 | 50.96 | 72.9 |
| 2010 | 18.76 | 10.94 | 13.01 | 2.13 | 3.51 | 48.35 | 71.4 |
| 2009 | 17.56 | 10.41 | 12.04 | 2.16 | 3.36 | 45.53 | 68.3 |
| 2008 | 16.80 | 10.00 | 11.10 | 2.10 | 3.20 | 43.20 | 64.6 |
| 2007 | 16.20 | 9.80 | 10.10 | 2.10 | 3.00 | 41.20 | 64.0 |
| 2006 | 15.40 | 9.30 | 9.20 | 1.90 | 2.70 | 38.50 | 61.5 |
| 2005 | 14.70 | 8.70 | 8.70 | 1.70 | 2.50 | 36.30 | 59.8 |
| 2004 | 14.20 | 8.10 | 8.20 | 1.60 | 2.30 | 34.40 | 58.6 |
| 2003 | 13.70 | 7.20 | 7.90 | 1.50 | 2.10 | 32.40 | 56.7 |
| 2002 | 13.10 | 6.50 | 7.20 | 1.30 | 1.50 | 29.60 | 53.0 |
| 2001 | 12.80 | 6.20 | 7.10 | 1.20 | 1.20 | 28.50 | 51.8 |
| 1998 | 23.00 | 45.4 | |||||
| 1996 | 21.00 | 43.1 | |||||
| 1994 | 17.00 | 36.9 |
APPA published only totals for 1994, 1996 and 1998, so those rows have no category split. Adjusted to 2025 dollars, spending in the old series rose from $36.9 billion in 1994 to $93.0 billion in 2018. In real terms, spending grew about 2.5 times.
Food and treats take the largest share
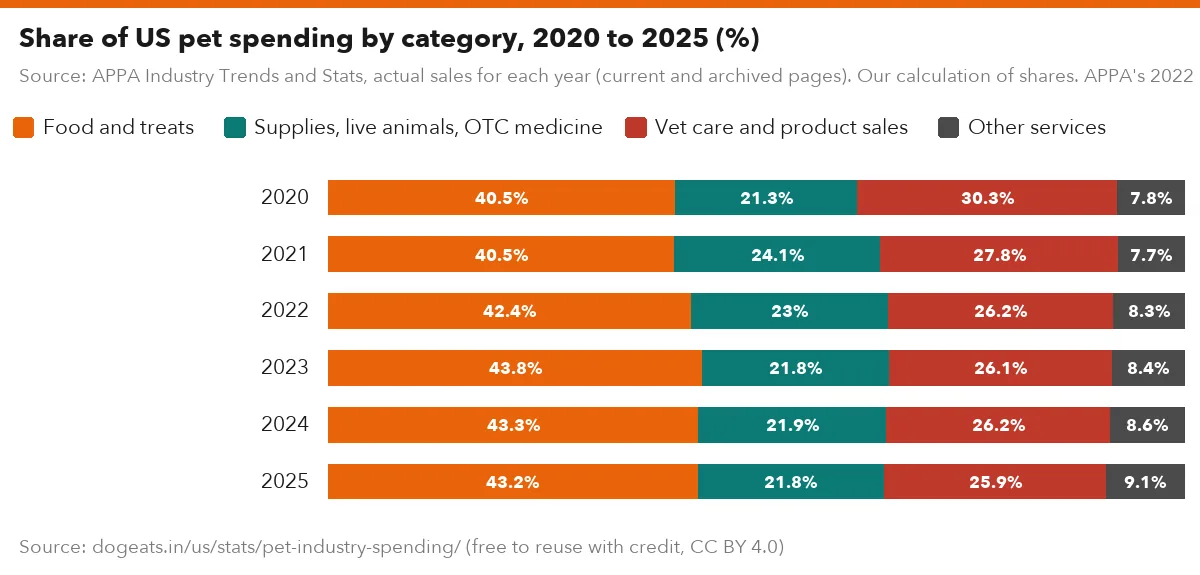
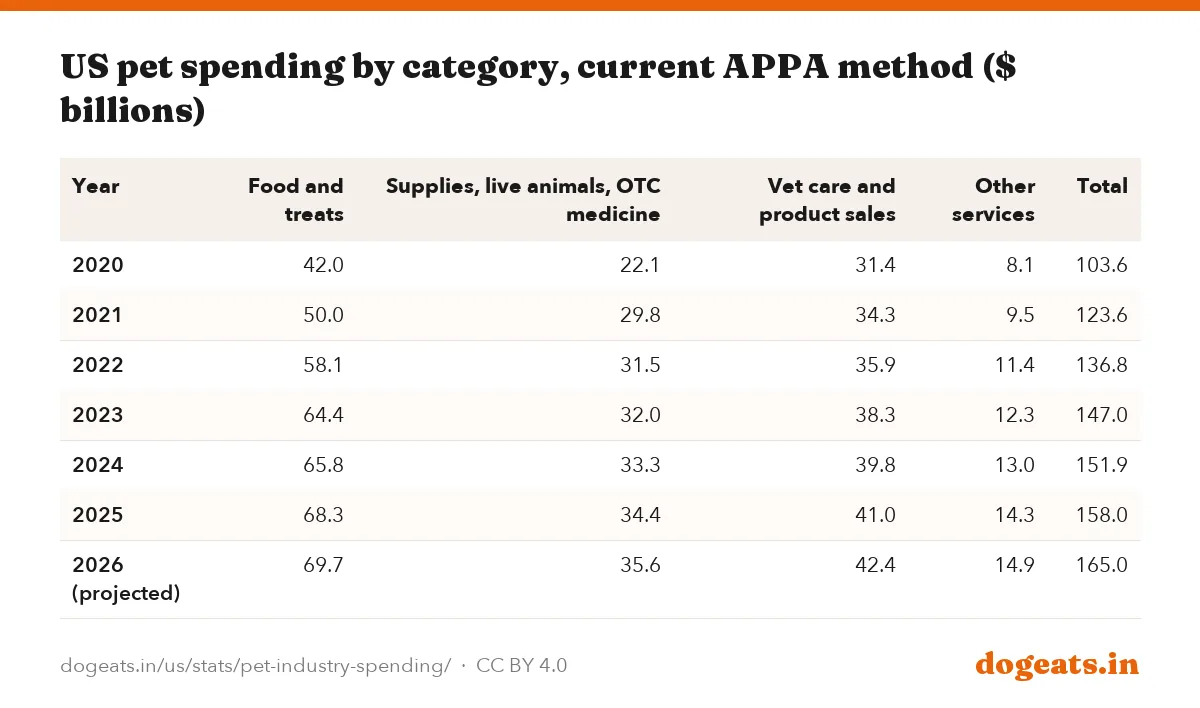
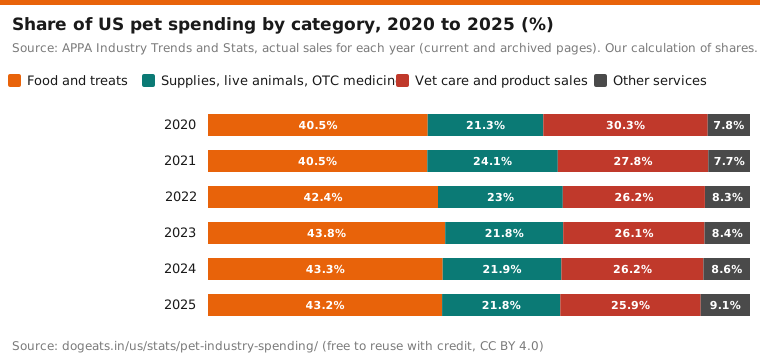
Food and treats are the biggest part of US pet spending. In 2025 they came to $68.3 billion, or 43.2% of the total. Vet care and product sales at vet clinics came next at $41.0 billion, or 25.9%.
Supplies, live animals and over-the-counter medicine took $34.4 billion. Other services, such as grooming, boarding, training, pet sitting, walking and insurance, took $14.3 billion. APPA counts pet insurance in other services under its current method.
Food's share has grown. It was 40.5% in 2020 and has stayed above 43% since 2023. Vet care's share fell from 30.3% to 25.9% over the same years.
| Year | Food and treats | Supplies, live animals, OTC medicine | Vet care and product sales | Other services | Total |
|---|---|---|---|---|---|
| 2020 | 42.0 | 22.1 | 31.4 | 8.1 | 103.6 |
| 2021 | 50.0 | 29.8 | 34.3 | 9.5 | 123.6 |
| 2022 | 58.1 | 31.5 | 35.9 | 11.4 | 136.8 |
| 2023 | 64.4 | 32.0 | 38.3 | 12.3 | 147.0 |
| 2024 | 65.8 | 33.3 | 39.8 | 13.0 | 151.9 |
| 2025 | 68.3 | 34.4 | 41.0 | 14.3 | 158.0 |
| 2026 (projected) | 69.7 | 35.6 | 42.4 | 14.9 | 165.0 |
One quirk sits in APPA's 2026 projection. Its four category forecasts add up to $162.6 billion, while its headline projection is $165 billion. APPA does not explain the $2.4 billion gap, so we show both as published.
Food and services grew faster than vet care
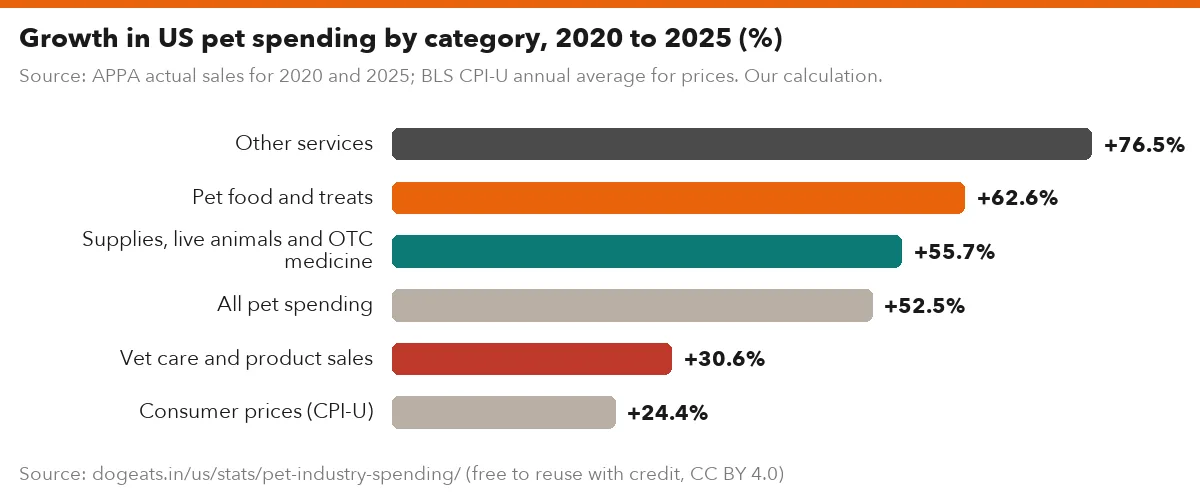
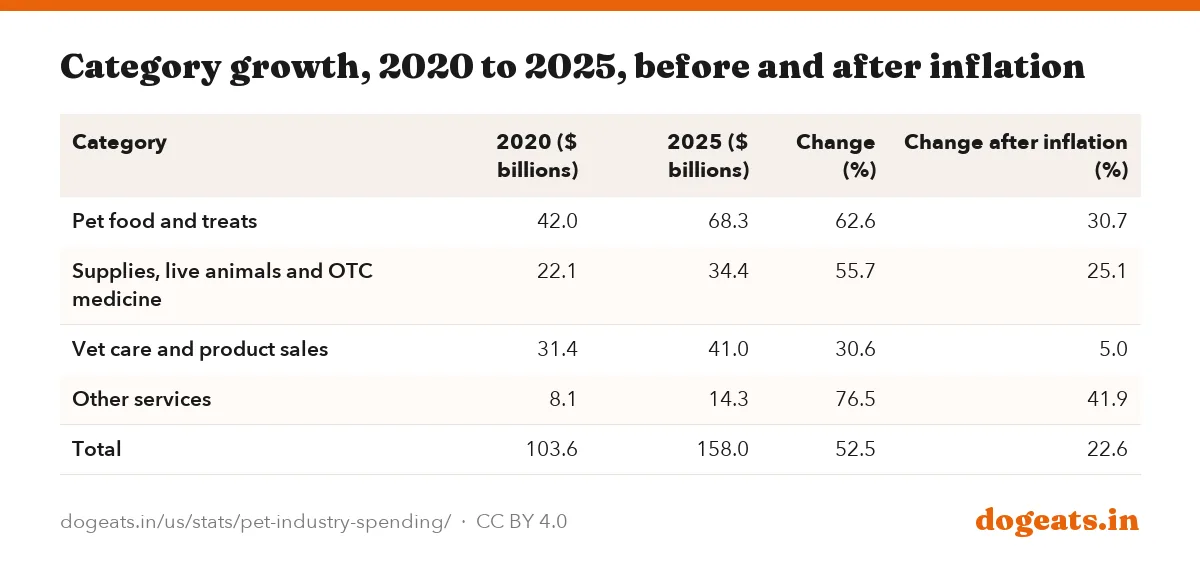
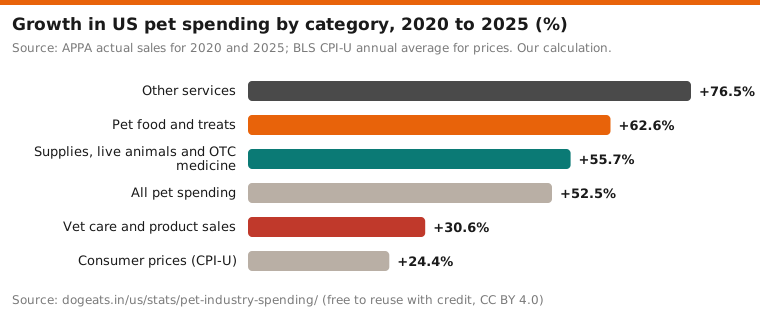
From 2020 to 2025, other services grew 76.5% and food and treats grew 62.6%. Supplies grew 55.7%. Vet care and product sales grew 30.6%, the slowest of the four.
Consumer prices rose 24.4% over the same five years, measured by the CPI-U annual average. So vet care spending barely beat inflation, with real growth of about 5%. Food spending rose about 31% after inflation.
Source: APPA actual sales for 2020 and 2025; BLS CPI-U annual average for prices. Our calculation.
Show the numbers
| Label | % |
|---|---|
| Other services | +76.5% |
| Pet food and treats | +62.6% |
| Supplies, live animals and OTC medicine | +55.7% |
| All pet spending | +52.5% |
| Vet care and product sales | +30.6% |
| Consumer prices (CPI-U) | +24.4% |
Embed this chart
| Category | 2020 ($ billions) | 2025 ($ billions) | Change (%) | Change after inflation (%) |
|---|---|---|---|---|
| Pet food and treats | 42.0 | 68.3 | 62.6 | 30.7 |
| Supplies, live animals and OTC medicine | 22.1 | 34.4 | 55.7 | 25.1 |
| Vet care and product sales | 31.4 | 41.0 | 30.6 | 5.0 |
| Other services | 8.1 | 14.3 | 76.5 | 41.9 |
| Total | 103.6 | 158.0 | 52.5 | 22.6 |
Slow growth in vet spending does not mean vet visits got cheaper. Our cost of owning a dog report tracks vet price inflation, which has outpaced general prices. Owners may be making fewer visits, or more care may be counted in other categories.
Pet insurance is one fast-growing piece of other services. Our pet insurance statistics show how many dogs are covered and what premiums cost.
Services and supplies outgrew food before 2019
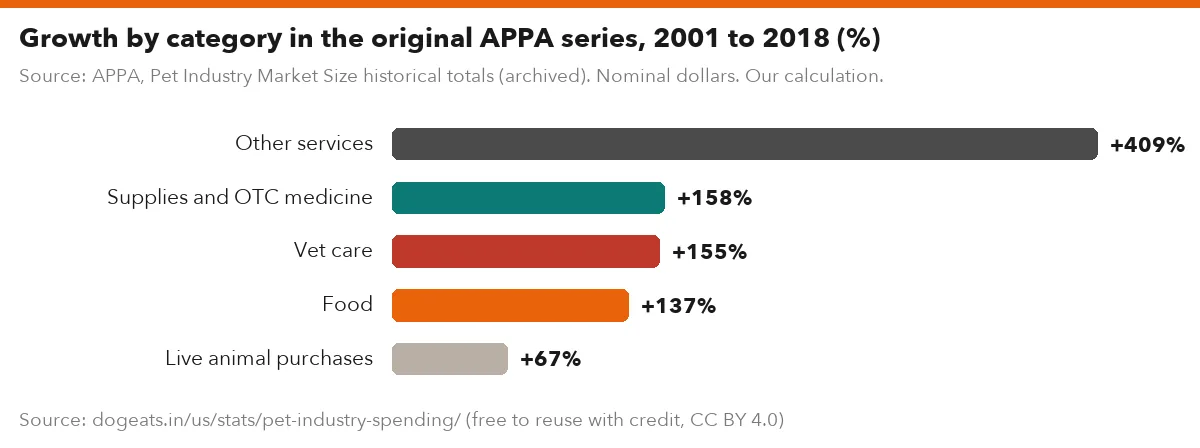
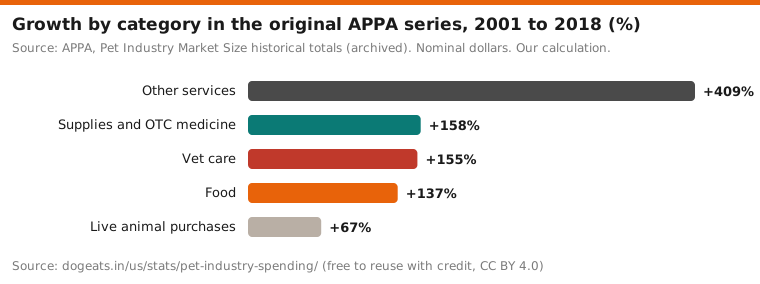
The original APPA series split spending into five categories, including live animal purchases. Between 2001 and 2018, other services grew from $1.2 billion to $6.11 billion. That rise of about 409% was the fastest of any category.
Live animal purchases barely moved, from $1.2 billion to $2.01 billion. Their share of the total fell from 4.2% to 2.8%. Supplies grew 158% and vet care 155%, both ahead of food at 137%.
Source: APPA, Pet Industry Market Size historical totals (archived). Nominal dollars. Our calculation.
Show the numbers
| Label | % |
|---|---|
| Other services | +409% |
| Supplies and OTC medicine | +158% |
| Vet care | +155% |
| Food | +137% |
| Live animal purchases | +67% |
Embed this chart
APPA folded live animals into supplies when it changed method. As a result, live animal purchases have no separate figure after 2019.
APPA's figures change after they are published
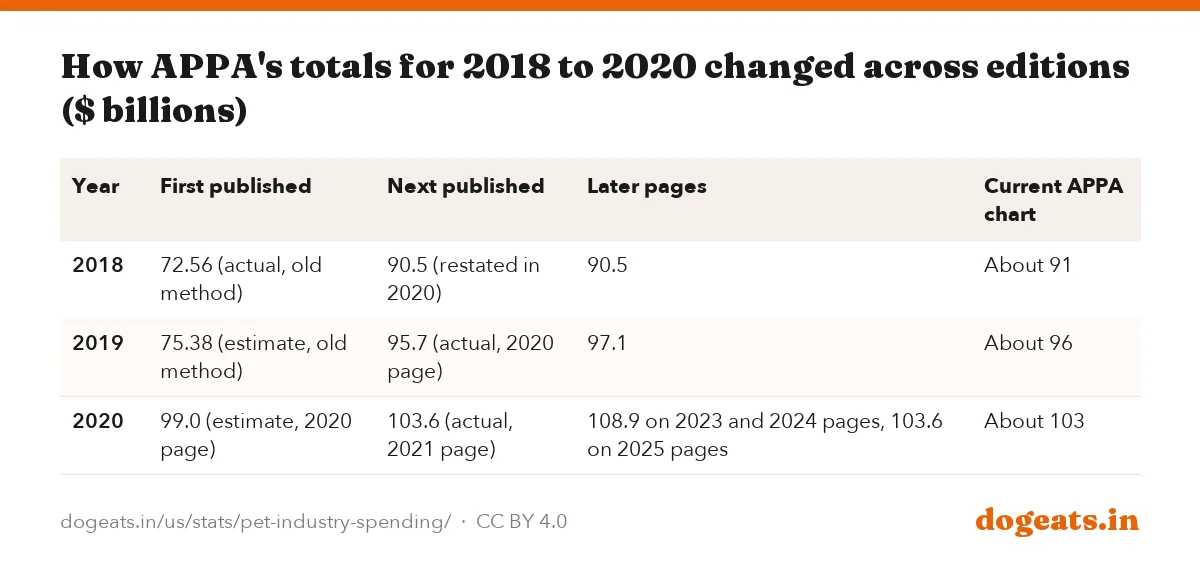
APPA revises past years, sometimes by a lot. Anyone citing a year's figure should say which edition it came from. We checked archived copies of APPA's statistics page from 2019 to 2026.
The 2020 total is the clearest case. APPA first reported $103.6 billion, then showed $108.9 billion on its 2023 and 2024 pages. Its 2025 pages went back to $103.6 billion, and its current chart shows about $103 billion.
| Year | First published | Next published | Later pages | Current APPA chart |
|---|---|---|---|---|
| 2018 | 72.56 (actual, old method) | 90.5 (restated in 2020) | 90.5 | About 91 |
| 2019 | 75.38 (estimate, old method) | 95.7 (actual, 2020 page) | 97.1 | About 96 |
| 2020 | 99.0 (estimate, 2020 page) | 103.6 (actual, 2021 page) | 108.9 on 2023 and 2024 pages, 103.6 on 2025 pages | About 103 |
The average household spent $880 on pets in 2024
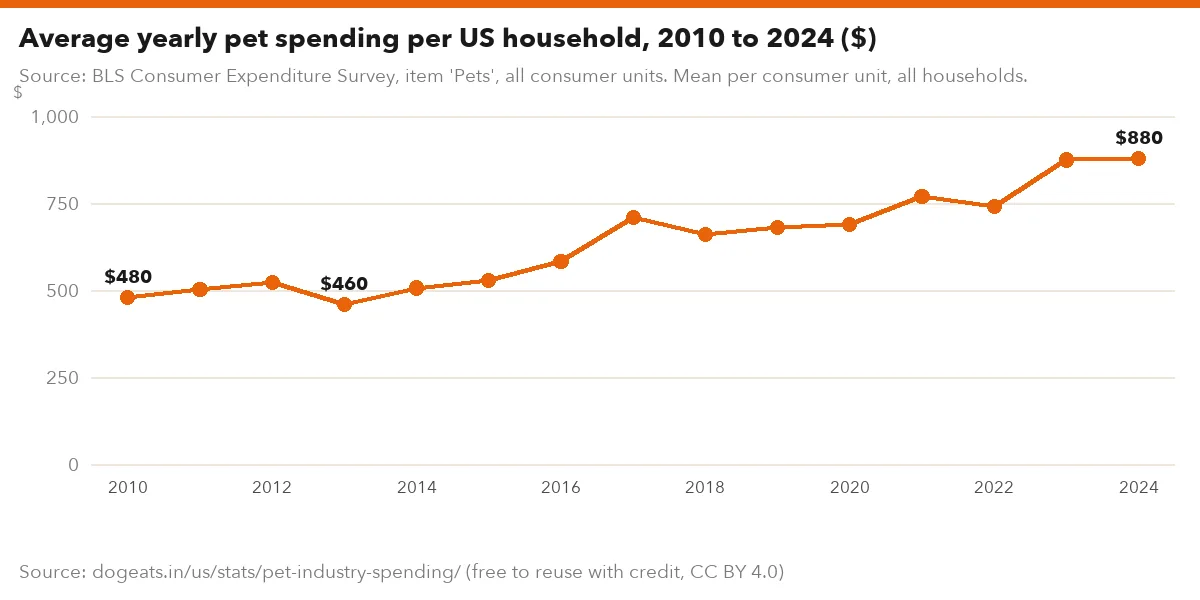
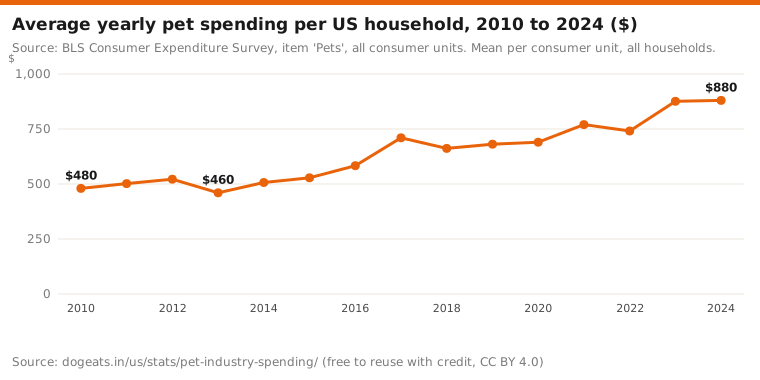
The Bureau of Labor Statistics (BLS) measures pet spending a different way. Its Consumer Expenditure Survey asks households what they spent. In 2024 the average US household spent $880 on pets, 1.12% of its total spending.
That average includes the many households with no pet at all. Spending per pet-owning home is higher. The BLS does not publish a pet-owners-only figure.
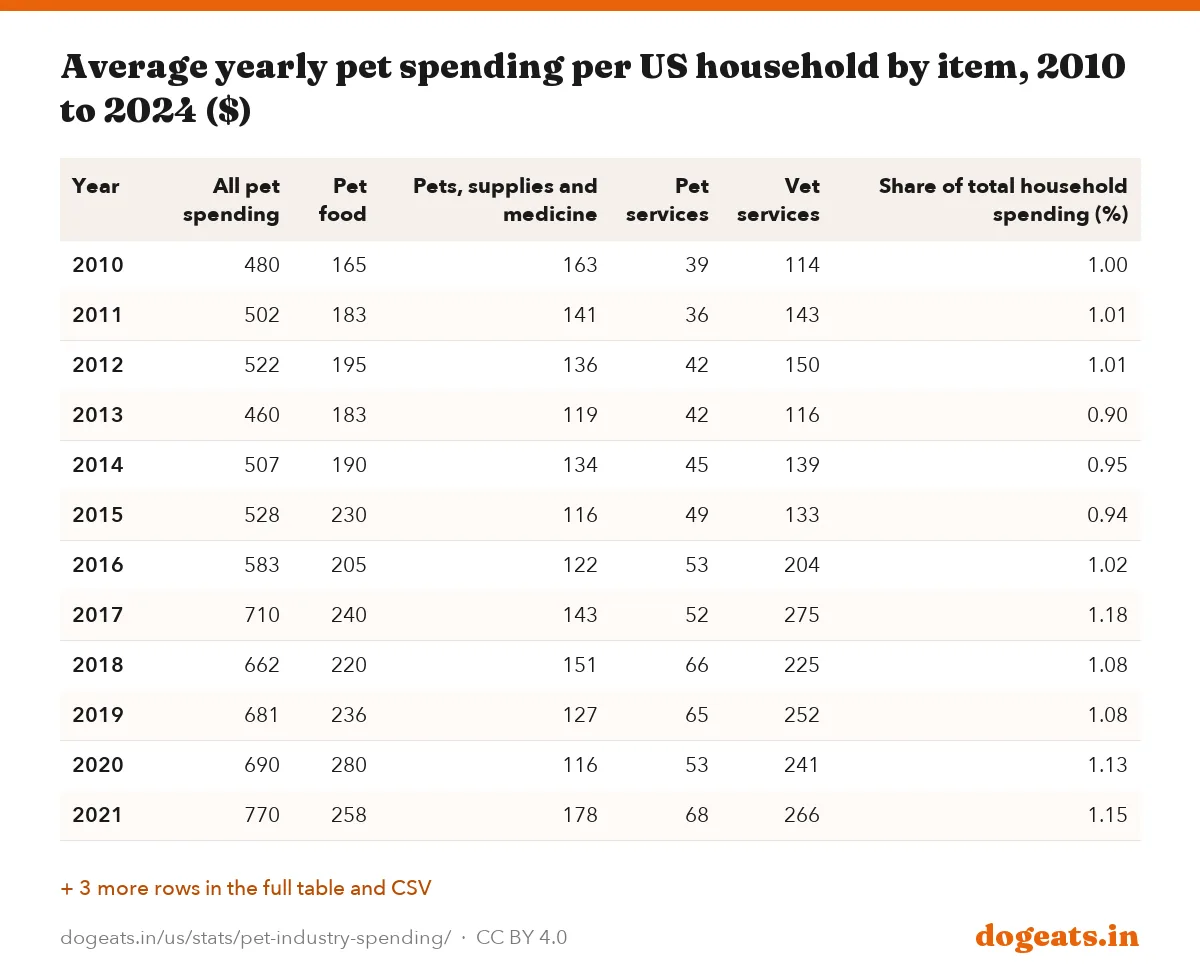
Household pet spending rose from $480 in 2010 to $880 in 2024, up 83%. After inflation the rise was about 27%. Vet services grew most, from $114 to $308.
Source: BLS Consumer Expenditure Survey, item 'Pets', all consumer units. Mean per consumer unit, all households.
Show the numbers
| Label | $ |
|---|---|
| 2010 | $480 |
| 2011 | $502 |
| 2012 | $522 |
| 2013 | $460 |
| 2014 | $507 |
| 2015 | $528 |
| 2016 | $583 |
| 2017 | $710 |
| 2018 | $662 |
| 2019 | $681 |
| 2020 | $690 |
| 2021 | $770 |
| 2022 | $741 |
| 2023 | $876 |
| 2024 | $880 |
Embed this chart
| Year | All pet spending | Pet food | Pets, supplies and medicine | Pet services | Vet services | Share of total household spending (%) |
|---|---|---|---|---|---|---|
| 2010 | 480 | 165 | 163 | 39 | 114 | 1.00 |
| 2011 | 502 | 183 | 141 | 36 | 143 | 1.01 |
| 2012 | 522 | 195 | 136 | 42 | 150 | 1.01 |
| 2013 | 460 | 183 | 119 | 42 | 116 | 0.90 |
| 2014 | 507 | 190 | 134 | 45 | 139 | 0.95 |
| 2015 | 528 | 230 | 116 | 49 | 133 | 0.94 |
| 2016 | 583 | 205 | 122 | 53 | 204 | 1.02 |
| 2017 | 710 | 240 | 143 | 52 | 275 | 1.18 |
| 2018 | 662 | 220 | 151 | 66 | 225 | 1.08 |
| 2019 | 681 | 236 | 127 | 65 | 252 | 1.08 |
| 2020 | 690 | 280 | 116 | 53 | 241 | 1.13 |
| 2021 | 770 | 258 | 178 | 68 | 266 | 1.15 |
| 2022 | 741 | 289 | 164 | 92 | 196 | 1.02 |
| 2023 | 876 | 338 | 171 | 100 | 266 | 1.13 |
| 2024 | 880 | 296 | 176 | 101 | 308 | 1.12 |
The survey line is bumpy because it is a sample. The BLS puts the 2024 pet estimate's relative standard error at 8.28%. Small year-to-year moves, such as the dip in 2022, may be noise.
Higher-income households spend five times more
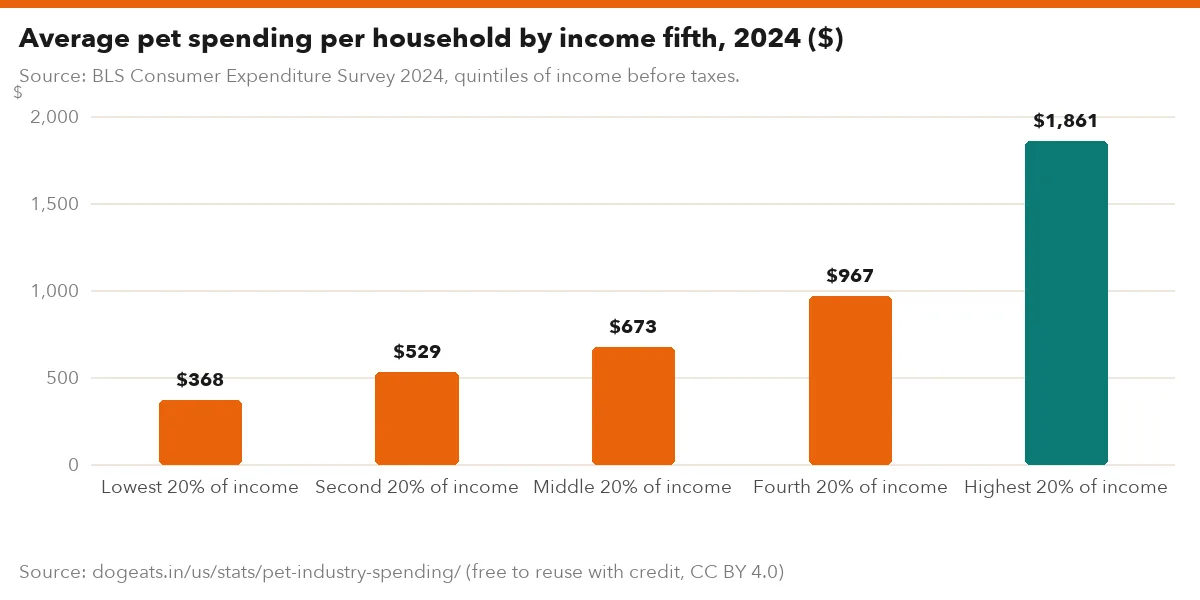
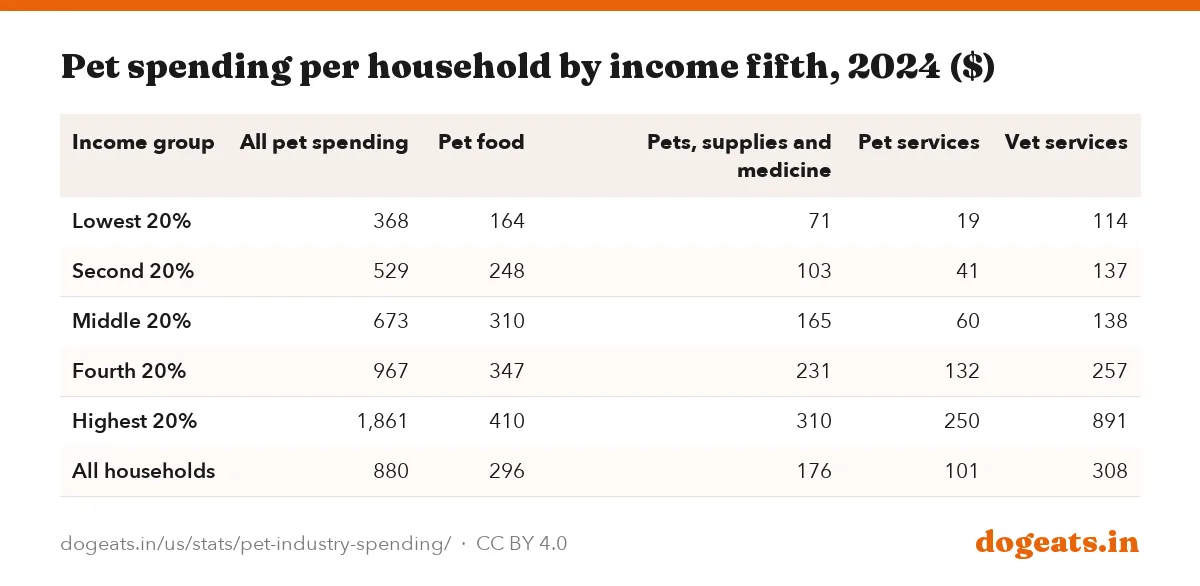
Pet spending climbs steeply with income. Households in the top fifth by income spent $1,861 on pets in 2024. Households in the bottom fifth spent $368.
The gap is widest for vet services. The top fifth spent $891 on vet care, almost eight times the $114 spent by the bottom fifth. Food spending varies far less, from $164 to $410.
The top fifth accounted for 42.4% of all household pet spending in 2024, the BLS estimates. The bottom fifth accounted for 8.4%.
Source: BLS Consumer Expenditure Survey 2024, quintiles of income before taxes.
Show the numbers
| Label | $ |
|---|---|
| Lowest 20% of income | $368 |
| Second 20% of income | $529 |
| Middle 20% of income | $673 |
| Fourth 20% of income | $967 |
| Highest 20% of income | $1,861 |
Embed this chart
| Income group | All pet spending | Pet food | Pets, supplies and medicine | Pet services | Vet services |
|---|---|---|---|---|---|
| Lowest 20% | 368 | 164 | 71 | 19 | 114 |
| Second 20% | 529 | 248 | 103 | 41 | 137 |
| Middle 20% | 673 | 310 | 165 | 60 | 138 |
| Fourth 20% | 967 | 347 | 231 | 132 | 257 |
| Highest 20% | 1,861 | 410 | 310 | 250 | 891 |
| All households | 880 | 296 | 176 | 101 | 308 |
Pet spending peaks in middle age
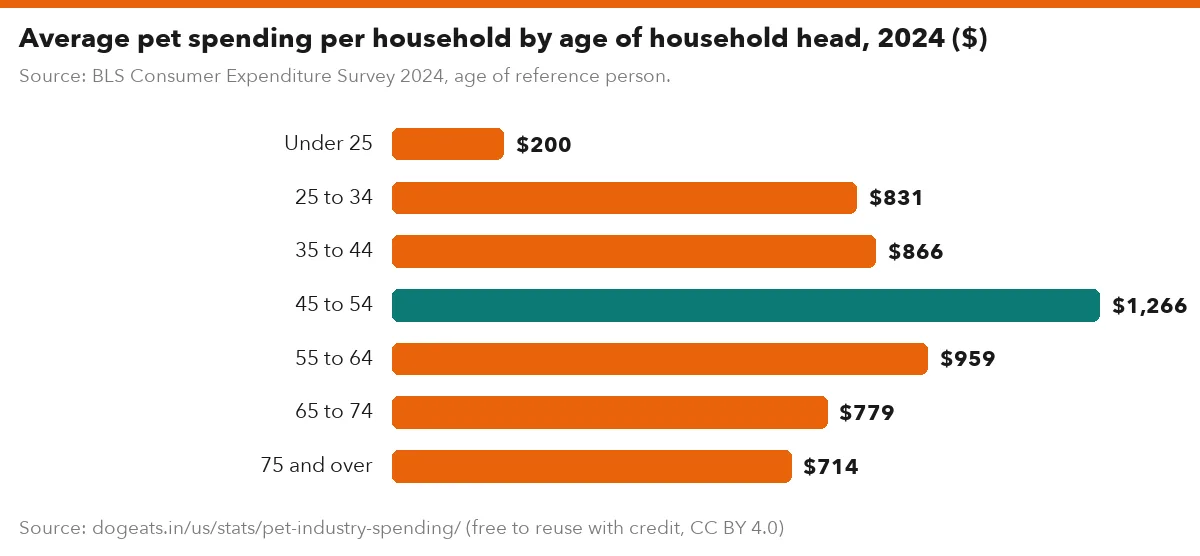
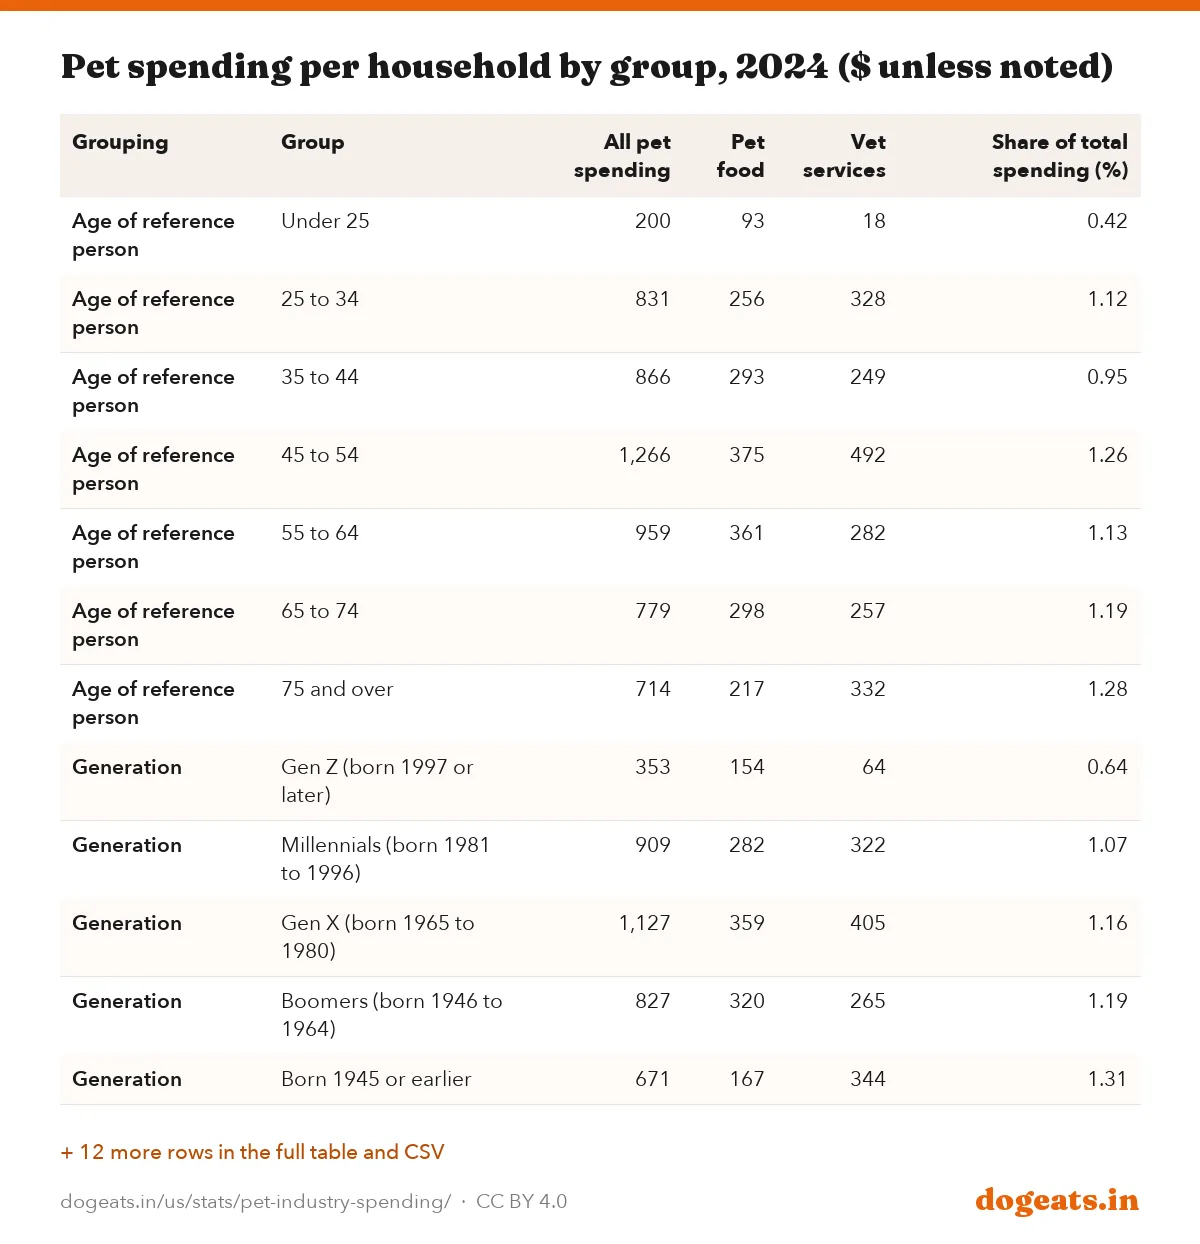
Households headed by someone aged 45 to 54 spent the most on pets in 2024, $1,266 on average. Spending was lowest for households headed by someone under 25, at $200.
Older households spend less in dollars but more as a share of their budget. Households headed by someone 75 or older put 1.28% of spending toward pets, against 0.42% for those under 25.
By generation, Gen X households spent the most at $1,127, and millennials spent $909. Homeowners with a mortgage spent $1,281, while renters spent $386.
Source: BLS Consumer Expenditure Survey 2024, age of reference person.
Show the numbers
| Label | $ |
|---|---|
| Under 25 | $200 |
| 25 to 34 | $831 |
| 35 to 44 | $866 |
| 45 to 54 | $1,266 |
| 55 to 64 | $959 |
| 65 to 74 | $779 |
| 75 and over | $714 |
Embed this chart
| Grouping | Group | All pet spending | Pet food | Vet services | Share of total spending (%) |
|---|---|---|---|---|---|
| Age of reference person | Under 25 | 200 | 93 | 18 | 0.42 |
| Age of reference person | 25 to 34 | 831 | 256 | 328 | 1.12 |
| Age of reference person | 35 to 44 | 866 | 293 | 249 | 0.95 |
| Age of reference person | 45 to 54 | 1,266 | 375 | 492 | 1.26 |
| Age of reference person | 55 to 64 | 959 | 361 | 282 | 1.13 |
| Age of reference person | 65 to 74 | 779 | 298 | 257 | 1.19 |
| Age of reference person | 75 and over | 714 | 217 | 332 | 1.28 |
| Generation | Gen Z (born 1997 or later) | 353 | 154 | 64 | 0.64 |
| Generation | Millennials (born 1981 to 1996) | 909 | 282 | 322 | 1.07 |
| Generation | Gen X (born 1965 to 1980) | 1,127 | 359 | 405 | 1.16 |
| Generation | Boomers (born 1946 to 1964) | 827 | 320 | 265 | 1.19 |
| Generation | Born 1945 or earlier | 671 | 167 | 344 | 1.31 |
| Housing | Homeowner with mortgage | 1,281 | 362 | 497 | 1.23 |
| Housing | Homeowner without mortgage | 953 | 385 | 318 | 1.34 |
| Housing | Renter | 386 | 158 | 83 | 0.68 |
| Region | Northeast | 685 | 261 | 145 | 0.82 |
| Region | Midwest | 837 | 301 | 234 | 1.12 |
| Region | South | 836 | 279 | 320 | 1.19 |
| Region | West | 1,151 | 348 | 482 | 1.24 |
| Household type | One person | 502 | 185 | 155 | 1.03 |
| Household type | Married couple, no children at home | 1,184 | 414 | 434 | 1.34 |
| Household type | Married couple, oldest child under 6 | 608 | 210 | 122 | 0.58 |
| Household type | Married couple, oldest child 6 to 17 | 1,681 | 335 | 913 | 1.43 |
| Household type | Single parent, child under 18 | 356 | 152 | 56 | 0.58 |
Married couples whose oldest child is 6 to 17 spent the most of any household type, $1,681. Much of that was vet services, at $913. Couples with only very young children spent $608.
Region matters too. Households in the West spent $1,151 on pets in 2024, and those in the Northeast spent $685. Our dog ownership statistics show where dogs are most common.
Why the industry and government totals differ
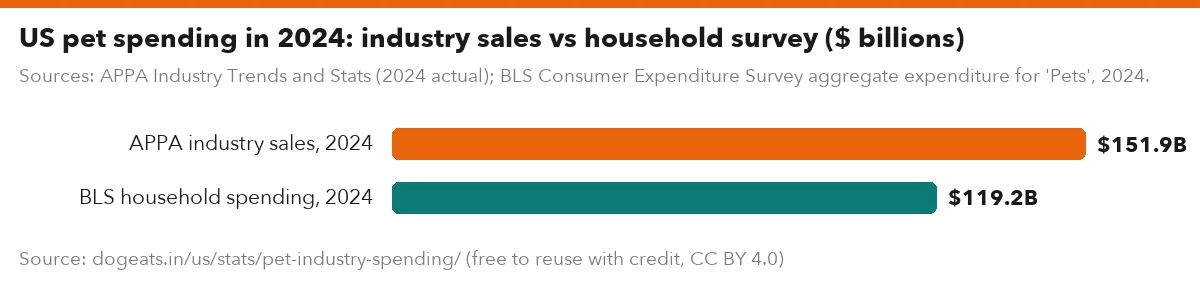
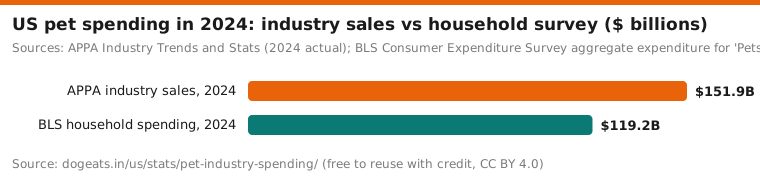
The two sources give different totals for the same year. APPA put 2024 pet spending at $151.9 billion. The BLS survey implies $119.2 billion in household pet spending, about 78% of APPA's figure.
They measure different things. APPA starts from industry sales data from NielsenIQ and Packaged Facts, plus estimates for channels those miss. The BLS asks a sample of households to report their own spending, which depends on what people recall.
Sources: APPA Industry Trends and Stats (2024 actual); BLS Consumer Expenditure Survey aggregate expenditure for 'Pets', 2024.
Show the numbers
| Label | $ |
|---|---|
| APPA industry sales, 2024 | $151.9B |
| BLS household spending, 2024 | $119.2B |
Embed this chart
- APPA counts sales by retailers, vet clinics and service firms, whoever pays. The BLS counts only what households report.
- APPA's vet figure includes products sold through vet clinics, such as prescription diets and drugs.
- Both sources are estimates with their own error. Neither is a complete count of every dollar.
Use APPA for the size of the industry and the BLS for what typical households spend. For what one dog costs its owner, see our cost of owning a dog report. Our US food guides cover what dogs can safely eat.
Frequently asked questions
How much do Americans spend on pets per year?
Americans spent $158 billion on pets in 2025, the American Pet Products Association estimates. That covers food, supplies, vet care and services for all pets. APPA projects $165 billion for 2026.
What do Americans spend the most on for their pets?
Food and treats are the largest category. They came to $68.3 billion in 2025, or 43% of all pet spending. Vet care and product sales came second at $41.0 billion.
How much does the average household spend on pets?
The average US household spent $880 on pets in 2024, the BLS Consumer Expenditure Survey shows. That average includes households with no pets. Pet-owning households spend more.
How big was the pet industry in 2020 compared with 2025?
APPA's latest figure for 2020 is $103.6 billion, against $158 billion in 2025. Spending rose 52.5% in five years. After inflation, the rise is about 23%.
How much did Americans spend on pets in the 1990s?
APPA estimated US pet spending at $17 billion in 1994 and $23 billion in 1998. Those figures come from its original series, which ran to 2018. That series is not directly comparable with today's numbers.
Who spends the most on pets in the US?
Higher-income households spend the most. The top fifth by income spent $1,861 on pets in 2024, against $368 for the bottom fifth. By age, households headed by someone aged 45 to 54 spent the most, $1,266.
Is pet spending growing faster than inflation?
Yes, but by less than headlines suggest. From 2020 to 2025 total pet spending rose 52.5% while consumer prices rose 24.4%. Real growth was about 23%, and vet care grew only about 5% after inflation.
Why do APPA and BLS pet spending numbers differ?
APPA estimates total industry sales from retail and market research data. The BLS asks households what they spent. For 2024 the BLS household figure was $119.2 billion, about 78% of APPA's $151.9 billion.
Methodology and limitations
Industry totals come from the American Pet Products Association (APPA), a trade group for pet product makers. We used APPA's current Industry Trends and Stats page and archived copies of its statistics pages from 2019 to 2026, read through the Internet Archive. For each year we used the latest published actual figure.
Figures for 1996 to 2018 come from APPA's historical totals file, PetIndustryMarketSize2019.pdf, archived by the Internet Archive. The 1994 total comes from APPA's archived 2019 statistics page. APPA changed its method in 2020, so we keep the two series apart and do not join them.
Household figures come from the BLS Consumer Expenditure Survey, downloaded from the BLS public data files in October 2026. We used the item 'Pets' and its four parts, mean per consumer unit, for 2010 to 2024. A consumer unit is roughly a household. The 2024 aggregate and income shares are as published by the BLS.
Inflation adjustments use the BLS CPI-U all items annual average, US city average. Shares, growth rates and real values are our calculations from the published figures. Per-pet-household figures are our own division and are marked as such.
Sources
- APPA, Industry Trends and Stats (current page, 2026), 2025 actual sales by category, 2026 projection, current 2018 to 2026 chart
- APPA, Pet Industry Market Size historical totals 1996 to 2019 (archived PDF), Original series by category, 2001 to 2018, totals from 1996
- US Bureau of Labor Statistics, Consumer Expenditure Survey: Pets, all consumer units, Average pet spending per household 2010 to 2024, standard error, 2024 aggregate
- Also consulted: APPA, Pet Industry Market Size and Ownership Statistics (archived 2019), APPA statistics page (archived August 2020), APPA statistics page (archived July 2021), APPA statistics page (archived July 2022), APPA statistics page (archived August 2023), APPA Industry Trends and Stats (archived July 2024), APPA Industry Trends and Stats (archived September 2025), APPA, 2026 State of the Industry release (May 2026), BLS, Consumer Expenditure Survey public data files (cx database), BLS, CPI-U all items, US city average.
Cite, embed and download
This report, its data and its images are free to reuse under a Creative Commons Attribution 4.0 licence. Credit dogeats.in with a link to this page. Every chart has its own embed code, every table has a CSV and an image download, and the images below are ready for social posts, slides and articles.
Cite this report
Link to this report
Every chart and table as an image