Data report · Updated October 2026
Pet insurance in the US: how many dogs are insured, what it costs and how fast it is growing
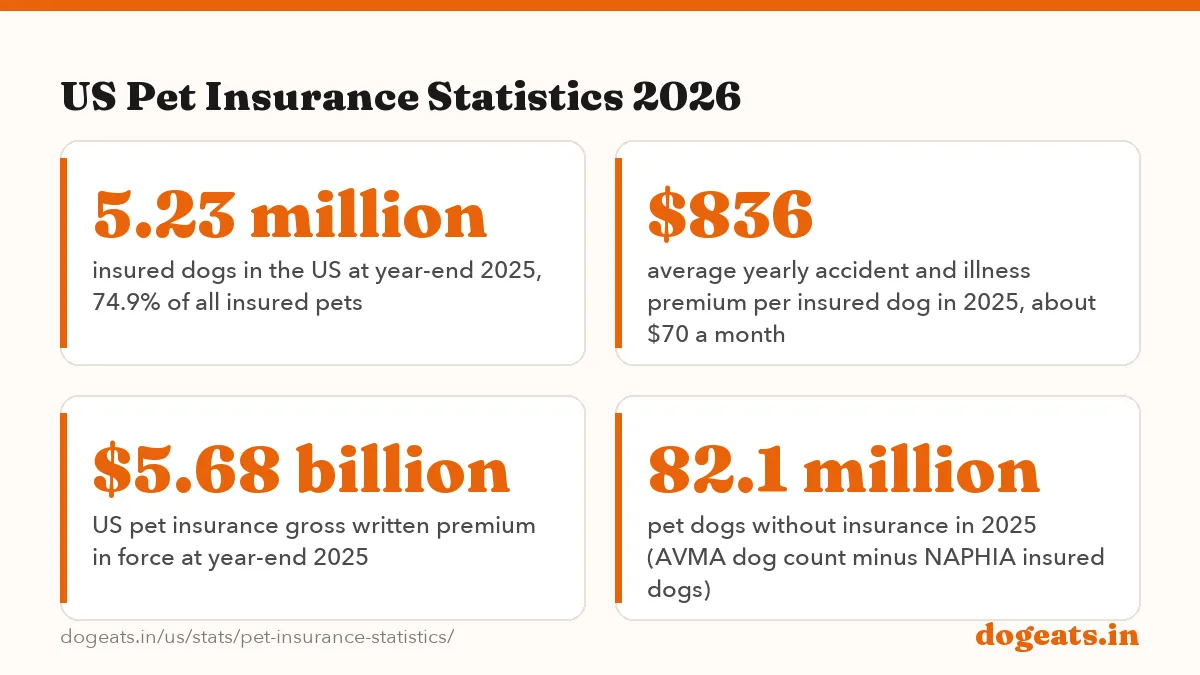
About 5.23 million dogs were insured in the US at the end of 2025, according to NAPHIA, the pet insurance trade group. That covers 5.99% of the country's 87.3 million pet dogs. The average dog accident and illness policy cost $836 a year, up 11.5% in a year.

Key findings
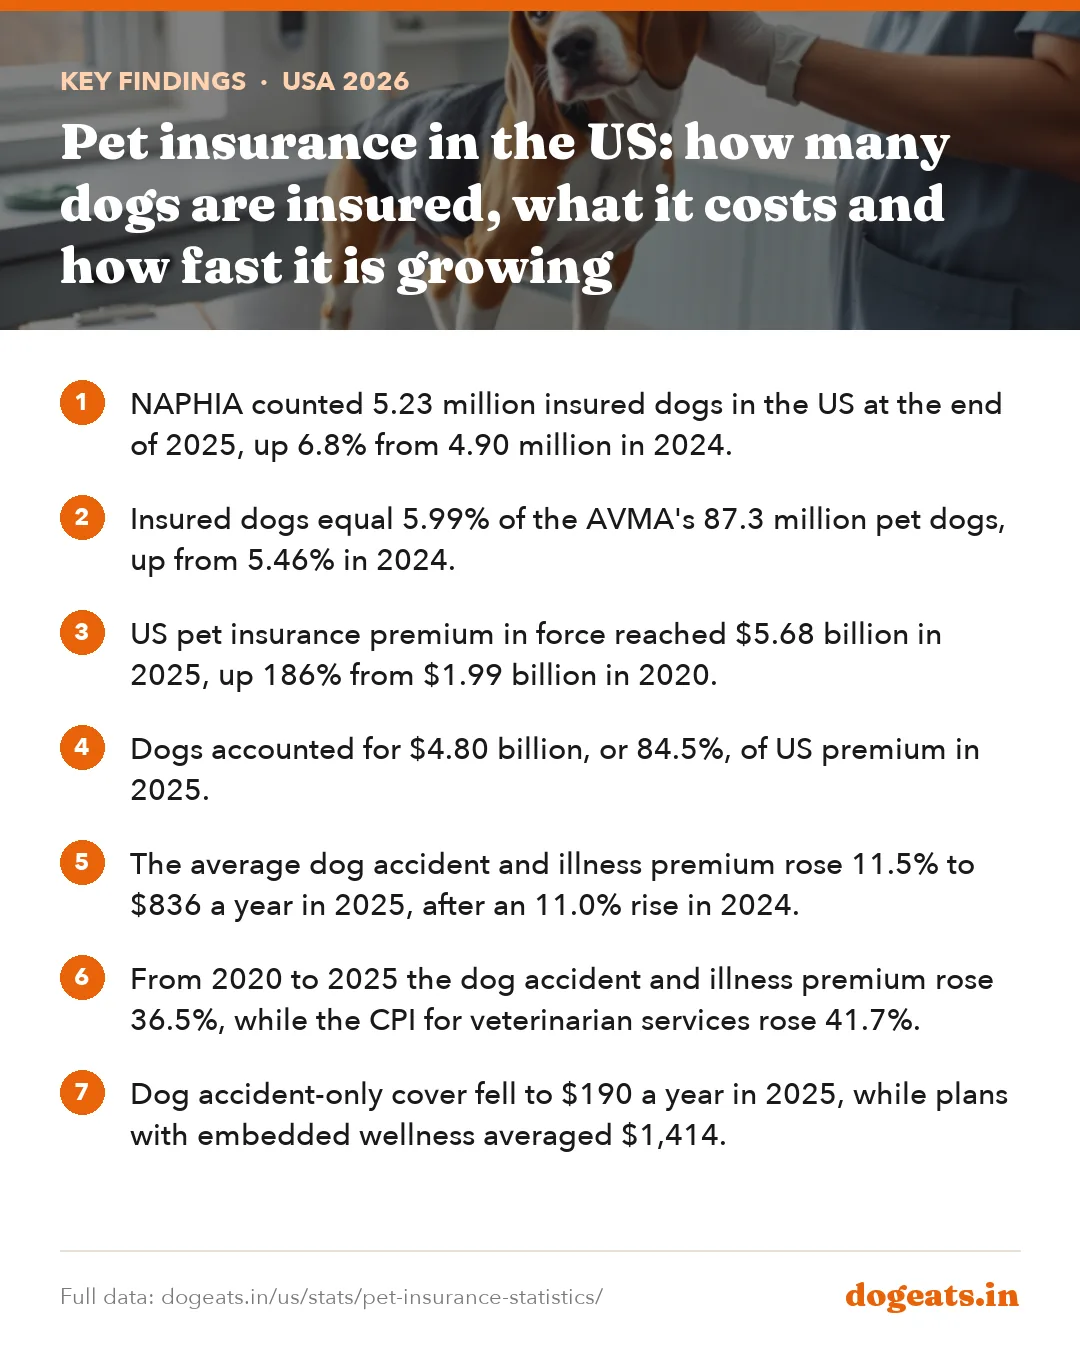
- NAPHIA counted 5.23 million insured dogs in the US at the end of 2025, up 6.8% from 4.90 million in 2024.
- Insured dogs equal 5.99% of the AVMA's 87.3 million pet dogs, up from 5.46% in 2024.
- US pet insurance premium in force reached $5.68 billion in 2025, up 186% from $1.99 billion in 2020.
- Dogs accounted for $4.80 billion, or 84.5%, of US premium in 2025.
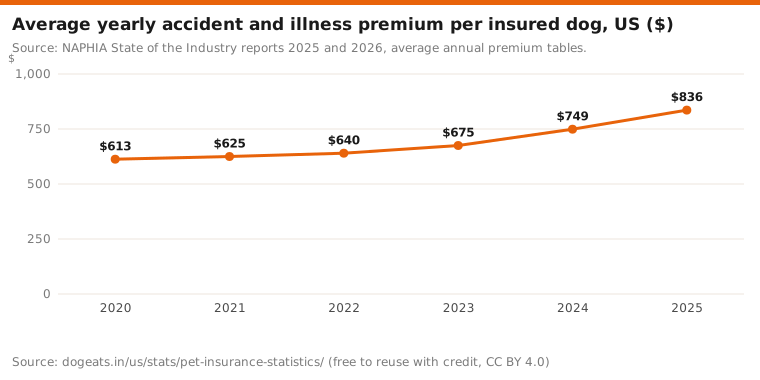
- The average dog accident and illness premium rose 11.5% to $836 a year in 2025, after an 11.0% rise in 2024.
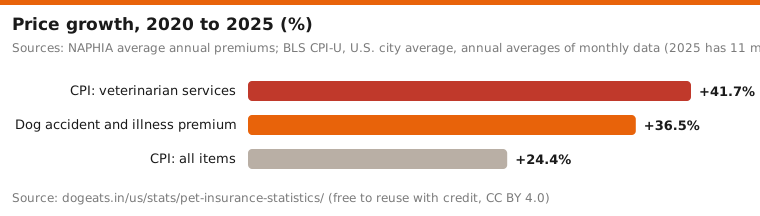
- From 2020 to 2025 the dog accident and illness premium rose 36.5%, while the CPI for veterinarian services rose 41.7%.
- Dog accident-only cover fell to $190 a year in 2025, while plans with embedded wellness averaged $1,414.
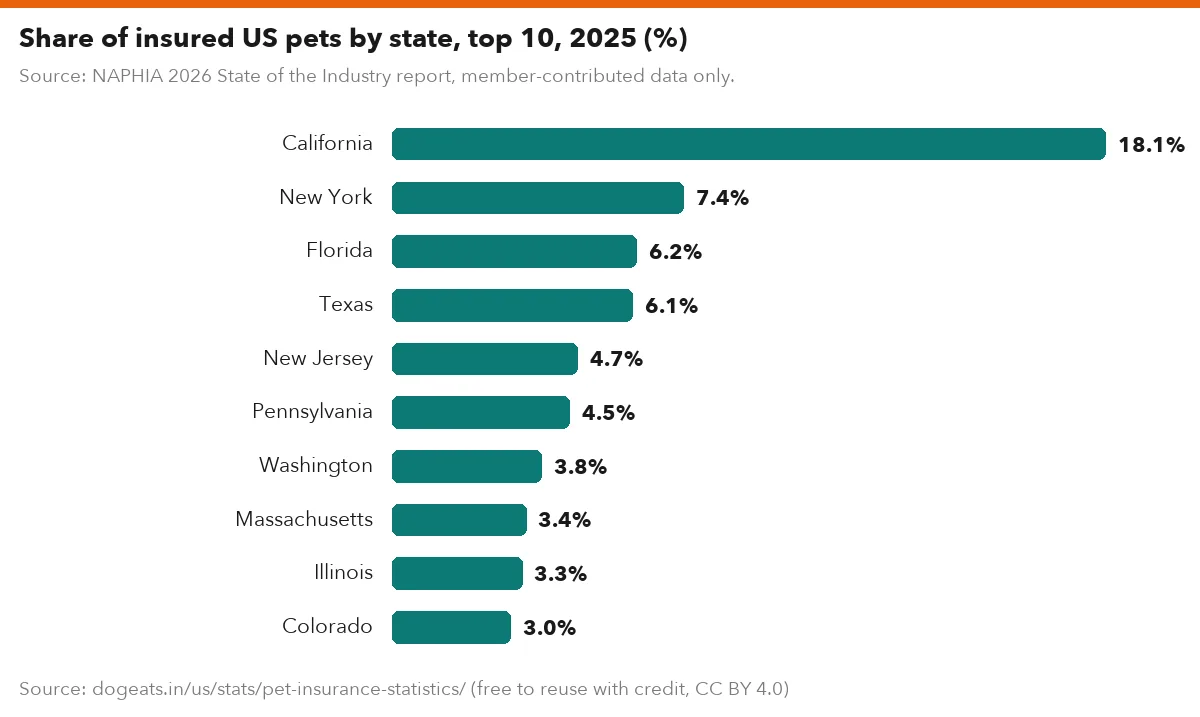
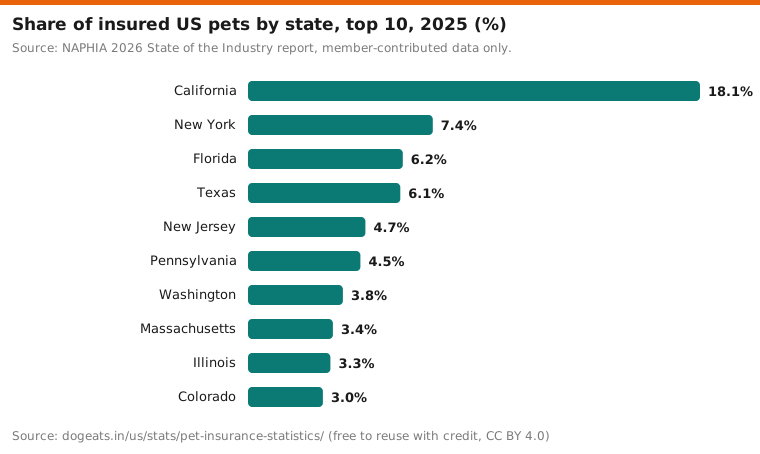
- California, New York, Florida and Texas hold 37.8% of insured US pets, led by California at 18.1%.
- Cats are the faster-growing segment: 25.1% of insured pets in 2025, up from 17.1% in 2020.
How many dogs have pet insurance in the US?
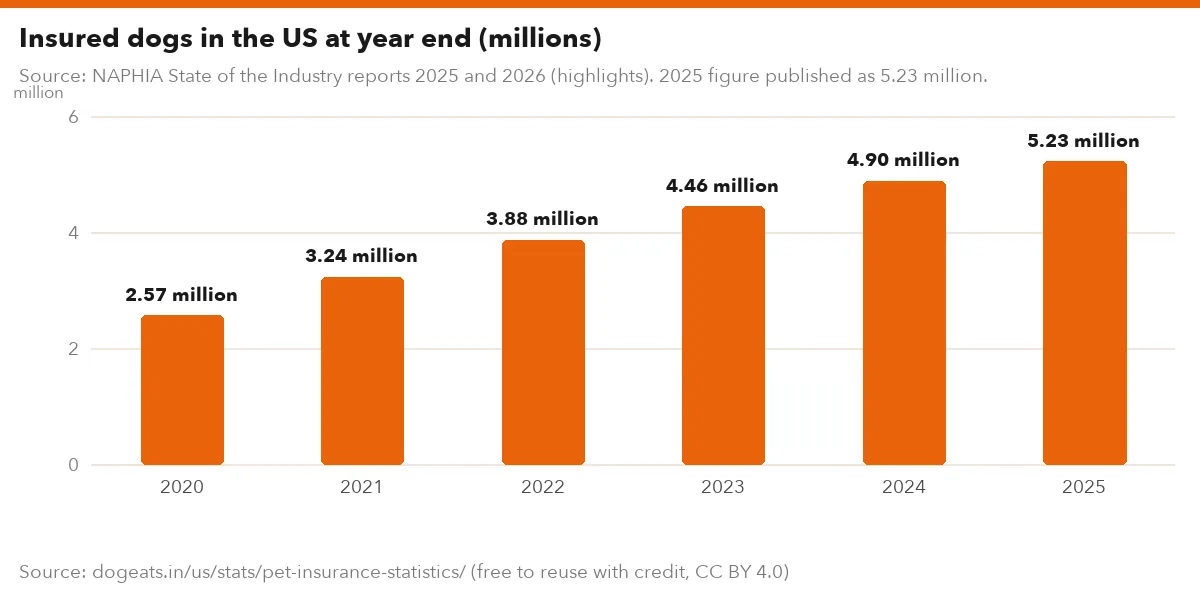
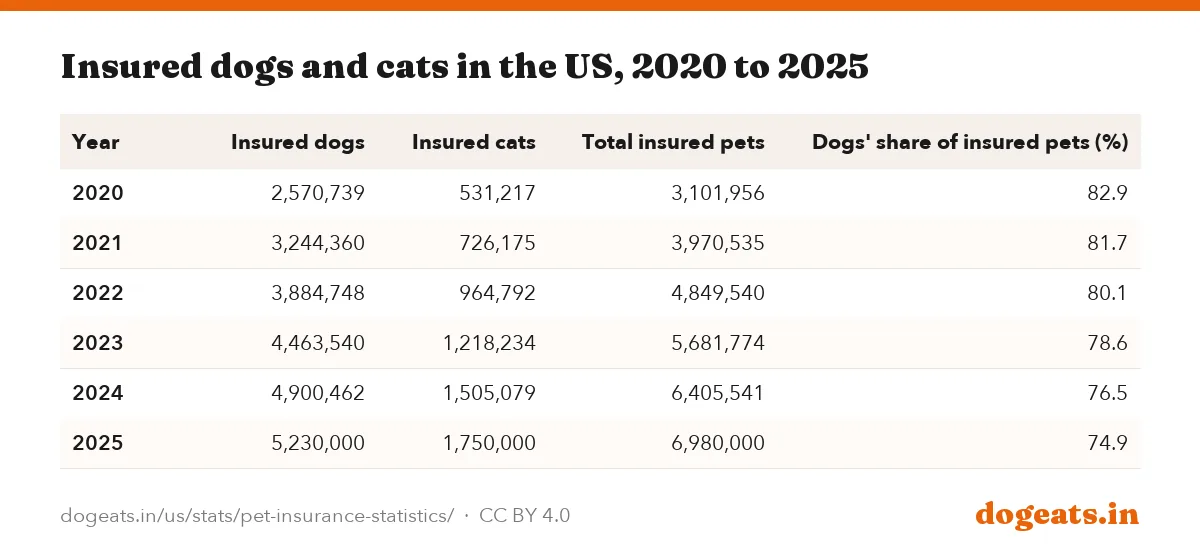
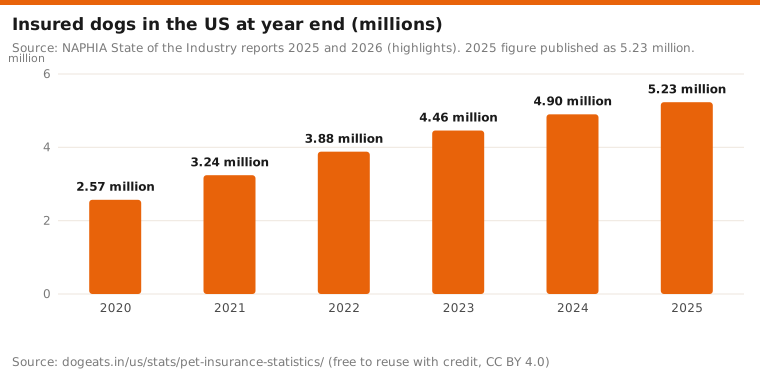
About 5.23 million dogs were insured in the United States at the end of 2025, according to the North American Pet Health Insurance Association (NAPHIA). Insured cats added 1.75 million, for 6.98 million insured pets in total.
Dogs have dominated the market from the start, but their share is shrinking. They made up 74.9% of insured pets in 2025, down from 78.6% in 2023. The number of insured dogs has still roughly doubled since 2020, up 103%.
Growth is slowing. Insured dogs rose 26.2% in 2021, 19.7% in 2022, 14.9% in 2023, 9.8% in 2024 and 6.8% in 2025.
Source: NAPHIA State of the Industry reports 2025 and 2026 (highlights). 2025 figure published as 5.23 million.
Show the numbers
| Label | million |
|---|---|
| 2020 | 2.57 million |
| 2021 | 3.24 million |
| 2022 | 3.88 million |
| 2023 | 4.46 million |
| 2024 | 4.90 million |
| 2025 | 5.23 million |
Embed this chart
| Year | Insured dogs | Insured cats | Total insured pets | Dogs' share of insured pets (%) |
|---|---|---|---|---|
| 2020 | 2,570,739 | 531,217 | 3,101,956 | 82.9 |
| 2021 | 3,244,360 | 726,175 | 3,970,535 | 81.7 |
| 2022 | 3,884,748 | 964,792 | 4,849,540 | 80.1 |
| 2023 | 4,463,540 | 1,218,234 | 5,681,774 | 78.6 |
| 2024 | 4,900,462 | 1,505,079 | 6,405,541 | 76.5 |
| 2025 | 5,230,000 | 1,750,000 | 6,980,000 | 74.9 |
Figures for 2025 are rounded in NAPHIA's report, so the 2025 row uses 5.23 million dogs and 1.75 million cats. NAPHIA says its data covers about 99% of written pet insurance premium in the US and Canada.
Only about 6 in 100 US dogs are insured
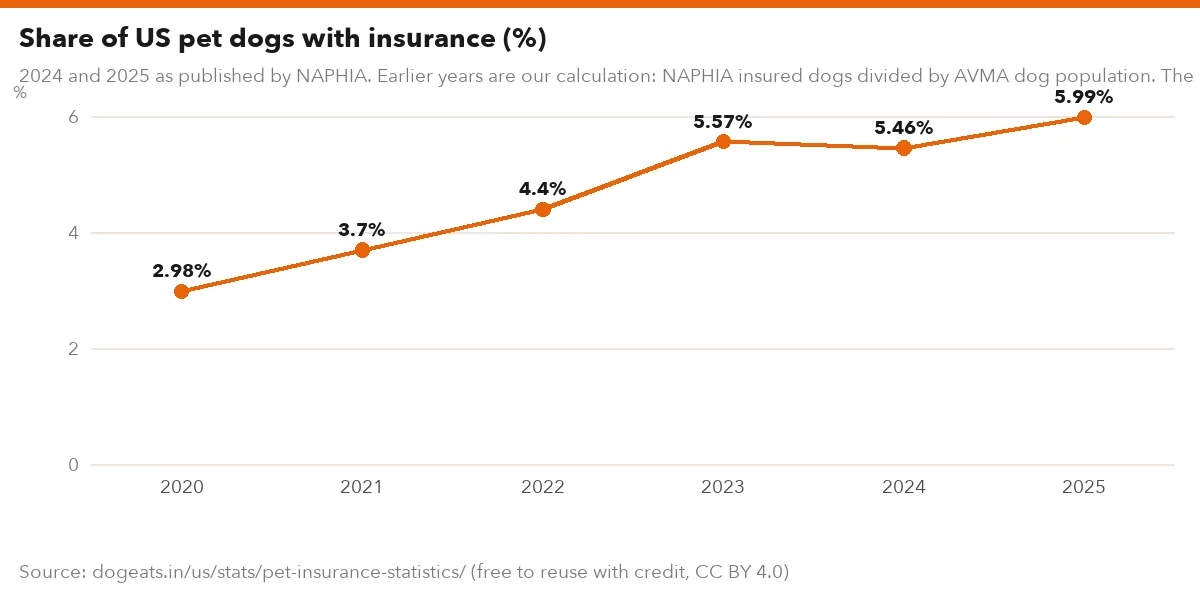
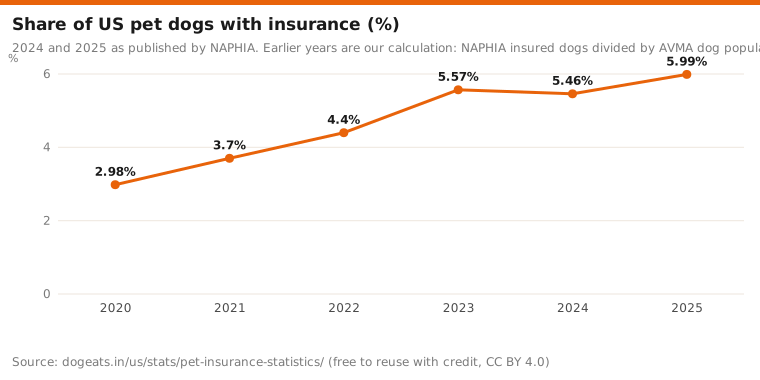
NAPHIA puts the US dog penetration rate at 5.99% for 2025, using the AVMA's count of 87.3 million pet dogs. That leaves about 82.1 million dogs with no insurance policy.
The rate has risen steadily. NAPHIA reported 5.46% for 2024. Our own division of NAPHIA's insured dog counts by AVMA dog population gives about 3% for 2020.
Cats lag further behind, at 2.29% of the AVMA's 76.3 million pet cats in 2025. Across dogs and cats together, US penetration was 4.27%.
2024 and 2025 as published by NAPHIA. Earlier years are our calculation: NAPHIA insured dogs divided by AVMA dog population. The 2023 value is inflated by a low AVMA dog count that year.
Show the numbers
| Label | % |
|---|---|
| 2020 | 2.98% |
| 2021 | 3.7% |
| 2022 | 4.4% |
| 2023 | 5.57% |
| 2024 | 5.46% |
| 2025 | 5.99% |
Embed this chart
Penetration depends on which dog count you divide by. APPA, the pet products trade group, reports 71 million dog-owning households but no total dog count. Our dog ownership statistics explain why the AVMA and APPA figures differ.
A $5.7 billion market, mostly built on dogs
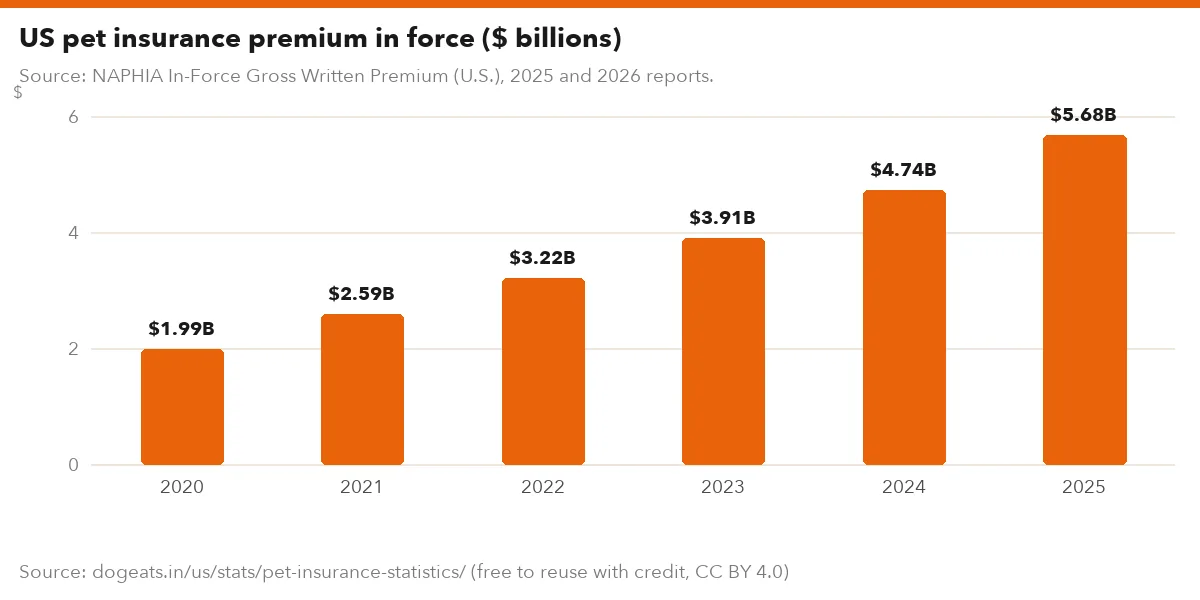
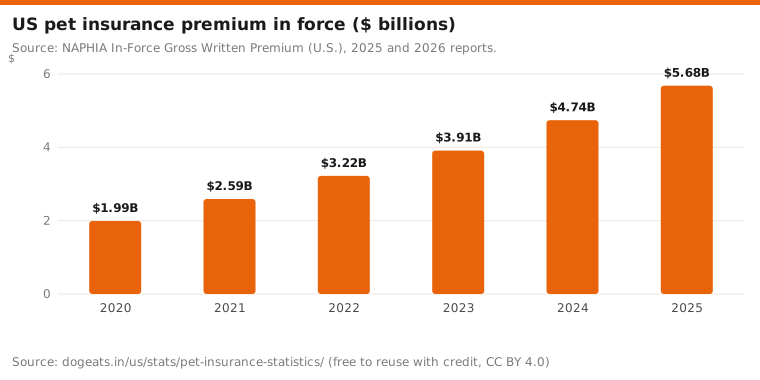
US pet insurance premium in force reached about $5.68 billion at the end of 2025, NAPHIA reports. The total is up 186% from $1.99 billion in 2020, and up 19.7% on 2024 alone.
Dogs bring in most of the money. Dog policies accounted for $4.80 billion, or 84.5% of US premium, in 2025. Dog premium grew 17.6% in 2025, while cat premium grew 33.1%.
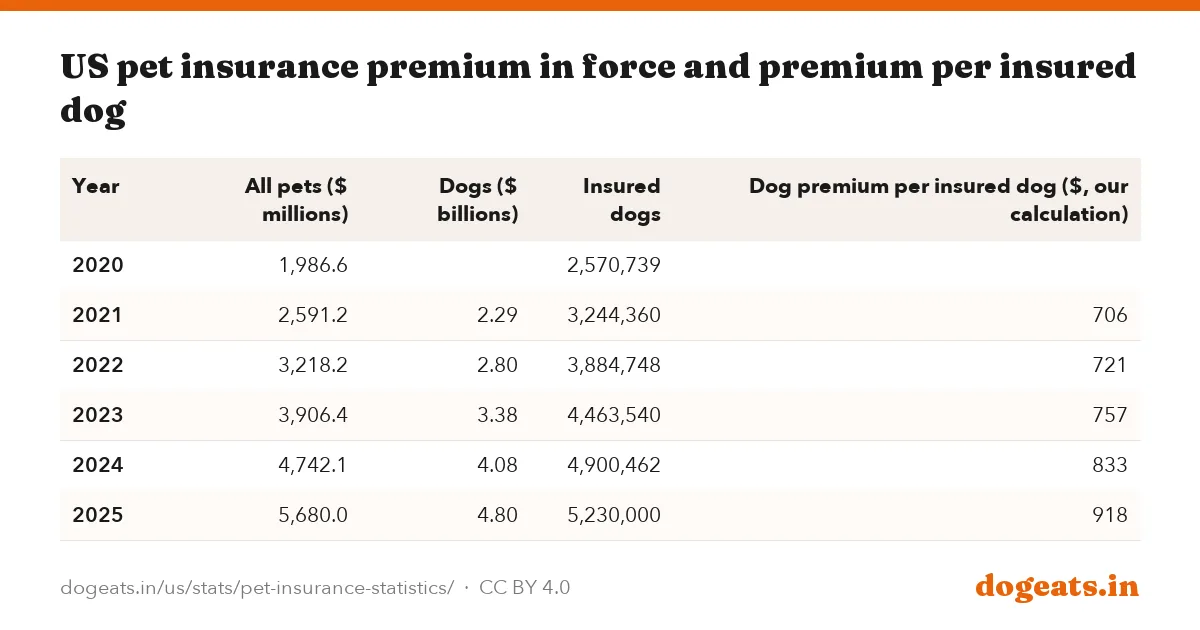
Premium has grown much faster than the number of insured pets. Dividing dog premium by insured dogs gives about $918 per insured dog in 2025, up from $706 in 2021.
Source: NAPHIA In-Force Gross Written Premium (U.S.), 2025 and 2026 reports.
Show the numbers
| Label | $ |
|---|---|
| 2020 | $1.99B |
| 2021 | $2.59B |
| 2022 | $3.22B |
| 2023 | $3.91B |
| 2024 | $4.74B |
| 2025 | $5.68B |
Embed this chart
| Year | All pets ($ millions) | Dogs ($ billions) | Insured dogs | Dog premium per insured dog ($, our calculation) |
|---|---|---|---|---|
| 2020 | 1,986.6 | 2,570,739 | ||
| 2021 | 2,591.2 | 2.29 | 3,244,360 | 706 |
| 2022 | 3,218.2 | 2.80 | 3,884,748 | 721 |
| 2023 | 3,906.4 | 3.38 | 4,463,540 | 757 |
| 2024 | 4,742.1 | 4.08 | 4,900,462 | 833 |
| 2025 | 5,680.0 | 4.80 | 5,230,000 | 918 |
NAPHIA reported $3.07 billion in claims paid in the US in 2024. Its release prints the figure as "$3,065.7 billion", which we read as a typo for millions.
How much does pet insurance cost for a dog?
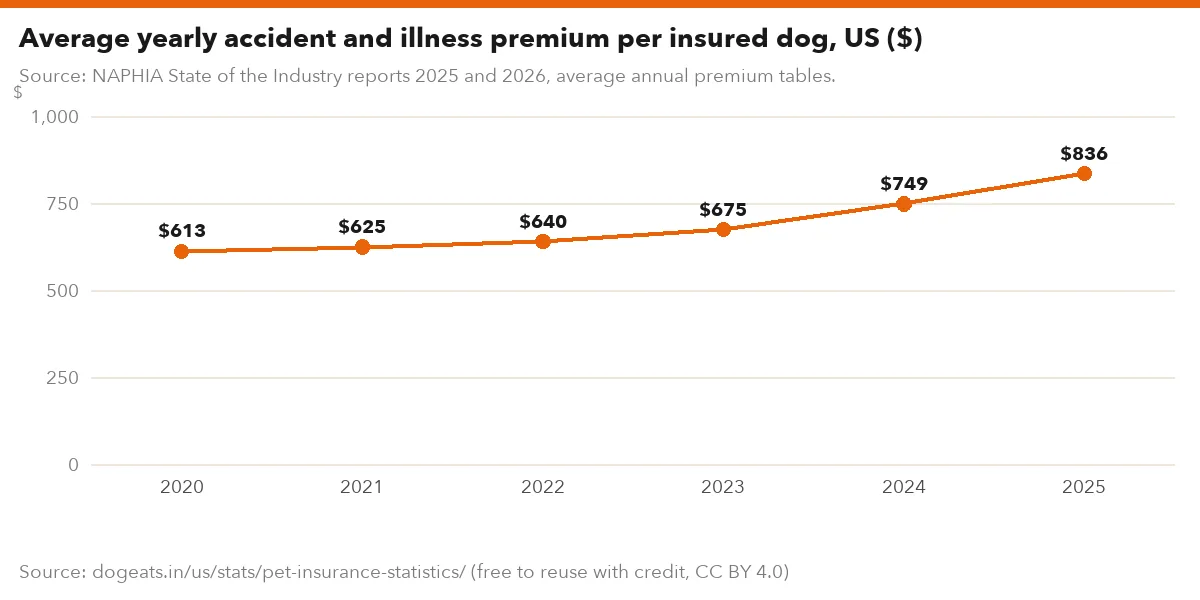
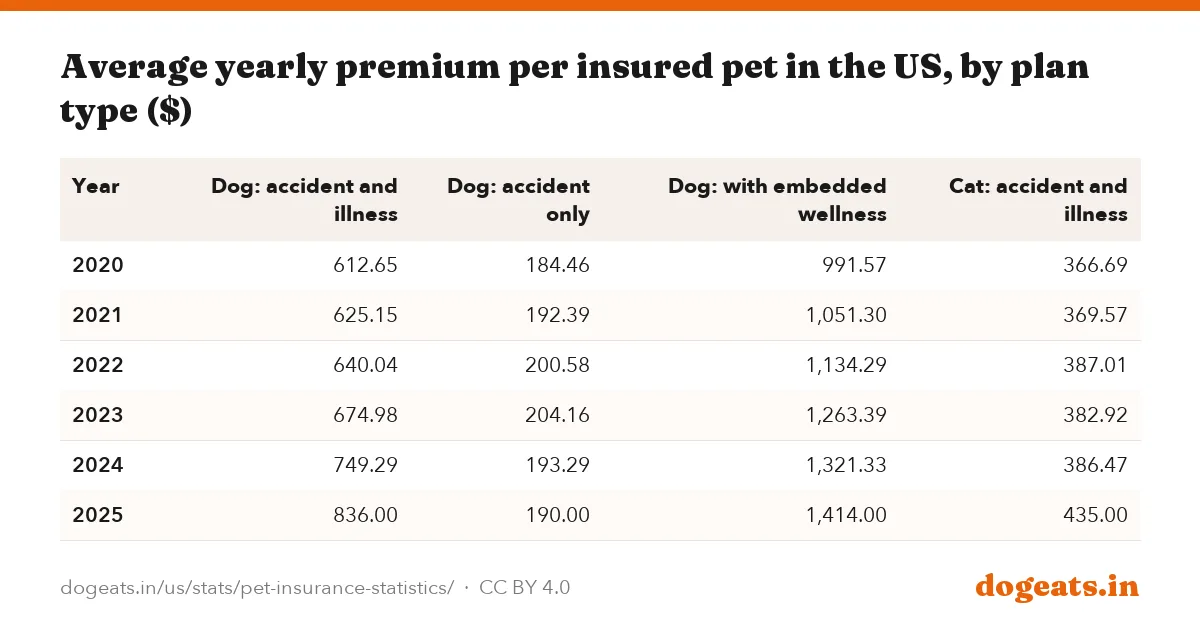
The average US accident and illness policy for a dog cost $836 a year in 2025, NAPHIA reports. That works out to about $70 a month. In 2024 the figure was $749.29, or $62.44 a month.
Accident and illness is the most common plan type. It pays toward injuries and illnesses such as cancer, infections and digestive problems. Accident-only plans are much cheaper, at $190 a year for dogs in 2025.
Plans with built-in wellness cover, such as vaccinations and screening, cost the most. They averaged $1,414 a year for dogs in 2025, up 7.0%.
Your own quote can be far from these averages, depending on the dog and the plan chosen. Rover's 2026 cost estimates put insurance for a senior dog at $630 to $4,595 a year, against $520 to $1,230 for an adult dog.
Accident-only plans pay for events like a swallowed object. A dog that gulps a corn cob or cooked chicken wing bones can need surgery, which is where these plans pay out.
Dog premiums are rising with vet prices
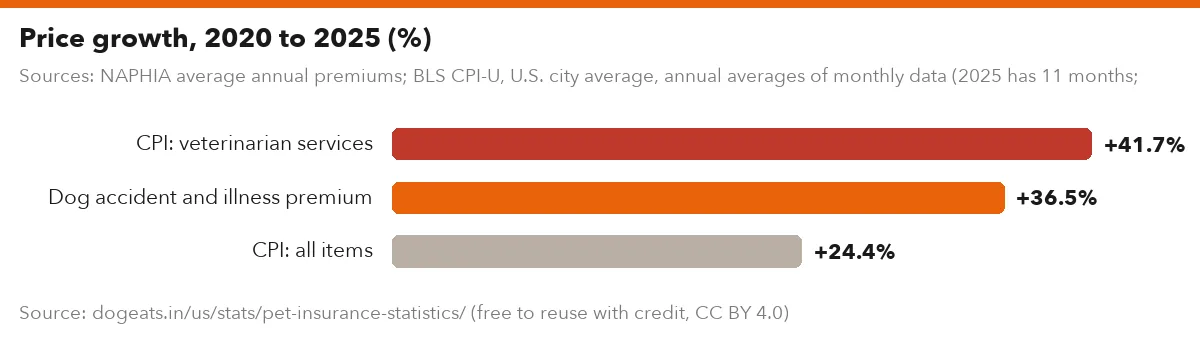
Insurance costs track the vet bills they pay for. From 2020 to 2025, the average dog accident and illness premium rose 36.5%. Over the same years, the Bureau of Labor Statistics CPI for veterinarian services rose 41.7%.
Both outpaced general inflation. The all-items CPI rose 24.4% between 2020 and 2025.
The jumps in premiums came late. Dog accident and illness premiums rose 2% to 5.5% a year from 2021 to 2023, then 11.0% in 2024 and 11.5% in 2025.
Sources: NAPHIA average annual premiums; BLS CPI-U, U.S. city average, annual averages of monthly data (2025 has 11 months; October 2025 was not published).
Show the numbers
| Label | % |
|---|---|
| CPI: veterinarian services | +41.7% |
| Dog accident and illness premium | +36.5% |
| CPI: all items | +24.4% |
Embed this chart
Rising vet prices are covered in more detail in our cost of owning a dog report.
California holds almost a fifth of insured pets
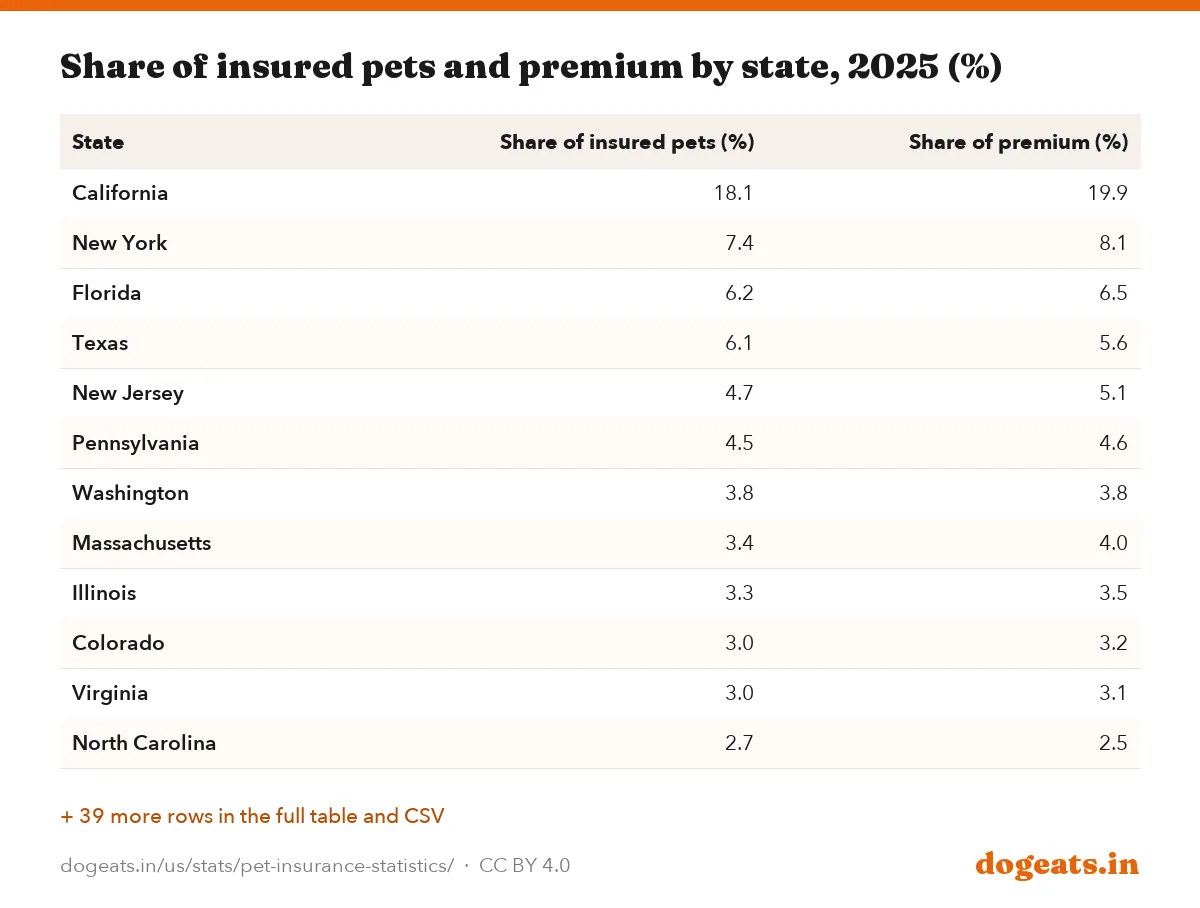
Insured pets are concentrated on the coasts and in big states. California alone held 18.1% of insured US pets and 19.9% of premium in 2025. California, New York, Florida and Texas together held 37.8%.
Several states carry more premium than their share of pets. New York, New Jersey and Massachusetts all show a higher share of premium than of pets, which points to higher average prices there.
Some states with very high dog ownership barely register. Arkansas, the top dog-owning state in the AVMA's last state ranking, held 0.3% of insured pets.
Source: NAPHIA 2026 State of the Industry report, member-contributed data only.
Show the numbers
| Label | % |
|---|---|
| California | 18.1% |
| New York | 7.4% |
| Florida | 6.2% |
| Texas | 6.1% |
| New Jersey | 4.7% |
| Pennsylvania | 4.5% |
| Washington | 3.8% |
| Massachusetts | 3.4% |
| Illinois | 3.3% |
| Colorado | 3.0% |
Embed this chart
| State | Share of insured pets (%) | Share of premium (%) |
|---|---|---|
| California | 18.1 | 19.9 |
| New York | 7.4 | 8.1 |
| Florida | 6.2 | 6.5 |
| Texas | 6.1 | 5.6 |
| New Jersey | 4.7 | 5.1 |
| Pennsylvania | 4.5 | 4.6 |
| Washington | 3.8 | 3.8 |
| Massachusetts | 3.4 | 4.0 |
| Illinois | 3.3 | 3.5 |
| Colorado | 3.0 | 3.2 |
| Virginia | 3.0 | 3.1 |
| North Carolina | 2.7 | 2.5 |
| Ohio | 2.6 | 2.2 |
| Georgia | 2.3 | 2.0 |
| Maryland | 2.1 | 2.3 |
| Arizona | 2.1 | 2.1 |
| Michigan | 2.0 | 1.7 |
| Connecticut | 1.7 | 2.0 |
| Oregon | 1.7 | 1.6 |
| Nevada | 1.4 | 1.2 |
| Minnesota | 1.4 | 1.2 |
| Wisconsin | 1.4 | 1.2 |
| South Carolina | 1.3 | 1.1 |
| Tennessee | 1.3 | 1.1 |
| Indiana | 1.2 | 0.9 |
| Missouri | 1.1 | 0.8 |
| Utah | 0.8 | 0.7 |
| New Hampshire | 0.8 | 0.9 |
| Alabama | 0.6 | 0.4 |
| Kentucky | 0.6 | 0.4 |
| Maine | 0.6 | 0.5 |
| Rhode Island | 0.5 | 0.5 |
| Iowa | 0.5 | 0.4 |
| Louisiana | 0.5 | 0.4 |
| Hawaii | 0.5 | 0.5 |
| Oklahoma | 0.5 | 0.3 |
| Idaho | 0.5 | 0.4 |
| Kansas | 0.4 | 0.3 |
| New Mexico | 0.4 | 0.3 |
| District of Columbia | 0.4 | 0.4 |
| Delaware | 0.4 | 0.3 |
| Nebraska | 0.3 | 0.2 |
| Arkansas | 0.3 | 0.2 |
| Alaska | 0.3 | 0.3 |
| Vermont | 0.3 | 0.2 |
| Montana | 0.3 | 0.2 |
| West Virginia | 0.2 | 0.2 |
| Mississippi | 0.2 | 0.2 |
| North Dakota | 0.1 | 0.1 |
| Wyoming | 0.1 | 0.1 |
| South Dakota | 0.1 | 0.1 |
State shares mix population size with how common insurance is locally. NAPHIA does not publish penetration rates by state.
What dog insurance claims pay for
Stomach and gut problems top the list of dog claims in North America, NAPHIA reports. Ear infections, skin conditions and anxiety or behavioral issues follow.
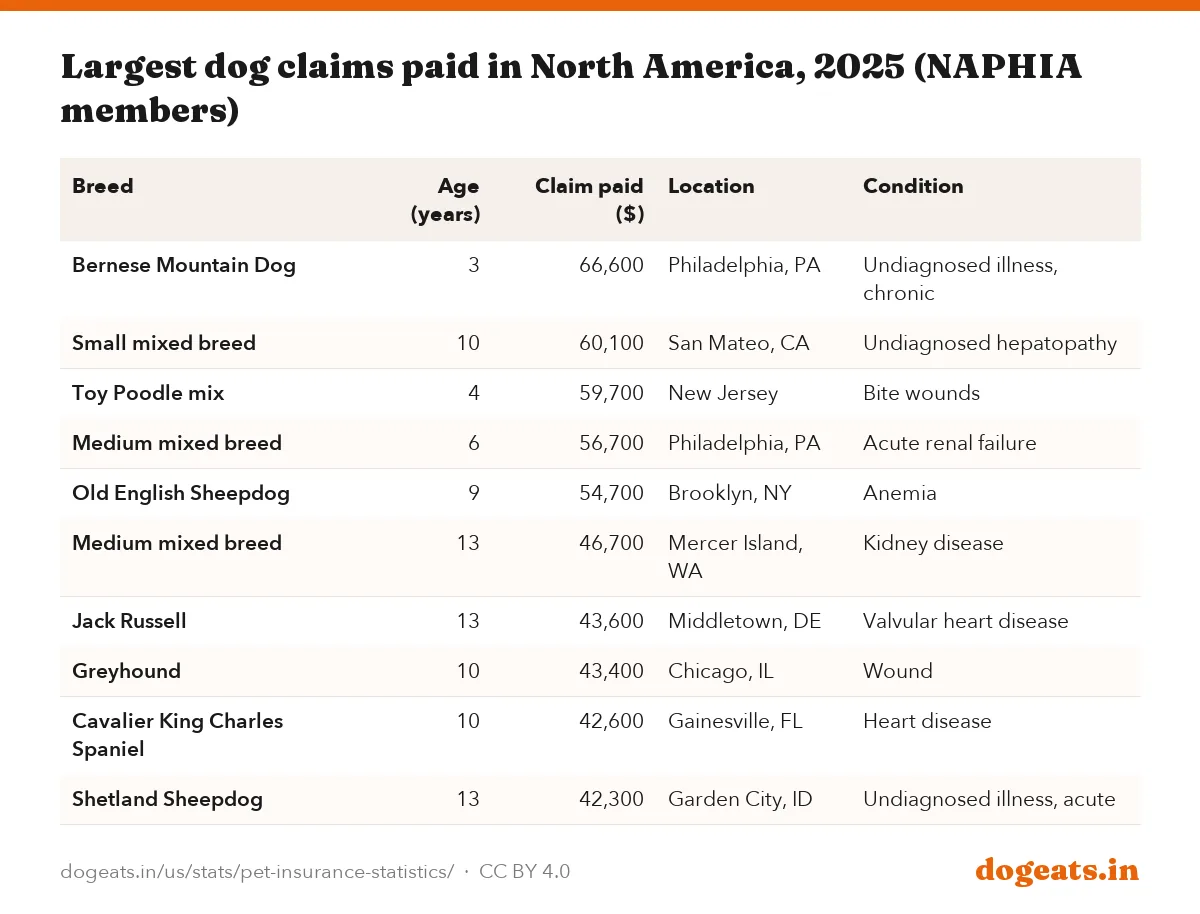
The largest single dog claim paid in 2025 was $66,600, for a 3-year-old Bernese Mountain Dog in Philadelphia with a chronic undiagnosed illness. All ten of the biggest dog claims exceeded $42,000.
- Gastrointestinal conditions
- Otitis and ear infections
- Skin conditions: infections, masses, dermatitis
- Anxiety, behavioral and neurological issues
- Allergies
- Growths and masses
- Eye and vision disorders
- Diarrhea
- Urinary tract infections
- Musculoskeletal problems
- Exams and wellness
- Vomiting
| Breed | Age (years) | Claim paid ($) | Location | Condition |
|---|---|---|---|---|
| Bernese Mountain Dog | 3 | 66,600 | Philadelphia, PA | Undiagnosed illness, chronic |
| Small mixed breed | 10 | 60,100 | San Mateo, CA | Undiagnosed hepatopathy |
| Toy Poodle mix | 4 | 59,700 | New Jersey | Bite wounds |
| Medium mixed breed | 6 | 56,700 | Philadelphia, PA | Acute renal failure |
| Old English Sheepdog | 9 | 54,700 | Brooklyn, NY | Anemia |
| Medium mixed breed | 13 | 46,700 | Mercer Island, WA | Kidney disease |
| Jack Russell | 13 | 43,600 | Middletown, DE | Valvular heart disease |
| Greyhound | 10 | 43,400 | Chicago, IL | Wound |
| Cavalier King Charles Spaniel | 10 | 42,600 | Gainesville, FL | Heart disease |
| Shetland Sheepdog | 13 | 42,300 | Garden City, ID | Undiagnosed illness, acute |
These are extreme cases, not typical claims. NAPHIA does not publish an average claim per dog in its public highlights. Four of the ten were mixed breeds or mixes, so costly illness is not limited to purebreds. For breed trends, see the most popular dog breeds.
Notes on NAPHIA's numbers
NAPHIA is an industry association, and its data are compiled by the consultancy Willis Towers Watson from member surveys and public filings. Some figures rely on actuarial estimates where public data are incomplete.
A few published numbers do not line up. NAPHIA's April 2025 release says US insured pets rose 20.7% in 2024, while its report deck says 12.7%. The insured pet counts support 12.7%.
The June 2026 materials also differ. NAPHIA's web page says North American insured pets rose 8.5% to 7.6 million, while the deck's summary page says 12.4%. Dividing 7.6 million by 7.03 million gives about 8%.
Frequently asked questions
How many dogs have pet insurance in the US?
About 5.23 million dogs were insured at the end of 2025, NAPHIA reports. Dogs made up 74.9% of the 6.98 million insured pets in the US.
What percentage of dogs are insured in the US?
NAPHIA puts the figure at 5.99% for 2025, using the AVMA's count of 87.3 million pet dogs. It was 5.46% in 2024. About 82 million US dogs have no insurance.
How much is pet insurance for a dog per month?
The average accident and illness policy for a dog cost $836 a year in 2025, about $70 a month, according to NAPHIA. Accident-only cover averaged $190 a year. Individual quotes vary with breed, age, location and deductible.
How fast are dog insurance premiums rising?
The average dog accident and illness premium rose 11.0% in 2024 and 11.5% in 2025. From 2020 to 2025 it rose 36.5%, a little less than the 41.7% rise in the CPI for veterinarian services.
How big is the US pet insurance market?
US premium in force reached about $5.68 billion at the end of 2025, up 19.7% on 2024. Dog policies made up $4.80 billion of that.
Which state has the most insured pets?
California, with 18.1% of insured US pets and 19.9% of premium in 2025. New York, Florida and Texas follow.
What do dog insurance claims pay for most?
Gastrointestinal problems are the most common dog claim, followed by ear infections, skin conditions and anxiety or behavioral issues, NAPHIA reports.
Are more cats being insured?
Yes. Cats made up 25.1% of insured US pets in 2025, up from 17.1% in 2020, and cat premium grew 33.1% in 2025.
Methodology and limitations
We downloaded NAPHIA's 2025 and 2026 State of the Industry highlight reports, which cover calendar years 2024 and 2025. We also read NAPHIA's April 2025 release and industry data page in October 2026. Chart values for premium and insured pets were read from the report pages.
Penetration for 2020 to 2023 and premium per insured dog are our own calculations. We divided NAPHIA's insured dogs by the AVMA's dog population for each year, and NAPHIA's dog premium by insured dogs.
CPI growth uses BLS series CUUR0000SS62054 (veterinarian services) and CUUR0000SA0 (all items), averaged over the months of each year. October 2025 was not published because of the 2025 lapse in federal appropriations, so 2025 averages use 11 months.
Sources
- NAPHIA, 2026 State of the Industry Report highlights (2025 data), Insured dogs, penetration, premiums, state shares, claims for 2025
- NAPHIA, 2025 State of the Industry Report highlights (2024 data), 2020 to 2024 premium, insured dogs and cats, premium tables
- NAPHIA release, North American pet insurance reaches $5.2B (Apr 2025), 2024 US totals, 5.46% dog penetration, $749.29 dog premium, claims paid
- Also consulted: NAPHIA, Industry data page, AVMA, U.S. pet ownership statistics (2025), AVMA, Pet population trends chart (Dec 2025), BLS, CPI-U veterinarian services, U.S. city average, BLS, CPI-U all items, U.S. city average, Rover, The Cost of Dog Parenthood in 2026 (company survey and price estimates).
Cite, embed and download
This report, its data and its images are free to reuse under a Creative Commons Attribution 4.0 licence. Credit dogeats.in with a link to this page. Every chart has its own embed code, every table has a CSV and an image download, and the images below are ready for social posts, slides and articles.
Cite this report
Link to this report

Every chart and table as an image