Data report · Updated October 2026
Pet deaths, injuries and losses on US airlines: DOT incident reports by airline and year, 2015 to 2025
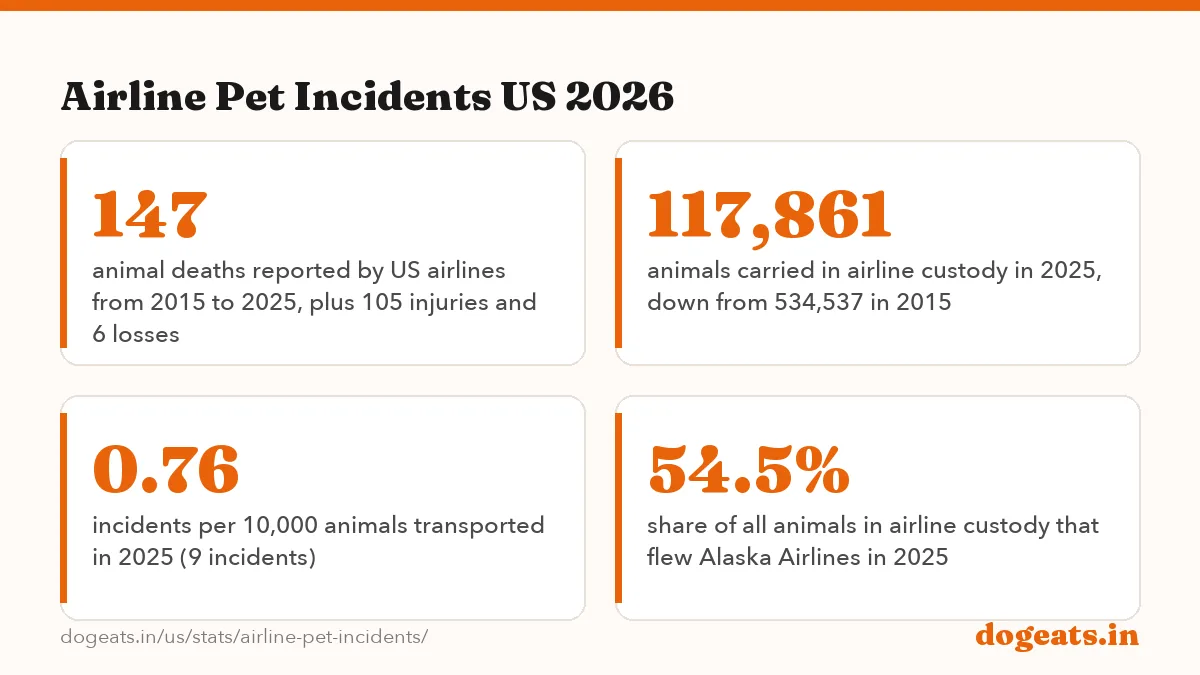
US airlines reported 3 animal deaths, 5 injuries and 1 loss in 2025 while carrying 117,861 animals in their custody, or 0.76 incidents per 10,000 animals. From 2015 to 2025 they reported 147 deaths, 105 injuries and 6 losses among 3,553,726 animals. The number of animals flown in airline custody fell 78% over the decade.
Key findings
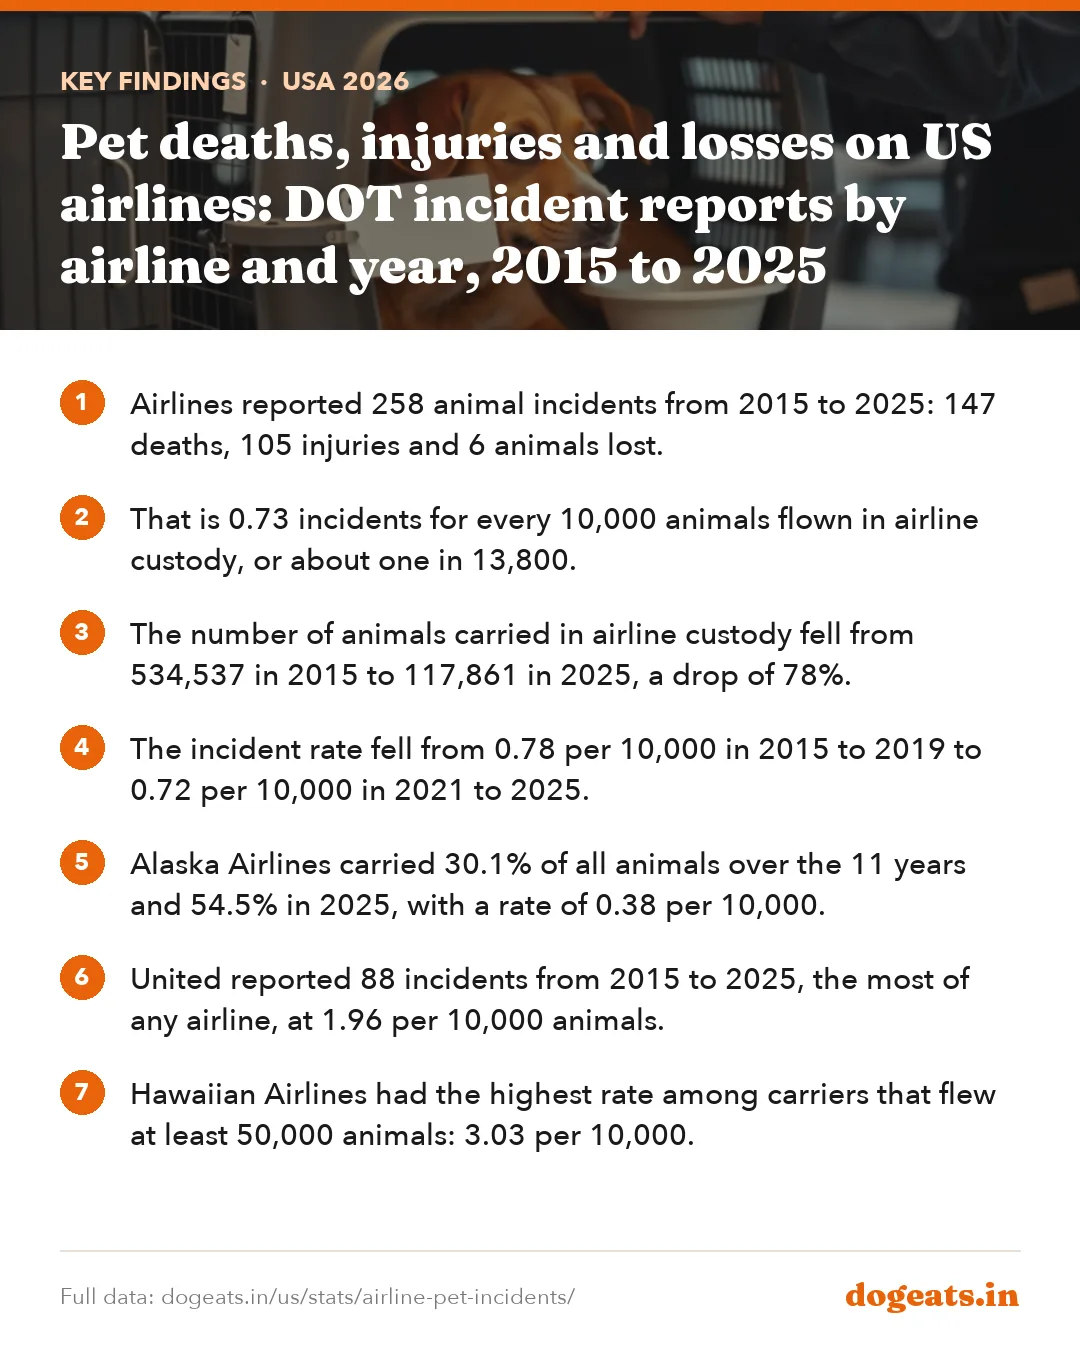
- Airlines reported 258 animal incidents from 2015 to 2025: 147 deaths, 105 injuries and 6 animals lost.
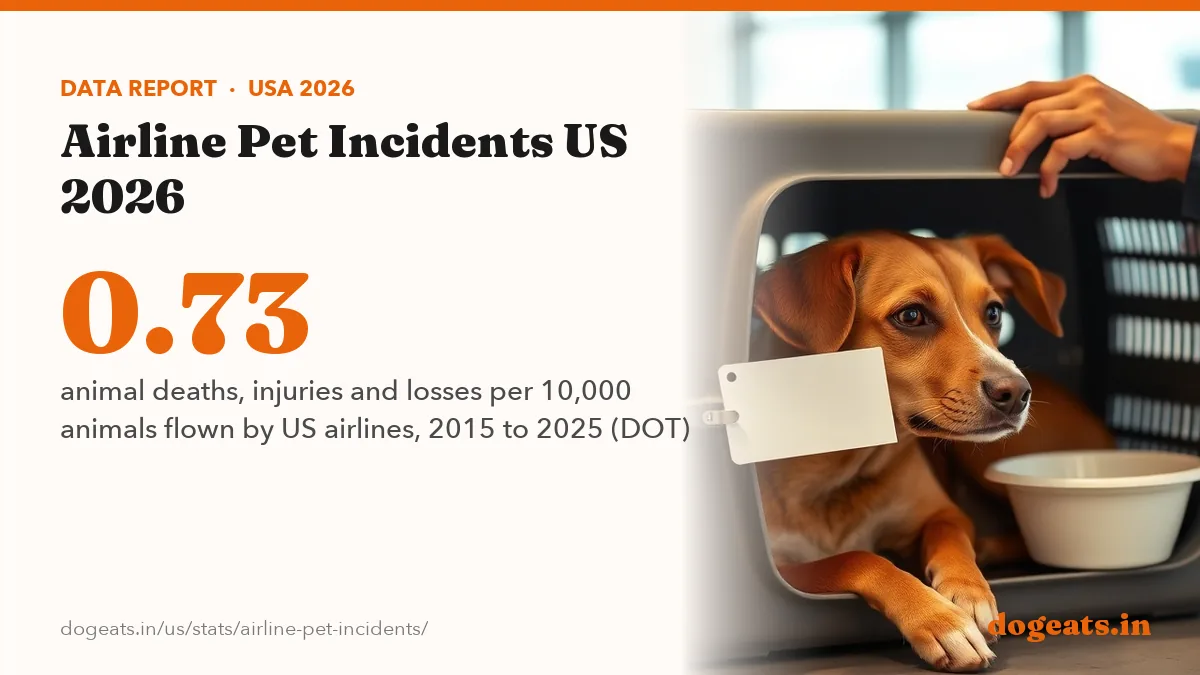
- That is 0.73 incidents for every 10,000 animals flown in airline custody, or about one in 13,800.
- The number of animals carried in airline custody fell from 534,537 in 2015 to 117,861 in 2025, a drop of 78%.
- The incident rate fell from 0.78 per 10,000 in 2015 to 2019 to 0.72 per 10,000 in 2021 to 2025.
- Alaska Airlines carried 30.1% of all animals over the 11 years and 54.5% in 2025, with a rate of 0.38 per 10,000.
- United reported 88 incidents from 2015 to 2025, the most of any airline, at 1.96 per 10,000 animals.
- Hawaiian Airlines had the highest rate among carriers that flew at least 50,000 animals: 3.03 per 10,000.
- Hawaiian's 6 deaths in 2022, among 5,781 animals, produced the highest single-year rate for any airline that carried more than 1,000 animals: 13.84 per 10,000.
- DOT counts cover only animals in airline custody, such as checked pets and cargo shipments. Pets in the cabin, service dogs and former emotional support animals at a passenger's seat are not counted.
How many pets die on US airlines each year?
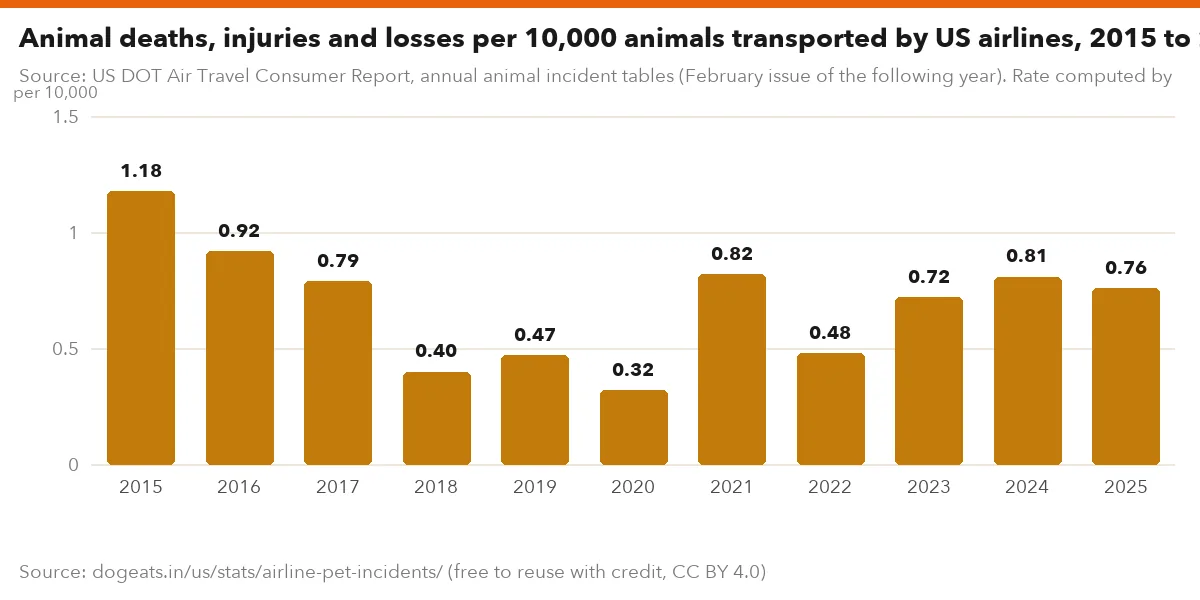
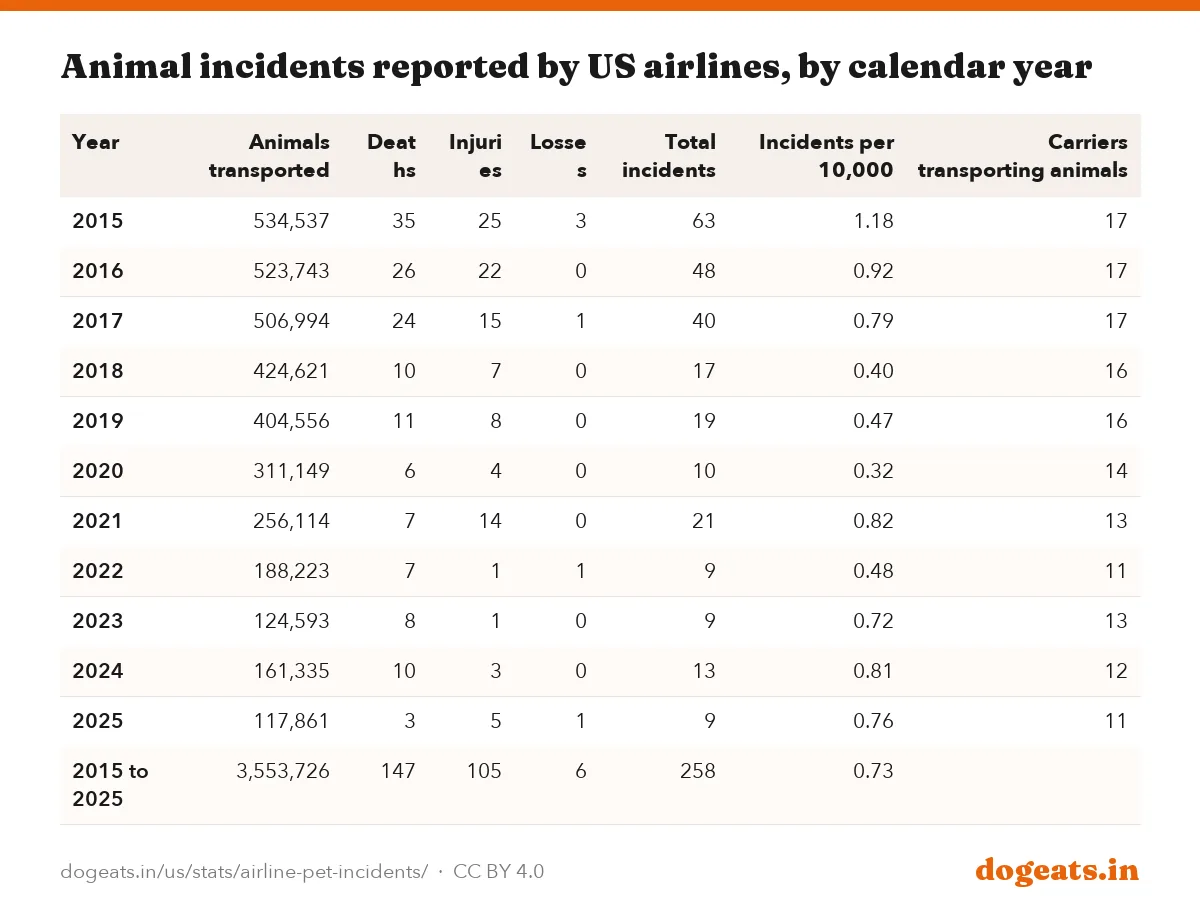
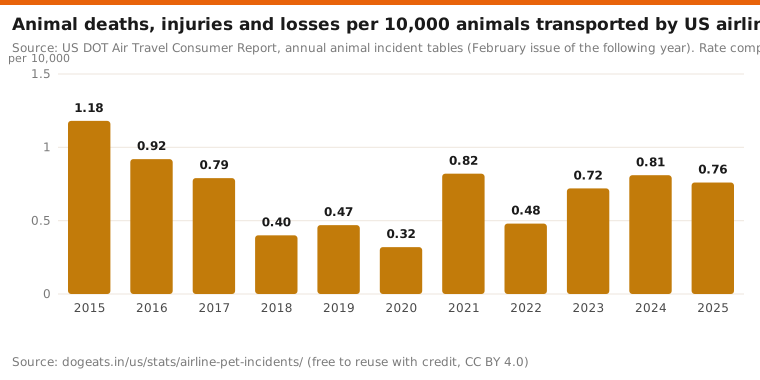
US airlines reported 3 animal deaths in 2025, according to the Department of Transportation's Air Travel Consumer Report. They also reported 5 injuries and 1 lost animal, for 9 incidents in all.
The worst year in the data was 2015, the first year of full reporting, with 35 deaths, 25 injuries and 3 losses. Deaths fell to 6 in 2020 and have stayed between 3 and 10 a year since.
Across 2015 to 2025, airlines reported 258 incidents among 3,553,726 animals. That is 0.73 incidents per 10,000 animals, or roughly one for every 13,800 animals flown.
Source: US DOT Air Travel Consumer Report, annual animal incident tables (February issue of the following year). Rate computed by dogeats.in; matches DOT's published rate.
Show the numbers
| Label | per 10,000 |
|---|---|
| 2015 | 1.18 |
| 2016 | 0.92 |
| 2017 | 0.79 |
| 2018 | 0.40 |
| 2019 | 0.47 |
| 2020 | 0.32 |
| 2021 | 0.82 |
| 2022 | 0.48 |
| 2023 | 0.72 |
| 2024 | 0.81 |
| 2025 | 0.76 |
Embed this chart
| Year | Animals transported | Deaths | Injuries | Losses | Total incidents | Incidents per 10,000 | Carriers transporting animals |
|---|---|---|---|---|---|---|---|
| 2015 | 534,537 | 35 | 25 | 3 | 63 | 1.18 | 17 |
| 2016 | 523,743 | 26 | 22 | 0 | 48 | 0.92 | 17 |
| 2017 | 506,994 | 24 | 15 | 1 | 40 | 0.79 | 17 |
| 2018 | 424,621 | 10 | 7 | 0 | 17 | 0.40 | 16 |
| 2019 | 404,556 | 11 | 8 | 0 | 19 | 0.47 | 16 |
| 2020 | 311,149 | 6 | 4 | 0 | 10 | 0.32 | 14 |
| 2021 | 256,114 | 7 | 14 | 0 | 21 | 0.82 | 13 |
| 2022 | 188,223 | 7 | 1 | 1 | 9 | 0.48 | 11 |
| 2023 | 124,593 | 8 | 1 | 0 | 9 | 0.72 | 13 |
| 2024 | 161,335 | 10 | 3 | 0 | 13 | 0.81 | 12 |
| 2025 | 117,861 | 3 | 5 | 1 | 9 | 0.76 | 11 |
| 2015 to 2025 | 3,553,726 | 147 | 105 | 6 | 258 | 0.73 |
The rate has not fallen in a straight line. It dropped to 0.32 per 10,000 in 2020, then rose to 0.82 in 2021. Because the yearly incident counts are small, one or two extra reports move the rate a lot.
Far fewer animals fly in airline custody than a decade ago
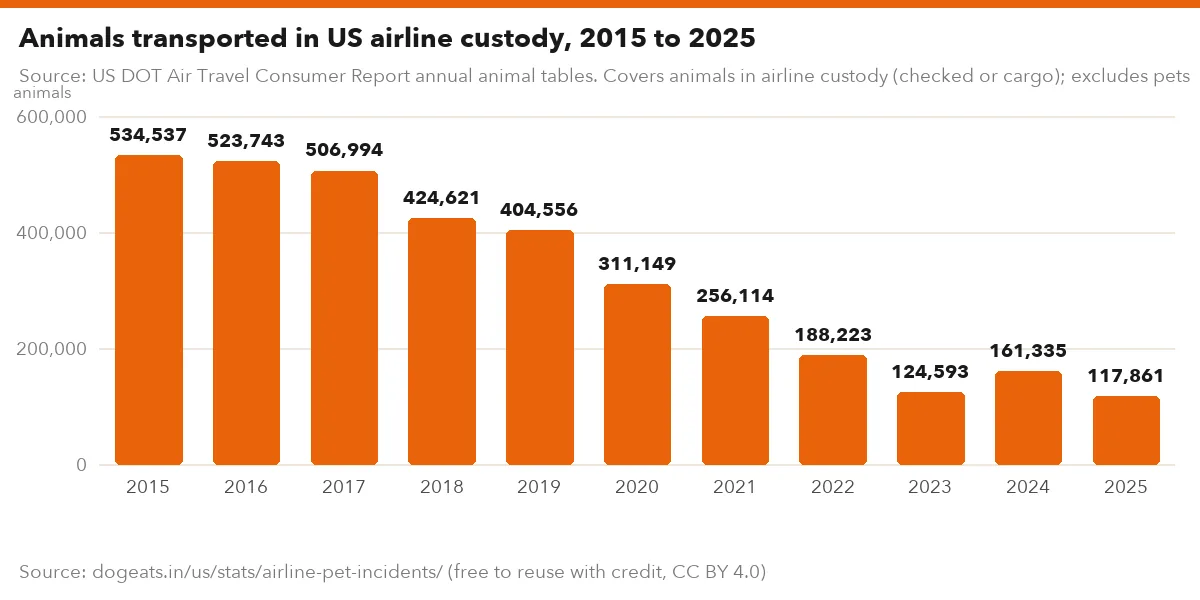
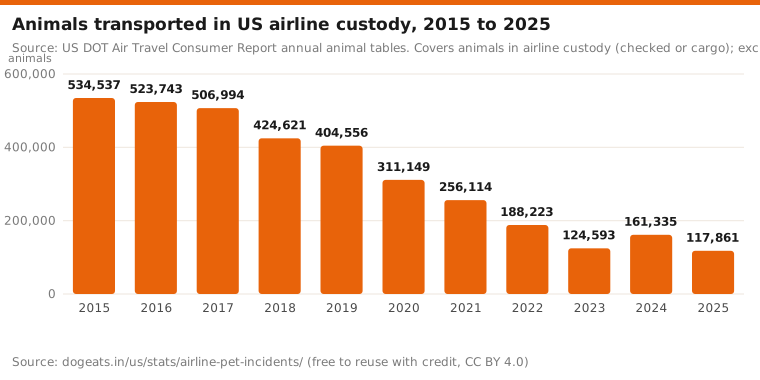
Airlines carried 534,537 animals in their custody in 2015 and 117,861 in 2025, a fall of 78%. The low point was 117,861 in 2025, just under the 124,593 of 2023.
The number of carriers that flew any animals in custody shrank from 17 in 2015 to 11 in 2025. Southwest, JetBlue, Frontier, Spirit, Allegiant and Breeze have reported zero animals transported in recent annual reports.
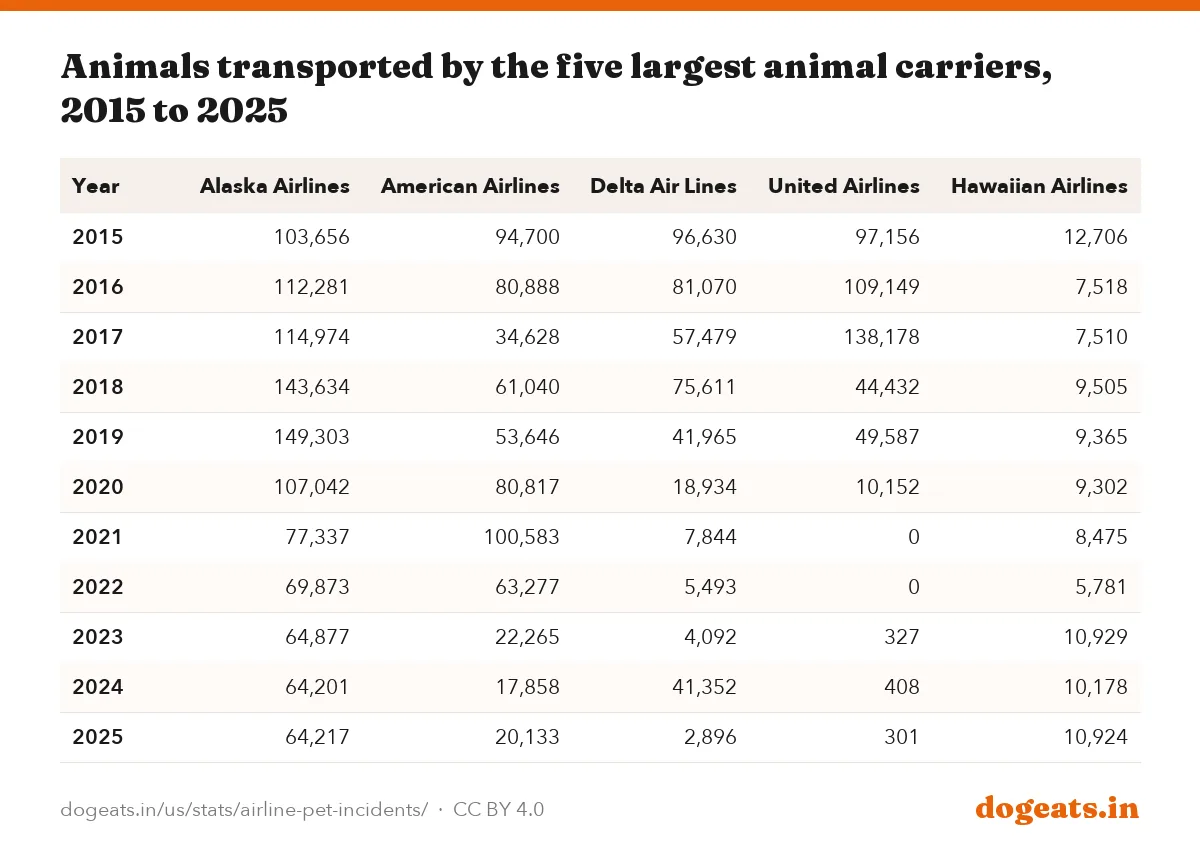
United carried 138,178 animals in 2017, more than any other airline that year. It reported zero in 2021 and 2022 and has carried only a few hundred a year since: 327 in 2023, 408 in 2024 and 301 in 2025.
Alaska Airlines now dominates. It carried 64,217 animals in 2025, 54.5% of the national total, up from 19.4% in 2015.
Source: US DOT Air Travel Consumer Report annual animal tables. Covers animals in airline custody (checked or cargo); excludes pets in the cabin at the passenger's seat.
Show the numbers
| Label | animals |
|---|---|
| 2015 | 534,537 |
| 2016 | 523,743 |
| 2017 | 506,994 |
| 2018 | 424,621 |
| 2019 | 404,556 |
| 2020 | 311,149 |
| 2021 | 256,114 |
| 2022 | 188,223 |
| 2023 | 124,593 |
| 2024 | 161,335 |
| 2025 | 117,861 |
Embed this chart
DOT's tables do not give reasons for these changes. Airlines have changed their pet policies over time, and some of the drop in 2020 and 2021 tracks the fall in air travel during the pandemic.
Fewer dogs flying does not mean fewer dogs. The number of pet dogs in the US grew over the same period, as our dog ownership statistics show.
Incident rates by airline, 2015 to 2025
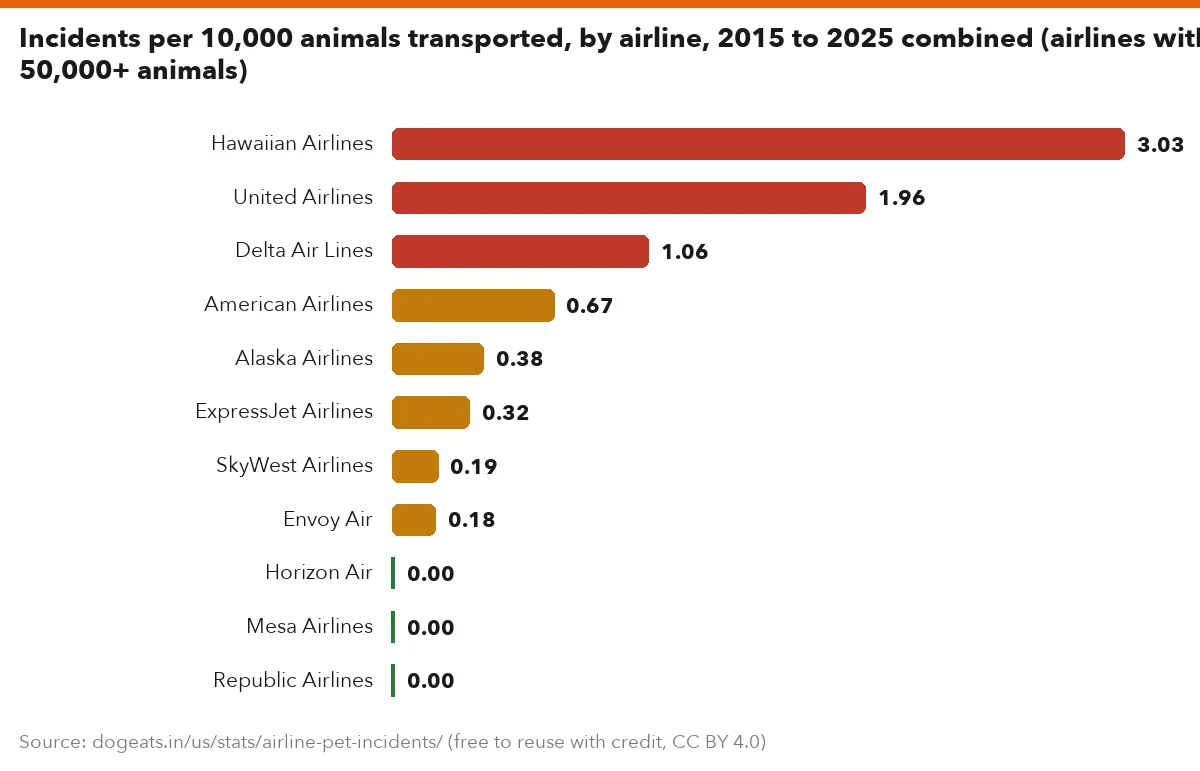
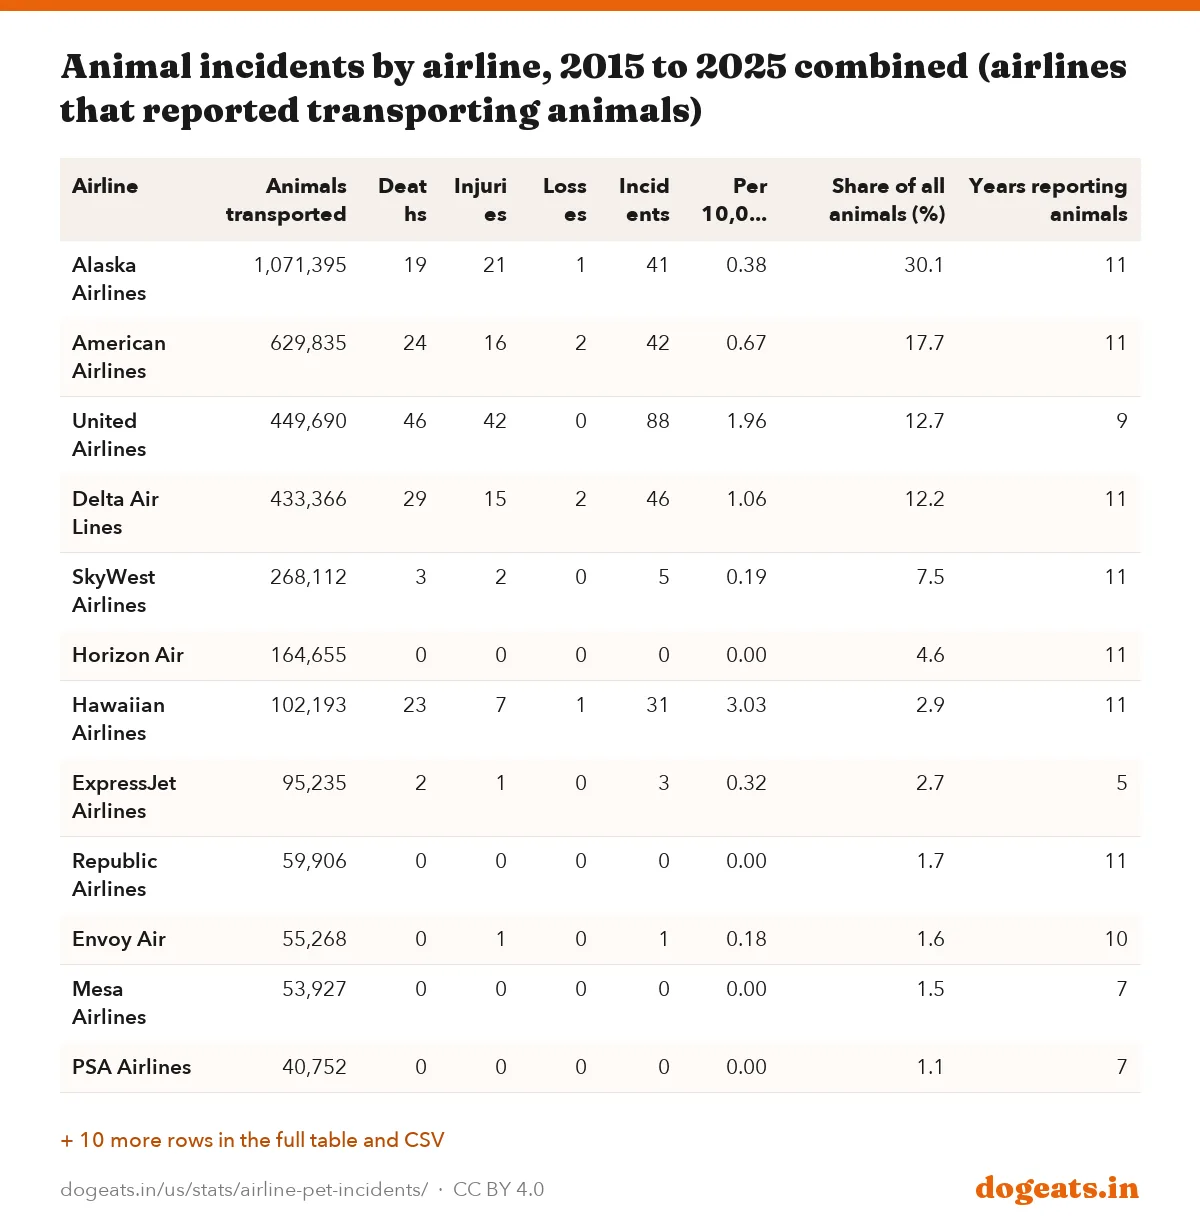
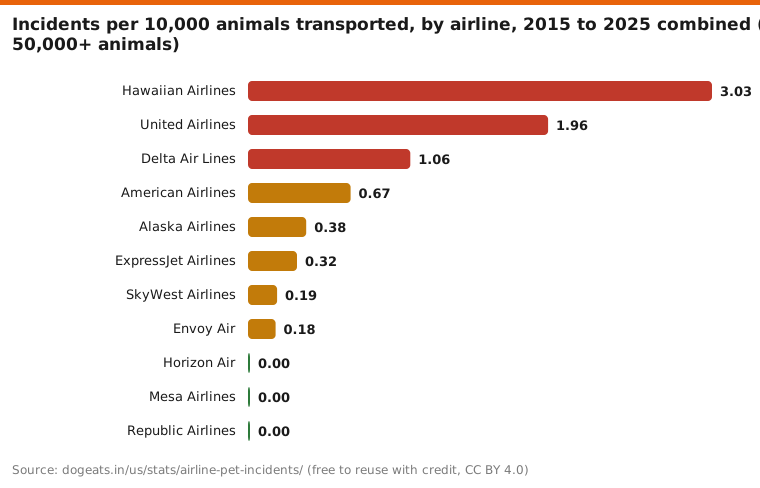
Among airlines that carried at least 50,000 animals from 2015 to 2025, Hawaiian had the highest incident rate at 3.03 per 10,000. United (1.96) and Delta (1.06) came next.
Alaska Airlines carried the most animals by far, 1,071,395 over 11 years, and reported 41 incidents. Its rate of 0.38 per 10,000 is about half the all-airline average of 0.73.
Several regional carriers that fly under larger brands reported no incidents at all. Horizon Air, part of Alaska Air Group, carried 164,655 animals with zero reported deaths, injuries or losses.
Computed by dogeats.in from DOT annual animal incident tables. Incidents = deaths + injuries + losses. Red = 1 or more per 10,000.
Show the numbers
| Label | per 10,000 |
|---|---|
| Hawaiian Airlines | 3.03 |
| United Airlines | 1.96 |
| Delta Air Lines | 1.06 |
| American Airlines | 0.67 |
| Alaska Airlines | 0.38 |
| ExpressJet Airlines | 0.32 |
| SkyWest Airlines | 0.19 |
| Envoy Air | 0.18 |
| Horizon Air | 0.00 |
| Mesa Airlines | 0.00 |
| Republic Airlines | 0.00 |
Embed this chart
| Airline | Animals transported | Deaths | Injuries | Losses | Incidents | Per 10,000 | Share of all animals (%) | Years reporting animals |
|---|---|---|---|---|---|---|---|---|
| Alaska Airlines | 1,071,395 | 19 | 21 | 1 | 41 | 0.38 | 30.1 | 11 |
| American Airlines | 629,835 | 24 | 16 | 2 | 42 | 0.67 | 17.7 | 11 |
| United Airlines | 449,690 | 46 | 42 | 0 | 88 | 1.96 | 12.7 | 9 |
| Delta Air Lines | 433,366 | 29 | 15 | 2 | 46 | 1.06 | 12.2 | 11 |
| SkyWest Airlines | 268,112 | 3 | 2 | 0 | 5 | 0.19 | 7.5 | 11 |
| Horizon Air | 164,655 | 0 | 0 | 0 | 0 | 0.00 | 4.6 | 11 |
| Hawaiian Airlines | 102,193 | 23 | 7 | 1 | 31 | 3.03 | 2.9 | 11 |
| ExpressJet Airlines | 95,235 | 2 | 1 | 0 | 3 | 0.32 | 2.7 | 5 |
| Republic Airlines | 59,906 | 0 | 0 | 0 | 0 | 0.00 | 1.7 | 11 |
| Envoy Air | 55,268 | 0 | 1 | 0 | 1 | 0.18 | 1.6 | 10 |
| Mesa Airlines | 53,927 | 0 | 0 | 0 | 0 | 0.00 | 1.5 | 7 |
| PSA Airlines | 40,752 | 0 | 0 | 0 | 0 | 0.00 | 1.1 | 7 |
| Endeavor Air | 32,226 | 1 | 0 | 0 | 1 | 0.31 | 0.9 | 11 |
| GoJet Airlines | 25,434 | 0 | 0 | 0 | 0 | 0.00 | 0.7 | 6 |
| CommutAir | 19,643 | 0 | 0 | 0 | 0 | 0.00 | 0.6 | 4 |
| Compass Airlines | 13,410 | 0 | 0 | 0 | 0 | 0.00 | 0.4 | 5 |
| Sun Country Airlines | 12,255 | 0 | 0 | 0 | 0 | 0.00 | 0.3 | 4 |
| Avelo Airlines | 11,009 | 0 | 0 | 0 | 0 | 0.00 | 0.3 | 2 |
| Shuttle America | 10,866 | 0 | 0 | 0 | 0 | 0.00 | 0.3 | 3 |
| Silver Airways | 3,308 | 0 | 0 | 0 | 0 | 0.00 | 0.1 | 3 |
| Island Air | 990 | 0 | 0 | 0 | 0 | 0.00 | 0.0 | 2 |
| Eastern Airlines | 251 | 0 | 0 | 0 | 0 | 0.00 | 0.0 | 2 |
United reported 46 deaths and 42 injuries over the period, the most of any carrier. 77 of its 88 incidents came in 2015 to 2017, when it was also flying more than 97,000 animals a year.
Year by year, airline by airline
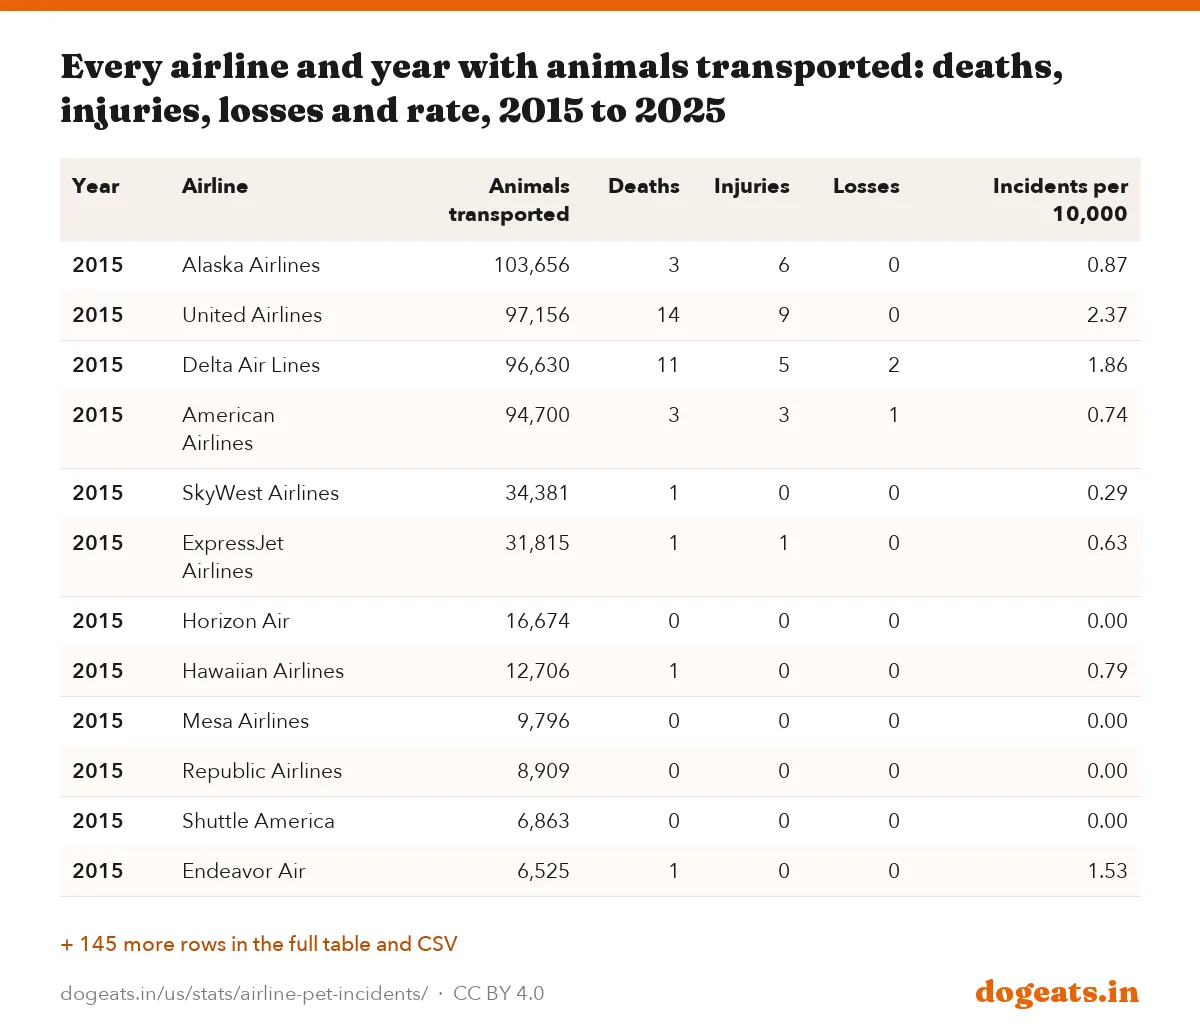
The highest single-year rate for any airline carrying more than 1,000 animals came from Hawaiian in 2022: 6 deaths, 1 injury and 1 loss among 5,781 animals. That works out to 13.84 per 10,000.
Small denominators produce extreme rates. United's single death in 2025 came among only 301 animals, which DOT lists as 33.22 per 10,000. Delta's one injury among 2,896 animals gave it 3.45.
Delta's count swings widely. It carried 41,352 animals in 2024 and 2,896 in 2025, according to DOT's tables.
| Year | Alaska Airlines | American Airlines | Delta Air Lines | United Airlines | Hawaiian Airlines |
|---|---|---|---|---|---|
| 2015 | 103,656 | 94,700 | 96,630 | 97,156 | 12,706 |
| 2016 | 112,281 | 80,888 | 81,070 | 109,149 | 7,518 |
| 2017 | 114,974 | 34,628 | 57,479 | 138,178 | 7,510 |
| 2018 | 143,634 | 61,040 | 75,611 | 44,432 | 9,505 |
| 2019 | 149,303 | 53,646 | 41,965 | 49,587 | 9,365 |
| 2020 | 107,042 | 80,817 | 18,934 | 10,152 | 9,302 |
| 2021 | 77,337 | 100,583 | 7,844 | 0 | 8,475 |
| 2022 | 69,873 | 63,277 | 5,493 | 0 | 5,781 |
| 2023 | 64,877 | 22,265 | 4,092 | 327 | 10,929 |
| 2024 | 64,201 | 17,858 | 41,352 | 408 | 10,178 |
| 2025 | 64,217 | 20,133 | 2,896 | 301 | 10,924 |
| Year | Airline | Animals transported | Deaths | Injuries | Losses | Incidents per 10,000 |
|---|---|---|---|---|---|---|
| 2015 | Alaska Airlines | 103,656 | 3 | 6 | 0 | 0.87 |
| 2015 | United Airlines | 97,156 | 14 | 9 | 0 | 2.37 |
| 2015 | Delta Air Lines | 96,630 | 11 | 5 | 2 | 1.86 |
| 2015 | American Airlines | 94,700 | 3 | 3 | 1 | 0.74 |
| 2015 | SkyWest Airlines | 34,381 | 1 | 0 | 0 | 0.29 |
| 2015 | ExpressJet Airlines | 31,815 | 1 | 1 | 0 | 0.63 |
| 2015 | Horizon Air | 16,674 | 0 | 0 | 0 | 0.00 |
| 2015 | Hawaiian Airlines | 12,706 | 1 | 0 | 0 | 0.79 |
| 2015 | Mesa Airlines | 9,796 | 0 | 0 | 0 | 0.00 |
| 2015 | Republic Airlines | 8,909 | 0 | 0 | 0 | 0.00 |
| 2015 | Shuttle America | 6,863 | 0 | 0 | 0 | 0.00 |
| 2015 | Endeavor Air | 6,525 | 1 | 0 | 0 | 1.53 |
| 2015 | Sun Country Airlines | 5,283 | 0 | 0 | 0 | 0.00 |
| 2015 | GoJet Airlines | 4,156 | 0 | 0 | 0 | 0.00 |
| 2015 | Compass Airlines | 3,130 | 0 | 0 | 0 | 0.00 |
| 2015 | Envoy Air | 1,673 | 0 | 1 | 0 | 5.98 |
| 2015 | Island Air | 484 | 0 | 0 | 0 | 0.00 |
| 2016 | Alaska Airlines | 112,281 | 2 | 1 | 0 | 0.27 |
| 2016 | United Airlines | 109,149 | 9 | 14 | 0 | 2.11 |
| 2016 | Delta Air Lines | 81,070 | 5 | 5 | 0 | 1.23 |
| 2016 | American Airlines | 80,888 | 4 | 1 | 0 | 0.62 |
| 2016 | SkyWest Airlines | 42,839 | 2 | 1 | 0 | 0.70 |
| 2016 | ExpressJet Airlines | 28,598 | 1 | 0 | 0 | 0.35 |
| 2016 | Horizon Air | 16,159 | 0 | 0 | 0 | 0.00 |
| 2016 | Mesa Airlines | 10,795 | 0 | 0 | 0 | 0.00 |
| 2016 | Hawaiian Airlines | 7,518 | 3 | 0 | 0 | 3.99 |
| 2016 | Republic Airlines | 6,841 | 0 | 0 | 0 | 0.00 |
| 2016 | Sun Country Airlines | 6,598 | 0 | 0 | 0 | 0.00 |
| 2016 | Endeavor Air | 5,964 | 0 | 0 | 0 | 0.00 |
| 2016 | GoJet Airlines | 5,730 | 0 | 0 | 0 | 0.00 |
| 2016 | Shuttle America | 3,942 | 0 | 0 | 0 | 0.00 |
| 2016 | Compass Airlines | 2,627 | 0 | 0 | 0 | 0.00 |
| 2016 | Envoy Air | 2,238 | 0 | 0 | 0 | 0.00 |
| 2016 | Island Air | 506 | 0 | 0 | 0 | 0.00 |
| 2017 | United Airlines | 138,178 | 18 | 13 | 0 | 2.24 |
| 2017 | Alaska Airlines | 114,974 | 2 | 0 | 1 | 0.26 |
| 2017 | Delta Air Lines | 57,479 | 2 | 1 | 0 | 0.52 |
| 2017 | SkyWest Airlines | 46,392 | 0 | 0 | 0 | 0.00 |
| 2017 | American Airlines | 34,628 | 2 | 1 | 0 | 0.87 |
| 2017 | ExpressJet Airlines | 23,256 | 0 | 0 | 0 | 0.00 |
| 2017 | Horizon Air | 17,289 | 0 | 0 | 0 | 0.00 |
| 2017 | CommutAir | 16,893 | 0 | 0 | 0 | 0.00 |
| 2017 | Republic Airlines | 14,872 | 0 | 0 | 0 | 0.00 |
| 2017 | Mesa Airlines | 13,669 | 0 | 0 | 0 | 0.00 |
| 2017 | GoJet Airlines | 8,014 | 0 | 0 | 0 | 0.00 |
| 2017 | Hawaiian Airlines | 7,510 | 0 | 0 | 0 | 0.00 |
| 2017 | Envoy Air | 6,470 | 0 | 0 | 0 | 0.00 |
| 2017 | Endeavor Air | 4,951 | 0 | 0 | 0 | 0.00 |
| 2017 | Compass Airlines | 2,054 | 0 | 0 | 0 | 0.00 |
| 2017 | Sun Country Airlines | 304 | 0 | 0 | 0 | 0.00 |
| 2017 | Shuttle America | 61 | 0 | 0 | 0 | 0.00 |
| 2018 | Alaska Airlines | 143,634 | 0 | 1 | 0 | 0.07 |
| 2018 | Delta Air Lines | 75,611 | 4 | 3 | 0 | 0.93 |
| 2018 | American Airlines | 61,040 | 1 | 1 | 0 | 0.33 |
| 2018 | United Airlines | 44,432 | 2 | 1 | 0 | 0.68 |
| 2018 | SkyWest Airlines | 32,515 | 0 | 1 | 0 | 0.31 |
| 2018 | Horizon Air | 17,479 | 0 | 0 | 0 | 0.00 |
| 2018 | Hawaiian Airlines | 9,505 | 3 | 0 | 0 | 3.16 |
| 2018 | Republic Airlines | 8,429 | 0 | 0 | 0 | 0.00 |
| 2018 | Endeavor Air | 7,913 | 0 | 0 | 0 | 0.00 |
| 2018 | Mesa Airlines | 7,320 | 0 | 0 | 0 | 0.00 |
| 2018 | ExpressJet Airlines | 6,791 | 0 | 0 | 0 | 0.00 |
| 2018 | GoJet Airlines | 3,976 | 0 | 0 | 0 | 0.00 |
| 2018 | Compass Airlines | 3,619 | 0 | 0 | 0 | 0.00 |
| 2018 | CommutAir | 1,160 | 0 | 0 | 0 | 0.00 |
| 2018 | Envoy Air | 1,127 | 0 | 0 | 0 | 0.00 |
| 2018 | Sun Country Airlines | 70 | 0 | 0 | 0 | 0.00 |
| 2019 | Alaska Airlines | 149,303 | 1 | 1 | 0 | 0.13 |
| 2019 | American Airlines | 53,646 | 4 | 2 | 0 | 1.12 |
| 2019 | United Airlines | 49,587 | 1 | 5 | 0 | 1.21 |
| 2019 | Delta Air Lines | 41,965 | 3 | 0 | 0 | 0.71 |
| 2019 | SkyWest Airlines | 29,568 | 0 | 0 | 0 | 0.00 |
| 2019 | Horizon Air | 25,788 | 0 | 0 | 0 | 0.00 |
| 2019 | Envoy Air | 11,219 | 0 | 0 | 0 | 0.00 |
| 2019 | Hawaiian Airlines | 9,365 | 2 | 0 | 0 | 2.14 |
| 2019 | Republic Airlines | 8,272 | 0 | 0 | 0 | 0.00 |
| 2019 | Mesa Airlines | 6,731 | 0 | 0 | 0 | 0.00 |
| 2019 | ExpressJet Airlines | 4,775 | 0 | 0 | 0 | 0.00 |
| 2019 | Endeavor Air | 4,475 | 0 | 0 | 0 | 0.00 |
| 2019 | PSA Airlines | 3,583 | 0 | 0 | 0 | 0.00 |
| 2019 | GoJet Airlines | 2,941 | 0 | 0 | 0 | 0.00 |
| 2019 | Compass Airlines | 1,980 | 0 | 0 | 0 | 0.00 |
| 2019 | CommutAir | 1,358 | 0 | 0 | 0 | 0.00 |
| 2020 | Alaska Airlines | 107,042 | 0 | 0 | 0 | 0.00 |
| 2020 | American Airlines | 80,817 | 2 | 3 | 0 | 0.62 |
| 2020 | Horizon Air | 38,813 | 0 | 0 | 0 | 0.00 |
| 2020 | Delta Air Lines | 18,934 | 2 | 0 | 0 | 1.06 |
| 2020 | SkyWest Airlines | 16,805 | 0 | 0 | 0 | 0.00 |
| 2020 | Envoy Air | 13,885 | 0 | 0 | 0 | 0.00 |
| 2020 | United Airlines | 10,152 | 1 | 0 | 0 | 0.99 |
| 2020 | Hawaiian Airlines | 9,302 | 1 | 1 | 0 | 2.15 |
| 2020 | Republic Airlines | 4,829 | 0 | 0 | 0 | 0.00 |
| 2020 | PSA Airlines | 4,748 | 0 | 0 | 0 | 0.00 |
| 2020 | Mesa Airlines | 3,101 | 0 | 0 | 0 | 0.00 |
| 2020 | Endeavor Air | 1,872 | 0 | 0 | 0 | 0.00 |
| 2020 | GoJet Airlines | 617 | 0 | 0 | 0 | 0.00 |
| 2020 | CommutAir | 232 | 0 | 0 | 0 | 0.00 |
| 2021 | American Airlines | 100,583 | 3 | 3 | 0 | 0.60 |
| 2021 | Alaska Airlines | 77,337 | 3 | 7 | 0 | 1.29 |
| 2021 | PSA Airlines | 27,020 | 0 | 0 | 0 | 0.00 |
| 2021 | SkyWest Airlines | 9,113 | 0 | 0 | 0 | 0.00 |
| 2021 | Envoy Air | 8,710 | 0 | 0 | 0 | 0.00 |
| 2021 | Hawaiian Airlines | 8,475 | 1 | 4 | 0 | 5.90 |
| 2021 | Delta Air Lines | 7,844 | 0 | 0 | 0 | 0.00 |
| 2021 | Horizon Air | 7,792 | 0 | 0 | 0 | 0.00 |
| 2021 | Republic Airlines | 3,898 | 0 | 0 | 0 | 0.00 |
| 2021 | Mesa Airlines | 2,515 | 0 | 0 | 0 | 0.00 |
| 2021 | Avelo Airlines | 2,177 | 0 | 0 | 0 | 0.00 |
| 2021 | Silver Airways | 383 | 0 | 0 | 0 | 0.00 |
| 2021 | Endeavor Air | 267 | 0 | 0 | 0 | 0.00 |
| 2022 | Alaska Airlines | 69,873 | 0 | 0 | 0 | 0.00 |
| 2022 | American Airlines | 63,277 | 1 | 0 | 0 | 0.16 |
| 2022 | SkyWest Airlines | 29,081 | 0 | 0 | 0 | 0.00 |
| 2022 | Avelo Airlines | 8,832 | 0 | 0 | 0 | 0.00 |
| 2022 | Hawaiian Airlines | 5,781 | 6 | 1 | 1 | 13.84 |
| 2022 | Delta Air Lines | 5,493 | 0 | 0 | 0 | 0.00 |
| 2022 | Horizon Air | 5,387 | 0 | 0 | 0 | 0.00 |
| 2022 | Republic Airlines | 155 | 0 | 0 | 0 | 0.00 |
| 2022 | PSA Airlines | 128 | 0 | 0 | 0 | 0.00 |
| 2022 | Eastern Airlines | 114 | 0 | 0 | 0 | 0.00 |
| 2022 | Endeavor Air | 102 | 0 | 0 | 0 | 0.00 |
| 2023 | Alaska Airlines | 64,877 | 3 | 1 | 0 | 0.62 |
| 2023 | American Airlines | 22,265 | 2 | 0 | 0 | 0.90 |
| 2023 | Hawaiian Airlines | 10,929 | 3 | 0 | 0 | 2.74 |
| 2023 | SkyWest Airlines | 7,855 | 0 | 0 | 0 | 0.00 |
| 2023 | Horizon Air | 5,525 | 0 | 0 | 0 | 0.00 |
| 2023 | Delta Air Lines | 4,092 | 0 | 0 | 0 | 0.00 |
| 2023 | Envoy Air | 3,385 | 0 | 0 | 0 | 0.00 |
| 2023 | PSA Airlines | 2,042 | 0 | 0 | 0 | 0.00 |
| 2023 | Republic Airlines | 1,637 | 0 | 0 | 0 | 0.00 |
| 2023 | Silver Airways | 1,461 | 0 | 0 | 0 | 0.00 |
| 2023 | United Airlines | 327 | 0 | 0 | 0 | 0.00 |
| 2023 | Eastern Airlines | 137 | 0 | 0 | 0 | 0.00 |
| 2023 | Endeavor Air | 61 | 0 | 0 | 0 | 0.00 |
| 2024 | Alaska Airlines | 64,201 | 3 | 3 | 0 | 0.93 |
| 2024 | Delta Air Lines | 41,352 | 2 | 0 | 0 | 0.48 |
| 2024 | American Airlines | 17,858 | 2 | 0 | 0 | 1.12 |
| 2024 | SkyWest Airlines | 12,082 | 0 | 0 | 0 | 0.00 |
| 2024 | Hawaiian Airlines | 10,178 | 3 | 0 | 0 | 2.95 |
| 2024 | Horizon Air | 7,272 | 0 | 0 | 0 | 0.00 |
| 2024 | Envoy Air | 3,679 | 0 | 0 | 0 | 0.00 |
| 2024 | PSA Airlines | 1,755 | 0 | 0 | 0 | 0.00 |
| 2024 | Silver Airways | 1,464 | 0 | 0 | 0 | 0.00 |
| 2024 | Republic Airlines | 1,053 | 0 | 0 | 0 | 0.00 |
| 2024 | United Airlines | 408 | 0 | 0 | 0 | 0.00 |
| 2024 | Endeavor Air | 33 | 0 | 0 | 0 | 0.00 |
| 2025 | Alaska Airlines | 64,217 | 2 | 1 | 0 | 0.47 |
| 2025 | American Airlines | 20,133 | 0 | 2 | 1 | 1.49 |
| 2025 | Hawaiian Airlines | 10,924 | 0 | 1 | 0 | 0.92 |
| 2025 | SkyWest Airlines | 7,481 | 0 | 0 | 0 | 0.00 |
| 2025 | Horizon Air | 6,477 | 0 | 0 | 0 | 0.00 |
| 2025 | Delta Air Lines | 2,896 | 0 | 1 | 0 | 3.45 |
| 2025 | Envoy Air | 2,882 | 0 | 0 | 0 | 0.00 |
| 2025 | PSA Airlines | 1,476 | 0 | 0 | 0 | 0.00 |
| 2025 | Republic Airlines | 1,011 | 0 | 0 | 0 | 0.00 |
| 2025 | United Airlines | 301 | 1 | 0 | 0 | 33.22 |
| 2025 | Endeavor Air | 63 | 0 | 0 | 0 | 0.00 |
Airline names follow DOT's tables. Republic Airways and Republic Airlines are the same carrier, as are SkyWest and Sky West; we merged the spellings. Alaska Airlines figures include Virgin America from April 2018, as DOT notes.
What DOT's animal incident data covers
DOT's reporting rule took effect on January 1, 2015. It applies to US airlines that fly scheduled passenger service with at least one aircraft of more than 60 seats.
The rule counts any animal kept as a pet in a US household, plus any dog or cat shipped commercially, for example by a breeder. Each covered airline must file a December report with its yearly totals, even if it had no incidents.
The key limit is custody. The rule covers the period when the airline has taken the animal, from check-in to hand-back. It does not include animals that ride at a passenger's seat in the cabin.
- Counted: checked pets, pets shipped as cargo, and dogs and cats shipped by breeders or trainers on scheduled passenger flights.
- Not counted: small pets in carriers under the seat, service dogs in the cabin, and emotional support animals that flew in the cabin.
- Not covered: cargo-only airlines, foreign airlines, and US airlines whose largest plane has 60 seats or fewer.
- Reported: deaths, injuries and losses during air transport, plus the yearly number of animals transported.
The monthly Air Travel Consumer Report also lists each incident report, with personal details removed. DOT forwards these reports to the US Department of Agriculture, which enforces the Animal Welfare Act.
The annual tables changed format slightly over time. From the 2020 annual table onward, DOT dropped the separate total incidents column. We computed totals and rates the same way for every year.
What changed when emotional support animals lost service status
DOT announced a final rule on December 2, 2020, that ended the requirement for airlines to treat emotional support animals as service animals. It was published on December 10, 2020, and took effect on January 11, 2021.
Under the rule, a service animal on a plane is a dog individually trained to do work for a person with a disability. Airlines may treat emotional support animals as pets, which can mean a pet fee and the airline's size limits for cabin pets.
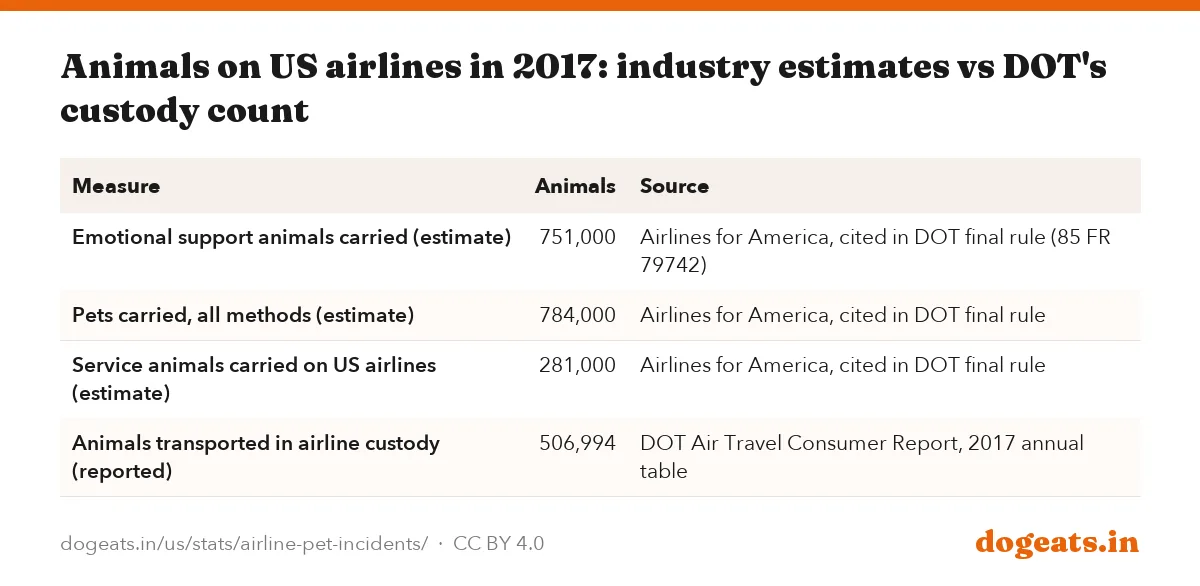
The scale was large. The rule cites an estimate from the trade group Airlines for America: US airlines carried 751,000 emotional support animals in 2017. The same group estimated 784,000 pets that year.
| Measure | Animals | Source |
|---|---|---|
| Emotional support animals carried (estimate) | 751,000 | Airlines for America, cited in DOT final rule (85 FR 79742) |
| Pets carried, all methods (estimate) | 784,000 | Airlines for America, cited in DOT final rule |
| Service animals carried on US airlines (estimate) | 281,000 | Airlines for America, cited in DOT final rule |
| Animals transported in airline custody (reported) | 506,994 | DOT Air Travel Consumer Report, 2017 annual table |
The rule did not change DOT's animal incident reporting, and emotional support animals at a passenger's seat were never in it. If owners of large former support dogs switched to checked travel, the custody count might have risen. It did not: animals transported fell from 311,149 in 2020 to 256,114 in 2021 and 188,223 in 2022.
The industry estimates and DOT's count measure different things, so they cannot be subtracted from each other. Still, on these estimates, support and service animals in the cabin alone outnumbered animals in airline custody about two to one in 2017.
Planning a holiday trip with a dog brings its own risks on the ground too. Our holiday food dangers report covers what dogs get into at Thanksgiving and Christmas. Our cost of owning a dog report breaks down yearly spending.
Frequently asked questions
How many pets die on airlines each year?
US airlines reported 3 animal deaths in 2025, 10 in 2024 and 8 in 2023, according to DOT. The highest count since full reporting began was 35 deaths in 2015. These figures cover only animals in airline custody, not pets in the cabin.
Which airline has the most pet deaths?
From 2015 to 2025, United reported the most animal deaths (46), followed by Delta (29), American (24) and Hawaiian (23). Alaska reported 19 deaths while carrying far more animals than any other airline.
Which airline is safest for pets?
Among the four airlines that carried the most animals from 2015 to 2025, Alaska had the lowest incident rate, 0.38 per 10,000. Several regional airlines reported zero incidents. Past rates do not guarantee future results, and policies change.
How common is it for a pet to die when flying in cargo?
Rare, on DOT's numbers. Airlines reported 147 deaths among 3,553,726 animals in custody from 2015 to 2025, about 0.41 per 10,000. Counting injuries and losses too, the rate was 0.73 per 10,000.
Do the DOT numbers include pets in the cabin?
No. DOT's rule covers animals while they are in the airline's custody, from when they are handed over until they are returned. Pets that travel at a passenger's seat in the cabin are not included.
Did the 2021 emotional support animal rule change these statistics?
Not directly. The rule, effective January 11, 2021, let airlines treat emotional support animals as pets, but those animals mostly flew in the cabin and were never in the custody data. Animals in custody fell from 311,149 in 2020 to 256,114 in 2021.
Which airlines do not fly pets in the hold?
In DOT's 2025 annual table, Allegiant, Avelo, Breeze, Eastern, Frontier, JetBlue, Mesa, Southwest, Spirit and Sun Country reported transporting no animals in custody. Some of them allow small pets in the cabin, which DOT does not count.
How many animals fly on US airlines each year?
In airline custody, 117,861 animals in 2025, down from 534,537 in 2015. Far more fly in the cabin: an airline industry estimate cited by DOT put 2017 totals at 784,000 pets and 751,000 emotional support animals.
Methodology and limitations
We took every annual animal incident table published in DOT's Air Travel Consumer Report from calendar year 2015 to 2025. Each appears in the February issue of the following year; the 2015 and 2016 tables both appear in the February 2017 issue.
We extracted the tables from the PDF files on transportation.gov and checked that each airline's rows add up to DOT's published totals. All 11 years match exactly, and our computed rates match DOT's published rates to two decimals.
Incidents are deaths plus injuries plus losses. Rates are incidents divided by animals transported, times 10,000. Multi-year airline rates pool all incidents and all animals for the years the airline reported transporting animals.
The emotional support animal rule details come from DOT's December 2, 2020, announcement and the final rule in the Federal Register (85 FR 79742). Reporting scope comes from DOT's 2014 final rule on animal incident reports, published July 3, 2014.
Sources
- US DOT, Air Travel Consumer Report, February 2026 (2025 annual animal incident table), 2025 deaths, injuries, losses and animals transported by airline
- US DOT, Final rule: Reports by Air Carriers on Incidents Involving Animals During Air Transport (Federal Register, July 3, 2014), Reporting scope, 60-seat threshold, custody definition, effective January 1, 2015
- US DOT, Traveling by Air With Service Animals, final rule (85 FR 79742, December 10, 2020), ESA rule effective January 11, 2021; A4A estimates of 751,000 ESAs and 784,000 pets in 2017
- Also consulted: US DOT press release, December 2, 2020, US DOT, Air Travel Consumer Report, February 2025 (2024 annual table), US DOT, Air Travel Consumer Report, February 2024, revised March 2025 (2023 annual table), US DOT, Air Travel Consumer Report, February 2023, revised (2022 annual table), US DOT, Air Travel Consumer Report, February 2022 (2021 annual table), US DOT, Air Travel Consumer Report, February 2021 (2020 annual table), US DOT, Air Travel Consumer Report, February 2020 (2019 annual table), US DOT, Air Travel Consumer Report, February 2019, revised (2018 annual table), US DOT, Air Travel Consumer Report, February 2018, revised June 2020 (2017 annual table), US DOT, Air Travel Consumer Report, February 2017 (2016 and 2015 annual tables), Federal Register via GovInfo, full text of 85 FR 79742.
Cite, embed and download
This report, its data and its images are free to reuse under a Creative Commons Attribution 4.0 licence. Credit dogeats.in with a link to this page. Every chart has its own embed code, every table has a CSV and an image download, and the images below are ready for social posts, slides and articles.
Cite this report
Link to this report
Every chart and table as an image