Data report · Updated October 2026
Veterinarians by state: how many vets and vet techs work in each US state, what they earn and how the count has changed
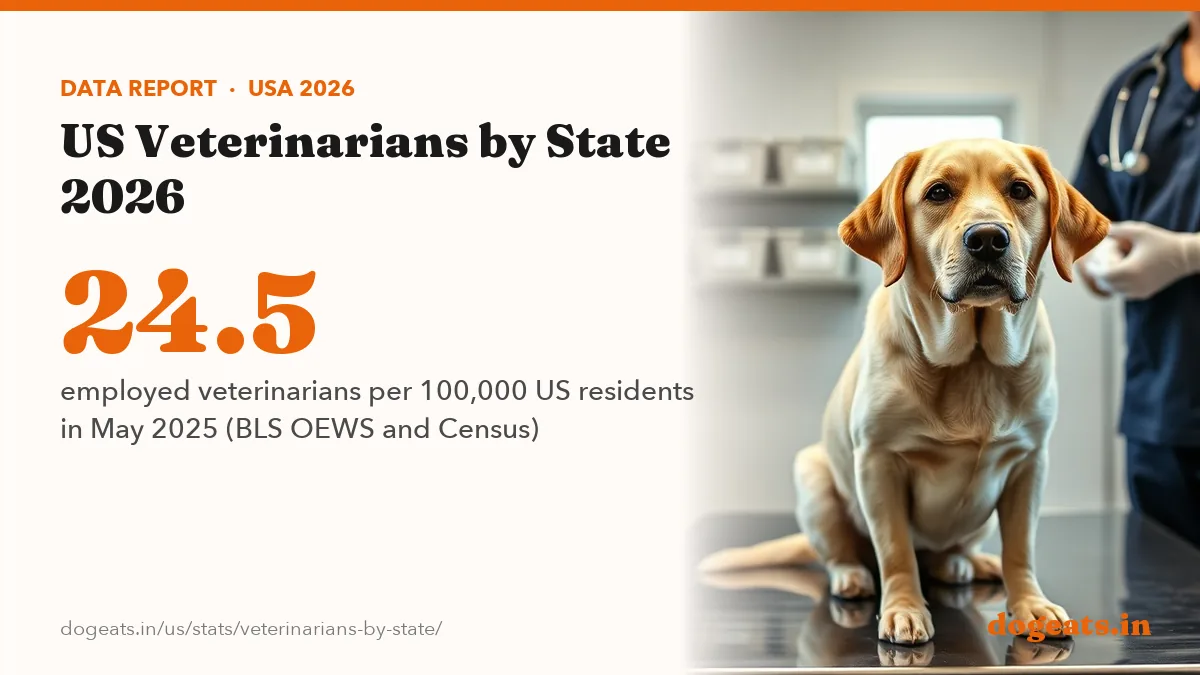
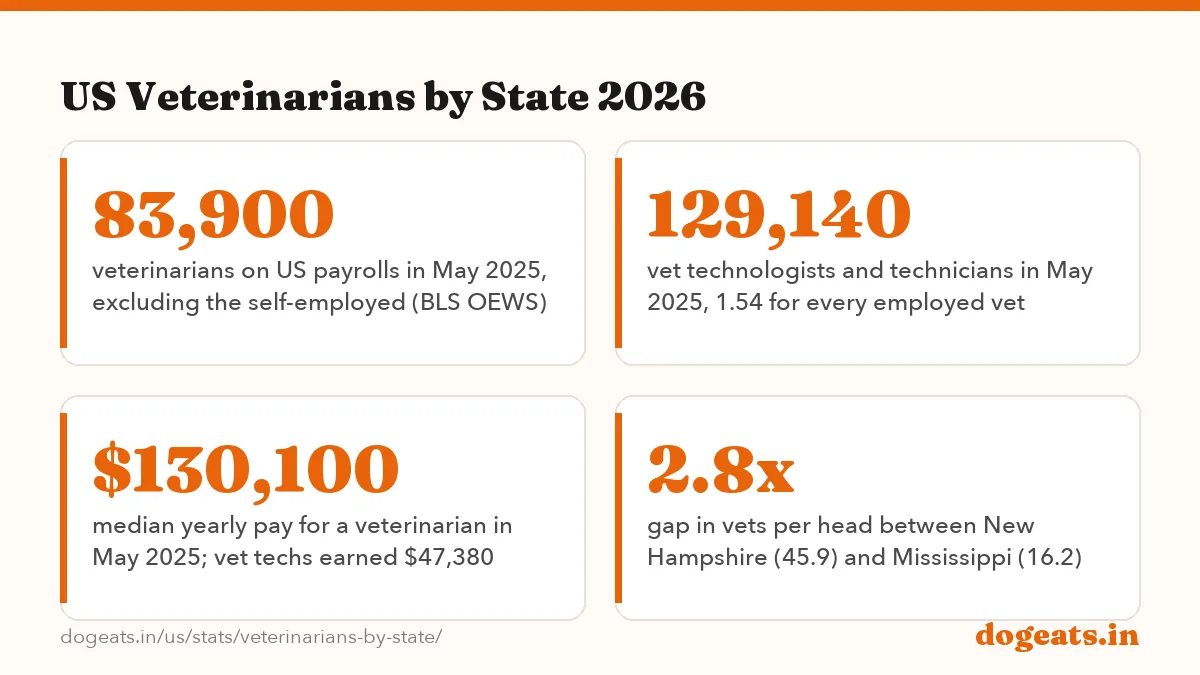
Federal wage data counted 83,900 veterinarians and 129,140 veterinary technologists and technicians on US payrolls in May 2025. That works out to 24.5 vets per 100,000 residents, ranging from 45.9 in New Hampshire to 16.2 in Mississippi. The median vet earned $130,100 a year, up 47% since 2015.

Key findings
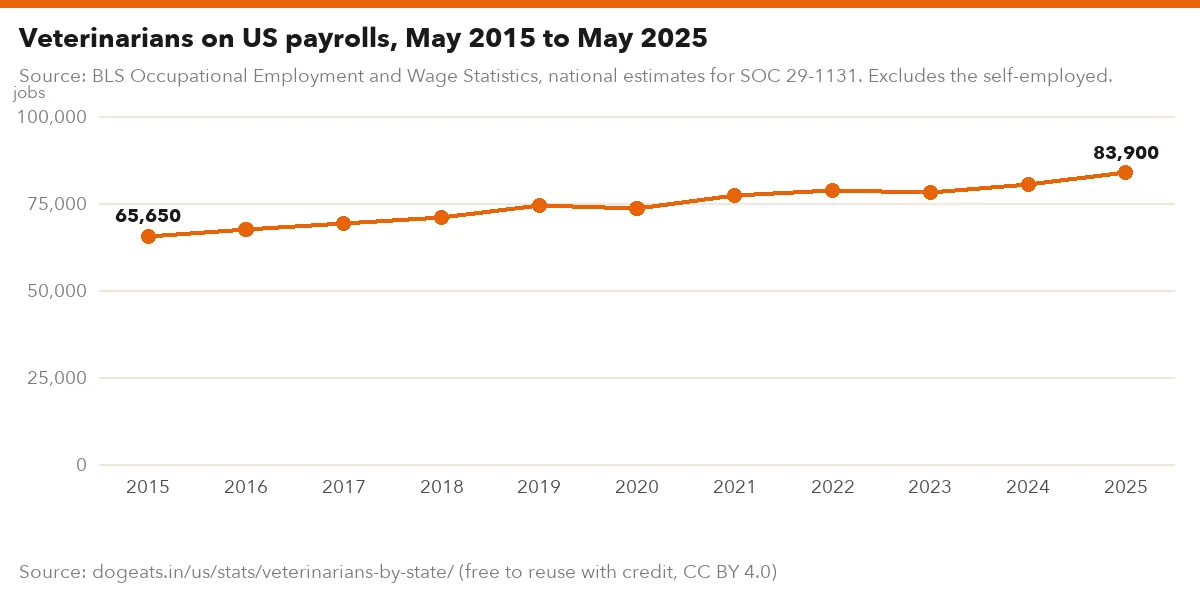
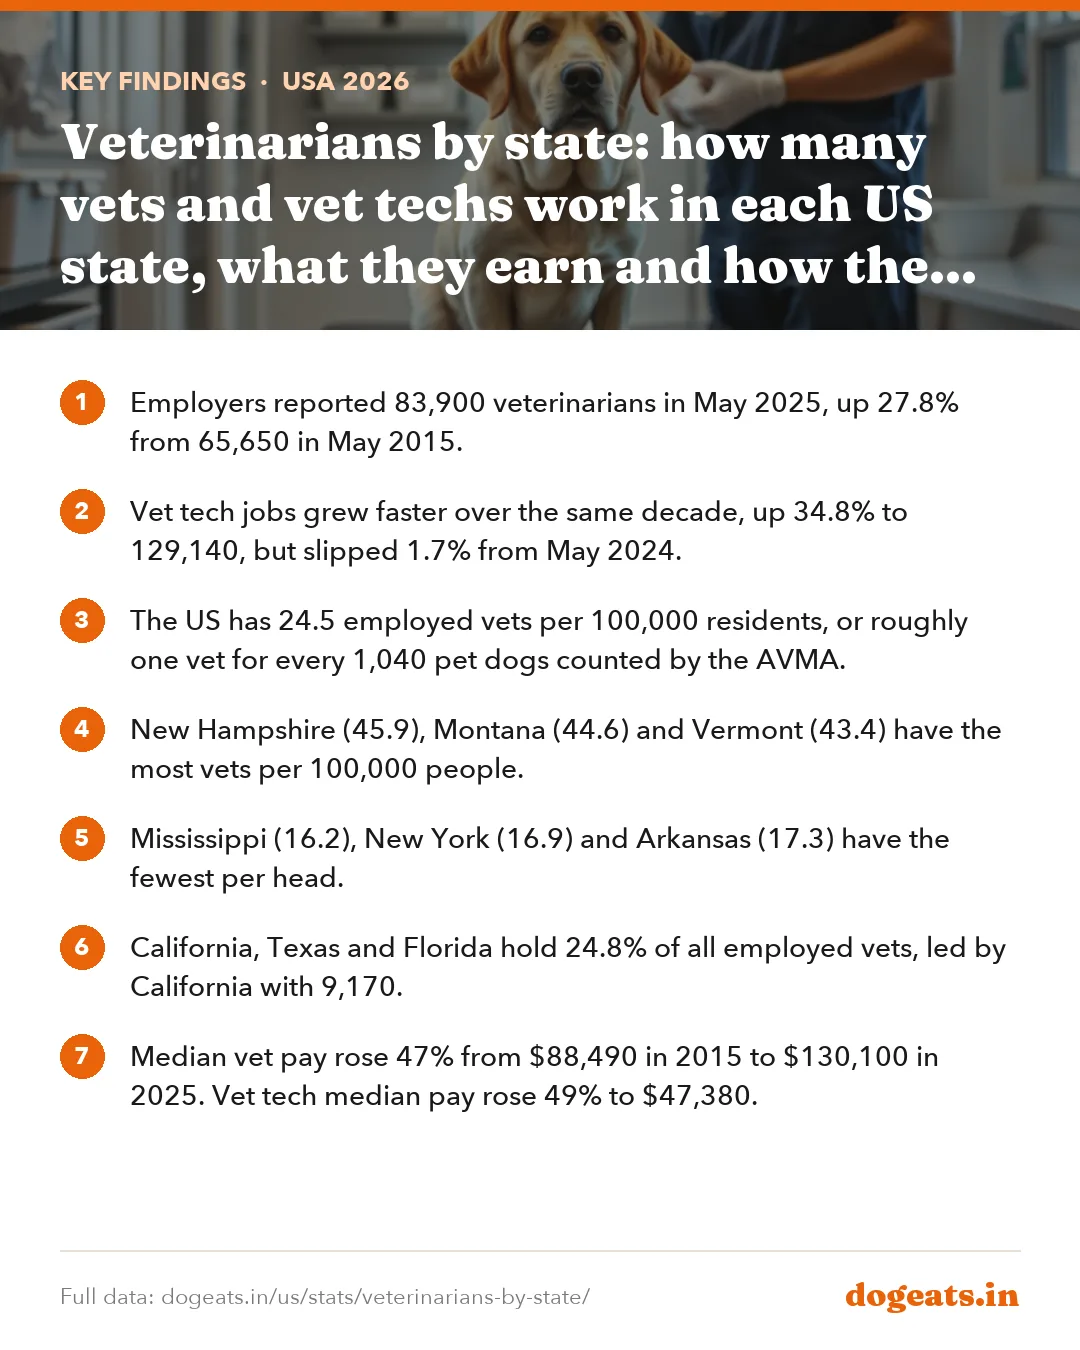
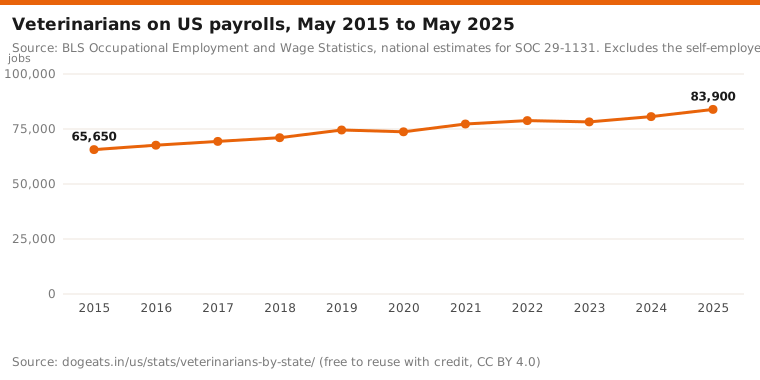
- Employers reported 83,900 veterinarians in May 2025, up 27.8% from 65,650 in May 2015.
- Vet tech jobs grew faster over the same decade, up 34.8% to 129,140, but slipped 1.7% from May 2024.
- The US has 24.5 employed vets per 100,000 residents, or roughly one vet for every 1,040 pet dogs counted by the AVMA.
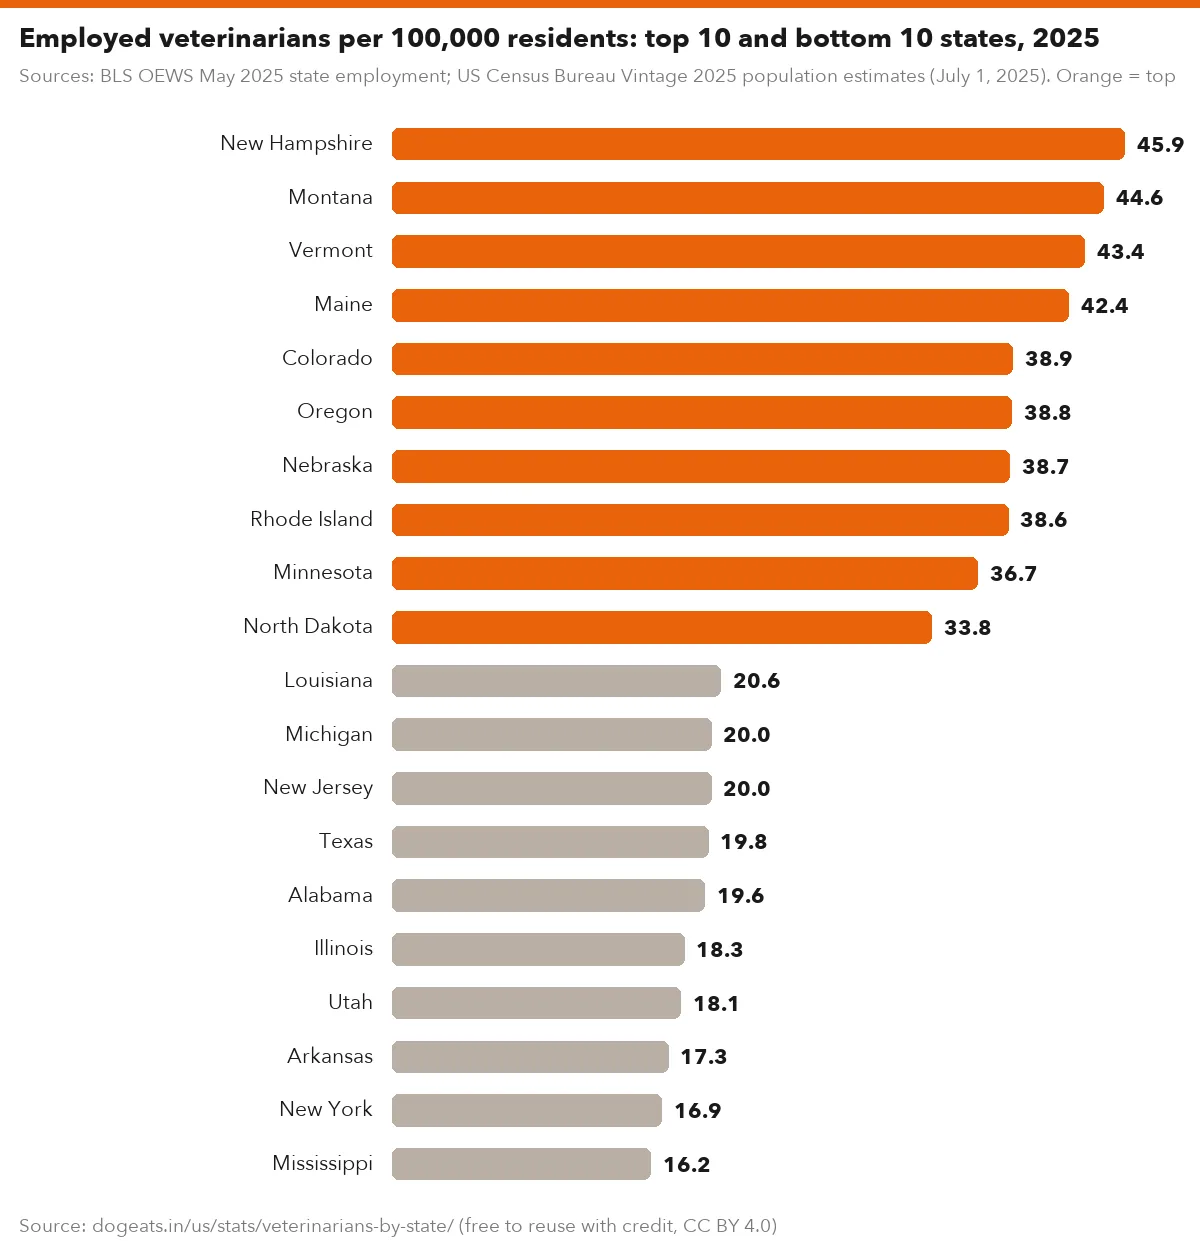
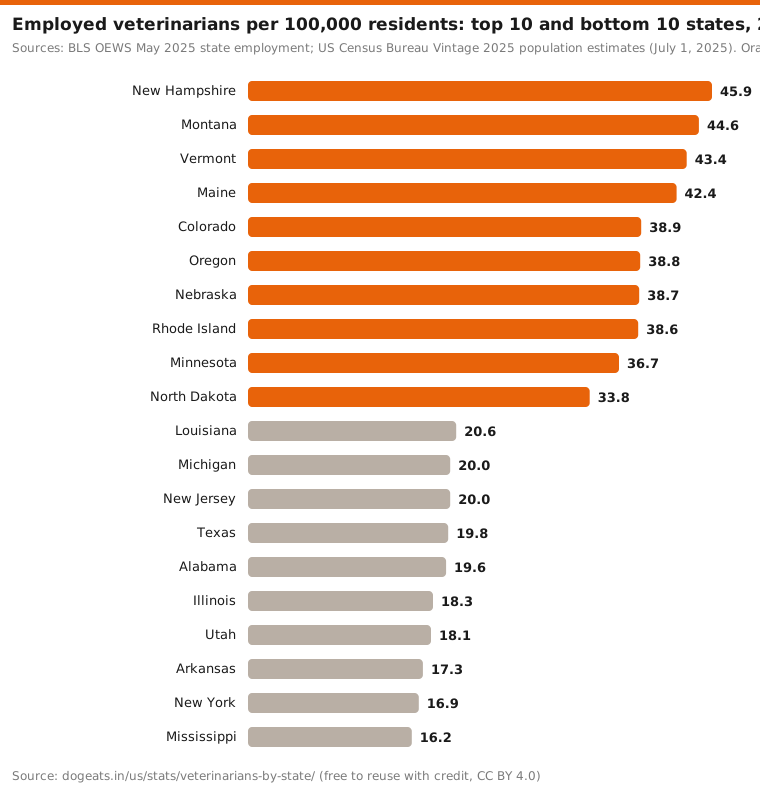
- New Hampshire (45.9), Montana (44.6) and Vermont (43.4) have the most vets per 100,000 people.
- Mississippi (16.2), New York (16.9) and Arkansas (17.3) have the fewest per head.
- California, Texas and Florida hold 24.8% of all employed vets, led by California with 9,170.
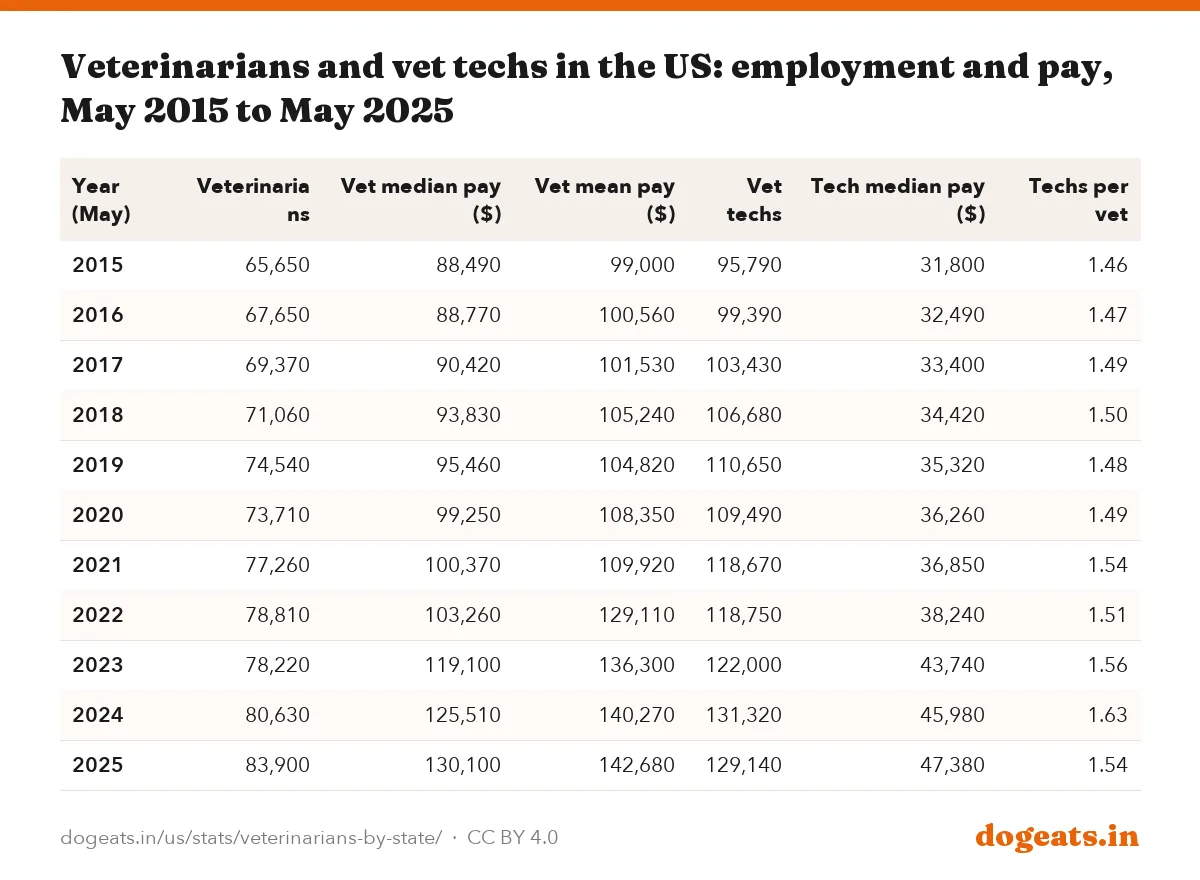
- Median vet pay rose 47% from $88,490 in 2015 to $130,100 in 2025. Vet tech median pay rose 49% to $47,380.
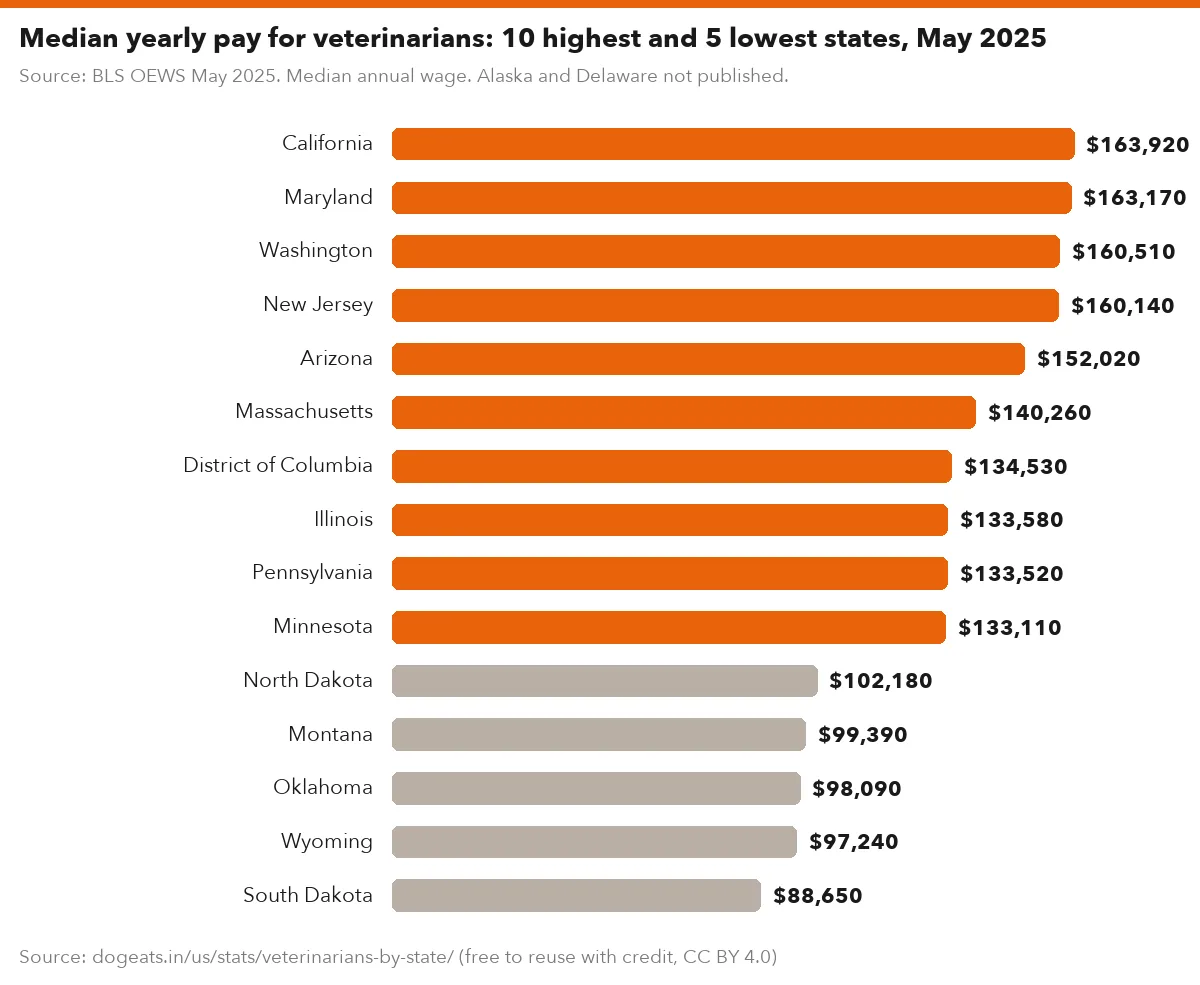
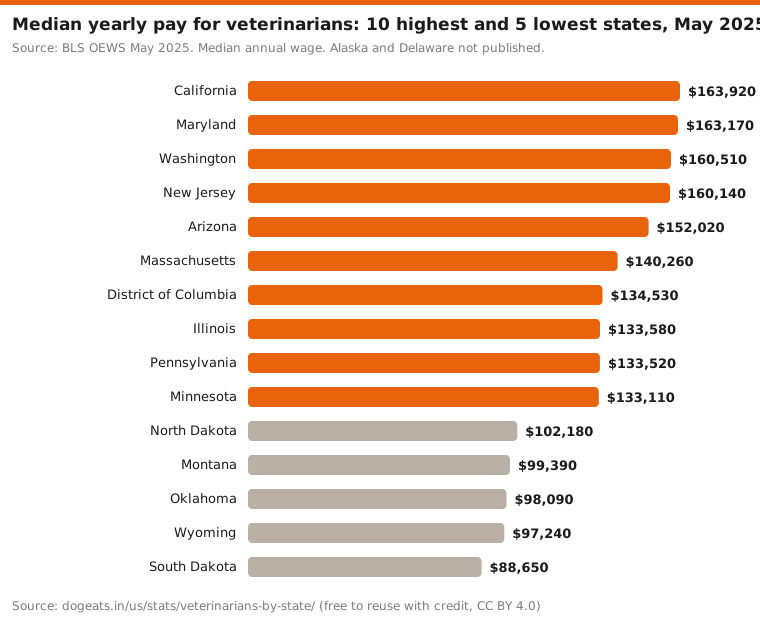
- California pays vets the highest median wage ($163,920); South Dakota pays the lowest ($88,650).
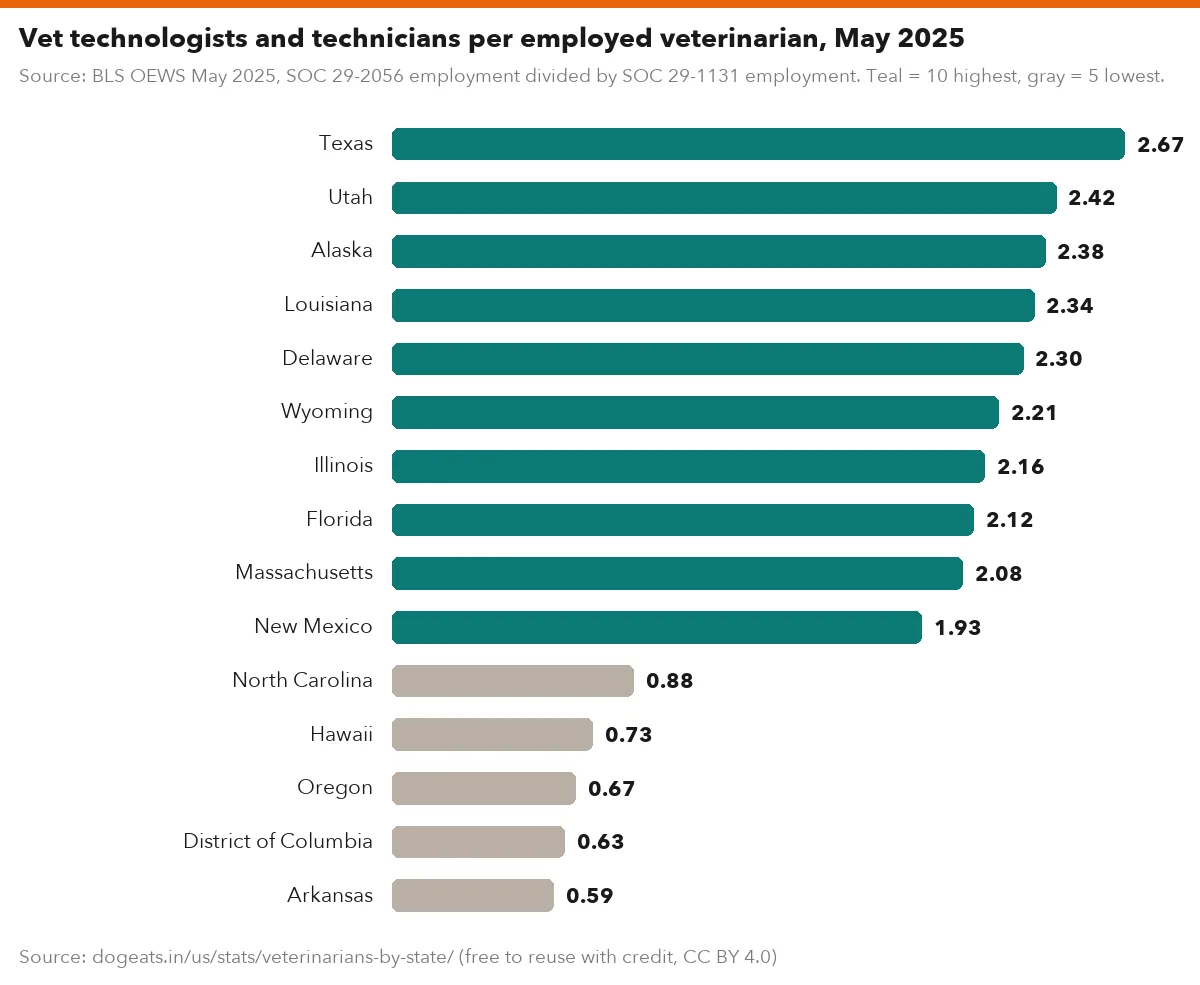
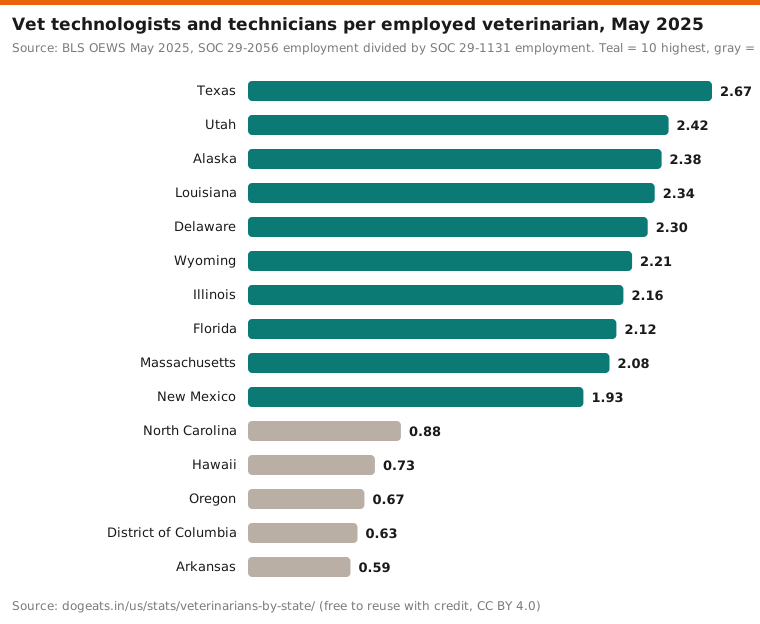
- Texas has 2.67 vet techs for every vet, the highest ratio of any state. Arkansas has 0.59.
- The AVMA counted 133,475 US veterinarians at the end of 2025, a wider count that includes vets outside payroll jobs. Women were 68.8% of them.
How many veterinarians are there in the US?
US employers reported 83,900 veterinarians on their payrolls in May 2025, according to the Bureau of Labor Statistics (BLS) Occupational Employment and Wage Statistics survey. They also employed 129,140 veterinary technologists and technicians.
That payroll count leaves out vets who own their practice and pay themselves. The BLS Employment Projections program, which adds the self-employed, puts veterinarian jobs at 91,100 in 2025. The American Veterinary Medical Association (AVMA) counted 133,475 veterinarians at the end of 2025, including vets outside clinical work. Its 2024 count included 29,501 vets with no employment information.
On the payroll measure, vet jobs grew 27.8% in ten years. The only dip came in 2020, when the count fell from 74,540 to 73,710. The latest year added 3,270 vets, a 4.1% rise.
Source: BLS Occupational Employment and Wage Statistics, national estimates for SOC 29-1131. Excludes the self-employed.
Show the numbers
| Label | jobs |
|---|---|
| 2015 | 65,650 |
| 2016 | 67,650 |
| 2017 | 69,370 |
| 2018 | 71,060 |
| 2019 | 74,540 |
| 2020 | 73,710 |
| 2021 | 77,260 |
| 2022 | 78,810 |
| 2023 | 78,220 |
| 2024 | 80,630 |
| 2025 | 83,900 |
Embed this chart
| Year (May) | Veterinarians | Vet median pay ($) | Vet mean pay ($) | Vet techs | Tech median pay ($) | Techs per vet |
|---|---|---|---|---|---|---|
| 2015 | 65,650 | 88,490 | 99,000 | 95,790 | 31,800 | 1.46 |
| 2016 | 67,650 | 88,770 | 100,560 | 99,390 | 32,490 | 1.47 |
| 2017 | 69,370 | 90,420 | 101,530 | 103,430 | 33,400 | 1.49 |
| 2018 | 71,060 | 93,830 | 105,240 | 106,680 | 34,420 | 1.50 |
| 2019 | 74,540 | 95,460 | 104,820 | 110,650 | 35,320 | 1.48 |
| 2020 | 73,710 | 99,250 | 108,350 | 109,490 | 36,260 | 1.49 |
| 2021 | 77,260 | 100,370 | 109,920 | 118,670 | 36,850 | 1.54 |
| 2022 | 78,810 | 103,260 | 129,110 | 118,750 | 38,240 | 1.51 |
| 2023 | 78,220 | 119,100 | 136,300 | 122,000 | 43,740 | 1.56 |
| 2024 | 80,630 | 125,510 | 140,270 | 131,320 | 45,980 | 1.63 |
| 2025 | 83,900 | 130,100 | 142,680 | 129,140 | 47,380 | 1.54 |
Each year is a separate BLS estimate built from a rolling three-year survey sample. Small year-to-year moves can be sampling noise, so the ten-year direction is more reliable than any single change.
Which states have the most veterinarians per person?
New Hampshire has the most employed veterinarians per head, with 45.9 per 100,000 residents. Montana (44.6), Vermont (43.4) and Maine (42.4) follow. Four New England states make the top 10, along with Montana, Colorado, Oregon and three Plains or Midwest states.
Mississippi has the fewest, at 16.2 per 100,000. New York (16.9) sits near the bottom despite having 3,390 vets, because its population is so large. The national figure is 24.5.
Sources: BLS OEWS May 2025 state employment; US Census Bureau Vintage 2025 population estimates (July 1, 2025). Orange = top 10, gray = bottom 10. Includes DC.
Show the numbers
| Label | per 100,000 |
|---|---|
| New Hampshire | 45.9 |
| Montana | 44.6 |
| Vermont | 43.4 |
| Maine | 42.4 |
| Colorado | 38.9 |
| Oregon | 38.8 |
| Nebraska | 38.7 |
| Rhode Island | 38.6 |
| Minnesota | 36.7 |
| North Dakota | 33.8 |
| Louisiana | 20.6 |
| Michigan | 20.0 |
| New Jersey | 20.0 |
| Texas | 19.8 |
| Alabama | 19.6 |
| Illinois | 18.3 |
| Utah | 18.1 |
| Arkansas | 17.3 |
| New York | 16.9 |
| Mississippi | 16.2 |
Embed this chart
| State | Veterinarians | Vets per 100,000 | Vet location quotient | Vet median pay ($) | Vet mean pay ($) | Vet techs | Techs per 100,000 | Techs per vet | Tech median pay ($) |
|---|---|---|---|---|---|---|---|---|---|
| Alabama | 1,020 | 19.6 | 0.89 | 105,630 | 120,170 | 1,880 | 36.2 | 1.84 | 36,590 |
| Alaska | 160 | 21.7 | 0.90 | n/a | n/a | 380 | 51.5 | 2.38 | 46,480 |
| Arizona | 2,080 | 27.3 | 1.19 | 152,020 | 187,410 | 3,970 | 52.1 | 1.91 | 46,300 |
| Arkansas | 540 | 17.3 | 0.77 | 107,710 | 108,100 | 320 | 10.3 | 0.59 | 38,360 |
| California | 9,170 | 23.3 | 0.93 | 163,920 | 169,860 | 11,310 | 28.7 | 1.23 | 60,630 |
| Colorado | 2,340 | 38.9 | 1.51 | 130,840 | 137,190 | 3,720 | 61.9 | 1.59 | 49,650 |
| Connecticut | 950 | 25.8 | 1.04 | 126,190 | 139,290 | 1,690 | 45.8 | 1.78 | 50,950 |
| Delaware | 230 | 21.7 | 0.89 | n/a | n/a | 530 | 50.0 | 2.30 | 48,370 |
| District of Columbia | 190 | 27.4 | 0.49 | 134,530 | 160,520 | 120 | 17.3 | 0.63 | 61,270 |
| Florida | 5,360 | 22.8 | 1.00 | 131,660 | 139,760 | 11,380 | 48.5 | 2.12 | 46,380 |
| Georgia | 2,670 | 23.6 | 1.01 | 126,590 | 127,920 | 2,410 | 21.3 | 0.90 | 43,060 |
| Hawaii | 370 | 25.8 | 1.10 | 130,120 | 128,820 | 270 | 18.8 | 0.73 | 48,550 |
| Idaho | 540 | 26.6 | 1.18 | 116,170 | 118,000 | 790 | 38.9 | 1.46 | 42,120 |
| Illinois | 2,330 | 18.3 | 0.71 | 133,580 | 153,810 | 5,040 | 39.6 | 2.16 | 46,440 |
| Indiana | 1,500 | 21.5 | 0.87 | 124,530 | 127,060 | 1,820 | 26.1 | 1.21 | 48,720 |
| Iowa | 1,000 | 30.9 | 1.19 | 124,610 | 122,200 | 1,220 | 37.7 | 1.22 | 45,560 |
| Kansas | 1,000 | 33.6 | 1.29 | 107,080 | 117,620 | 1,270 | 42.7 | 1.27 | 45,810 |
| Kentucky | 1,190 | 25.8 | 1.10 | 104,100 | 112,730 | 1,670 | 36.3 | 1.40 | 39,590 |
| Louisiana | 950 | 20.6 | 0.91 | 124,370 | 125,270 | 2,220 | 48.1 | 2.34 | 35,530 |
| Maine | 600 | 42.4 | 1.72 | 130,600 | 136,620 | 910 | 64.3 | 1.52 | 50,810 |
| Maryland | 1,430 | 22.8 | 0.96 | 163,170 | 163,830 | 2,540 | 40.5 | 1.78 | 47,350 |
| Massachusetts | 1,920 | 26.8 | 0.98 | 140,260 | 157,520 | 3,990 | 55.8 | 2.08 | 49,540 |
| Michigan | 2,030 | 20.0 | 0.86 | 125,390 | 128,100 | 2,550 | 25.2 | 1.26 | 49,710 |
| Minnesota | 2,140 | 36.7 | 1.34 | 133,110 | 146,230 | 3,560 | 61.1 | 1.66 | 57,270 |
| Mississippi | 480 | 16.2 | 0.76 | 105,370 | 114,370 | 650 | 22.0 | 1.35 | 36,380 |
| Missouri | 1,920 | 30.6 | 1.21 | 114,660 | 125,720 | 2,040 | 32.5 | 1.06 | 43,520 |
| Montana | 510 | 44.6 | 1.84 | 99,390 | 112,730 | 480 | 41.9 | 0.94 | 41,170 |
| Nebraska | 780 | 38.7 | 1.41 | 103,500 | 123,810 | 690 | 34.2 | 0.88 | 43,680 |
| Nevada | 680 | 20.7 | 0.82 | 125,550 | 140,600 | 1,120 | 34.1 | 1.65 | 50,250 |
| New Hampshire | 650 | 45.9 | 1.75 | 128,190 | 144,960 | 870 | 61.5 | 1.34 | 48,780 |
| New Jersey | 1,910 | 20.0 | 0.82 | 160,140 | 166,170 | 2,910 | 30.5 | 1.52 | 49,050 |
| New Mexico | 460 | 21.6 | 0.99 | 129,390 | 138,880 | 890 | 41.9 | 1.93 | 44,790 |
| New York | 3,390 | 16.9 | 0.65 | 131,830 | 151,530 | 5,350 | 26.7 | 1.58 | 59,010 |
| North Carolina | 2,940 | 26.3 | 1.10 | 129,240 | 136,200 | 2,580 | 23.0 | 0.88 | 47,620 |
| North Dakota | 270 | 33.8 | 1.17 | 102,180 | 108,300 | 340 | 42.5 | 1.26 | 48,790 |
| Ohio | 3,430 | 28.8 | 1.15 | 125,060 | 129,890 | 4,790 | 40.3 | 1.40 | 47,990 |
| Oklahoma | 1,150 | 27.9 | 1.25 | 98,090 | 123,820 | 1,060 | 25.7 | 0.92 | 39,100 |
| Oregon | 1,660 | 38.8 | 1.57 | 128,880 | 133,560 | 1,120 | 26.2 | 0.67 | 55,810 |
| Pennsylvania | 3,490 | 26.7 | 1.07 | 133,520 | 154,440 | 6,620 | 50.7 | 1.90 | 46,430 |
| Rhode Island | 430 | 38.6 | 1.60 | 126,570 | 133,850 | 530 | 47.6 | 1.23 | 45,310 |
| South Carolina | 1,380 | 24.8 | 1.11 | 122,130 | 126,280 | 2,540 | 45.6 | 1.84 | 39,020 |
| South Dakota | 280 | 29.9 | 1.13 | 88,650 | 93,990 | 300 | 32.1 | 1.07 | 45,300 |
| Tennessee | 1,730 | 23.6 | 0.98 | 124,350 | 129,660 | 1,640 | 22.4 | 0.95 | 42,810 |
| Texas | 6,270 | 19.8 | 0.83 | 131,330 | 138,150 | 16,730 | 52.8 | 2.67 | 39,410 |
| Utah | 640 | 18.1 | 0.69 | 123,990 | 139,770 | 1,550 | 43.8 | 2.42 | 40,560 |
| Vermont | 280 | 43.4 | 1.74 | 131,820 | 145,030 | 390 | 60.5 | 1.39 | 49,490 |
| Virginia | 2,700 | 30.4 | 1.22 | 126,730 | 143,080 | 2,790 | 31.4 | 1.03 | 52,090 |
| Washington | 2,390 | 29.9 | 1.25 | 160,510 | 163,010 | 2,290 | 28.6 | 0.96 | 59,740 |
| West Virginia | 390 | 22.1 | 1.03 | 128,990 | 127,520 | 400 | 22.6 | 1.03 | 37,700 |
| Wisconsin | 1,830 | 30.6 | 1.15 | 108,780 | 118,890 | 2,590 | 43.4 | 1.42 | 47,020 |
| Wyoming | 140 | 23.8 | 0.91 | 97,240 | 105,200 | 310 | 52.7 | 2.21 | 38,650 |
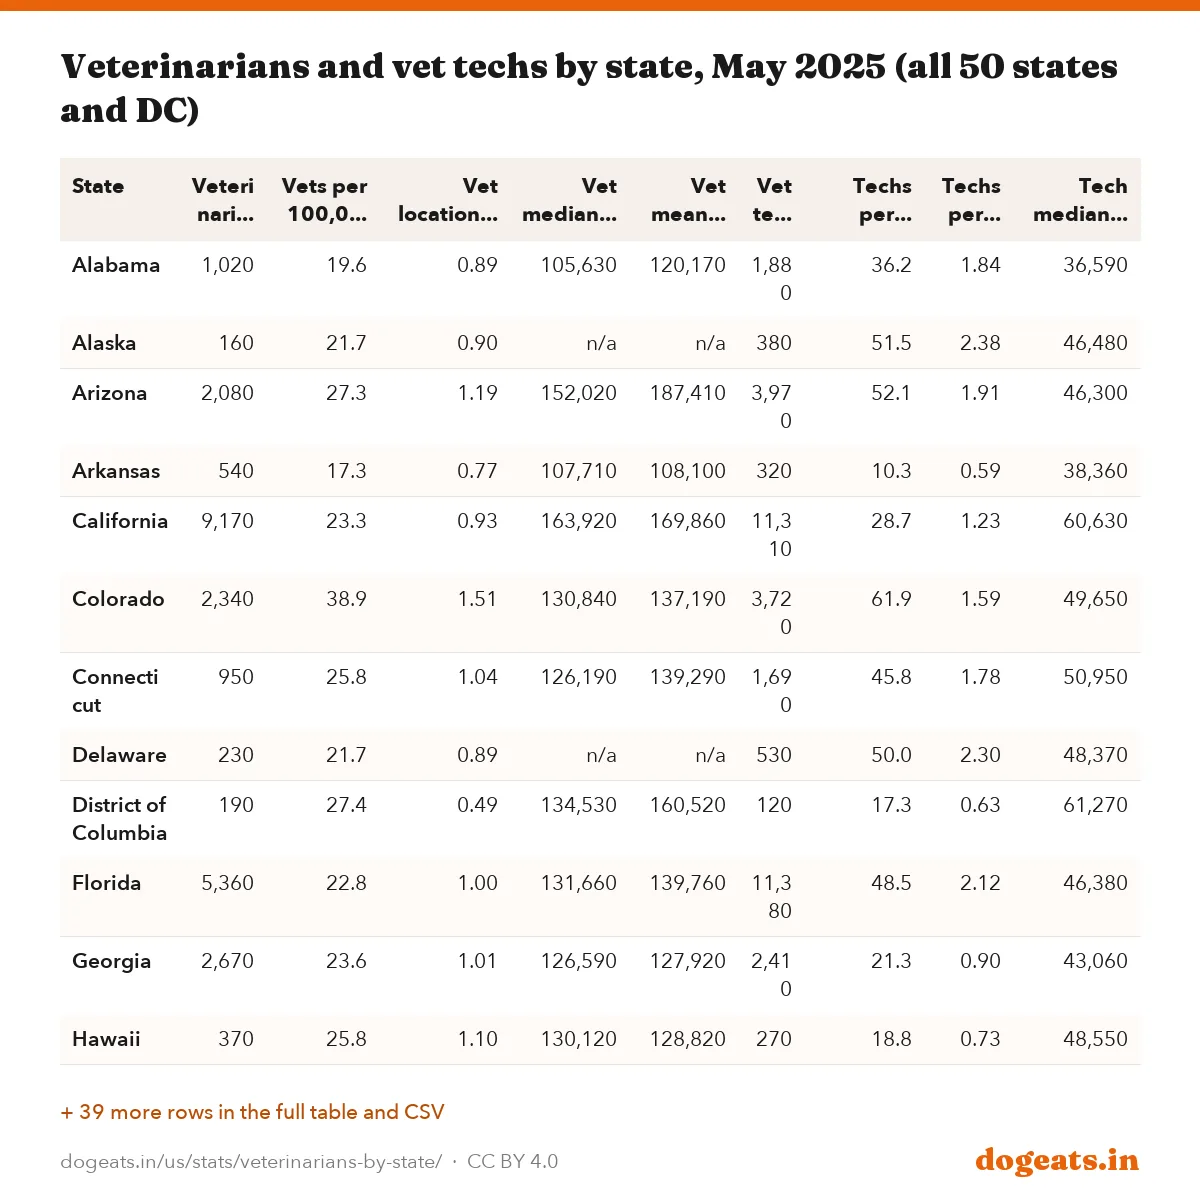
The location quotient compares a state's share of jobs in veterinary work with the national share. A quotient of 1.84, as in Montana, means vet jobs make up 84% more of the state's workforce than they do nationally.
BLS did not publish wage estimates for veterinarians in Alaska and Delaware in May 2025, so those cells read n/a.
Vet pay by state
The median US veterinarian earned $130,100 in May 2025. The mean was higher, $142,680, because a group of high earners pulls the average up. The top tenth earned at least $215,700.
California has the highest state median at $163,920, followed by Maryland ($163,170) and Washington ($160,510). South Dakota ($88,650) and Wyoming ($97,240) pay the least.
Arizona shows the biggest gap between the two measures. Its mean of $187,410 is the highest in the country, but its median is $152,020. A smaller group of very well paid vets lifts the average there.
Source: BLS OEWS May 2025. Median annual wage. Alaska and Delaware not published.
Show the numbers
| Label | $ |
|---|---|
| California | $163,920 |
| Maryland | $163,170 |
| Washington | $160,510 |
| New Jersey | $160,140 |
| Arizona | $152,020 |
| Massachusetts | $140,260 |
| District of Columbia | $134,530 |
| Illinois | $133,580 |
| Pennsylvania | $133,520 |
| Minnesota | $133,110 |
| North Dakota | $102,180 |
| Montana | $99,390 |
| Oklahoma | $98,090 |
| Wyoming | $97,240 |
| South Dakota | $88,650 |
Embed this chart
Pay has climbed faster than headcount. The national median rose from $88,490 in 2015 to $130,100 in 2025, a 47% increase. The biggest single jump came between 2022 and 2023, when the median went from $103,260 to $119,100.
Pet owners see the other side of this in their bills. Our cost of owning a dog report and pet insurance statistics track how vet prices feed into yearly spending and premiums.
Vet techs outnumber vets three to two
There were 1.54 veterinary technologists and technicians for every employed veterinarian in May 2025. Vet techs run lab tests such as blood counts, take X-rays, give anesthesia and monitor animals under it.
Texas leans hardest on them, with 2.67 techs per vet and 16,730 vet techs in all, more than any other state. Utah (2.42) and Alaska (2.38) come next. Arkansas has 0.59, the lowest ratio.
The job pays far less than the vet's. The median vet tech earned $47,380, or $23.61 an hour on average. DC ($65,370 mean) and Alaska ($63,720) pay the most; Louisiana ($35,980) pays the least.
Source: BLS OEWS May 2025, SOC 29-2056 employment divided by SOC 29-1131 employment. Teal = 10 highest, gray = 5 lowest.
Show the numbers
| Label | techs per vet |
|---|---|
| Texas | 2.67 |
| Utah | 2.42 |
| Alaska | 2.38 |
| Louisiana | 2.34 |
| Delaware | 2.30 |
| Wyoming | 2.21 |
| Illinois | 2.16 |
| Florida | 2.12 |
| Massachusetts | 2.08 |
| New Mexico | 1.93 |
| North Carolina | 0.88 |
| Hawaii | 0.73 |
| Oregon | 0.67 |
| District of Columbia | 0.63 |
| Arkansas | 0.59 |
Embed this chart
Vet tech employment fell from 131,320 in May 2024 to 129,140 in May 2025, while vet employment rose. One year of data is not a trend, but it cuts against ten years of steady growth.
Vet school towns have the densest vet workforces
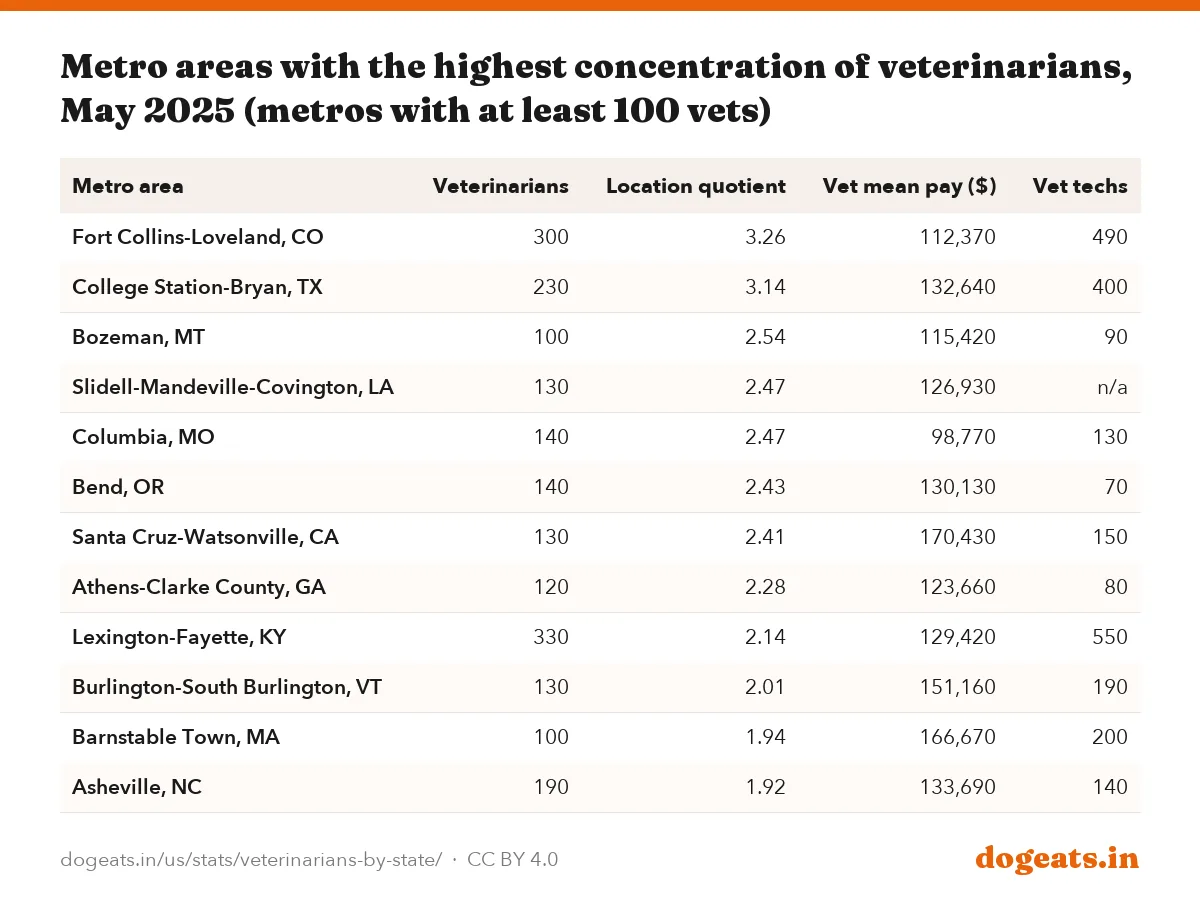
BLS published veterinarian employment for 285 metro areas in the 50 states and DC in May 2025. The highest concentrations are in college towns. Fort Collins, Colorado, and College Station, Texas, both have more than three times the national share of vet jobs.
Fort Collins is home to Colorado State University's veterinary college and College Station to Texas A&M's. Columbia, Missouri, and Athens, Georgia, also host vet schools. Lexington, Kentucky, sits in the center of the state's horse farm country.
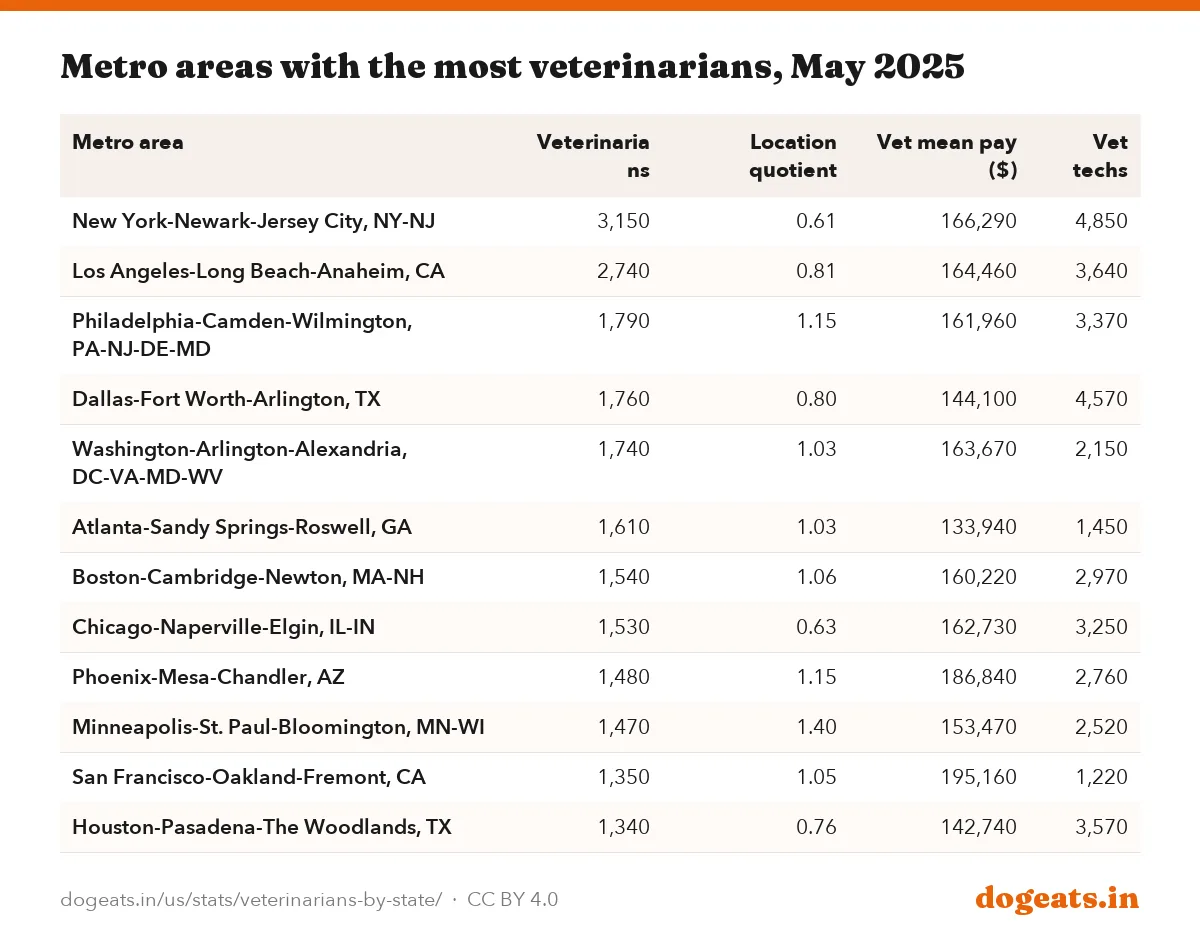
In raw numbers, big metros lead. Greater New York has 3,150 vets and Los Angeles 2,740. Both have below-average concentrations, with location quotients of 0.61 and 0.81.

| Metro area | Veterinarians | Location quotient | Vet mean pay ($) | Vet techs |
|---|---|---|---|---|
| Fort Collins-Loveland, CO | 300 | 3.26 | 112,370 | 490 |
| College Station-Bryan, TX | 230 | 3.14 | 132,640 | 400 |
| Bozeman, MT | 100 | 2.54 | 115,420 | 90 |
| Slidell-Mandeville-Covington, LA | 130 | 2.47 | 126,930 | n/a |
| Columbia, MO | 140 | 2.47 | 98,770 | 130 |
| Bend, OR | 140 | 2.43 | 130,130 | 70 |
| Santa Cruz-Watsonville, CA | 130 | 2.41 | 170,430 | 150 |
| Athens-Clarke County, GA | 120 | 2.28 | 123,660 | 80 |
| Lexington-Fayette, KY | 330 | 2.14 | 129,420 | 550 |
| Burlington-South Burlington, VT | 130 | 2.01 | 151,160 | 190 |
| Barnstable Town, MA | 100 | 1.94 | 166,670 | 200 |
| Asheville, NC | 190 | 1.92 | 133,690 | 140 |
| Metro area | Veterinarians | Location quotient | Vet mean pay ($) | Vet techs |
|---|---|---|---|---|
| New York-Newark-Jersey City, NY-NJ | 3,150 | 0.61 | 166,290 | 4,850 |
| Los Angeles-Long Beach-Anaheim, CA | 2,740 | 0.81 | 164,460 | 3,640 |
| Philadelphia-Camden-Wilmington, PA-NJ-DE-MD | 1,790 | 1.15 | 161,960 | 3,370 |
| Dallas-Fort Worth-Arlington, TX | 1,760 | 0.80 | 144,100 | 4,570 |
| Washington-Arlington-Alexandria, DC-VA-MD-WV | 1,740 | 1.03 | 163,670 | 2,150 |
| Atlanta-Sandy Springs-Roswell, GA | 1,610 | 1.03 | 133,940 | 1,450 |
| Boston-Cambridge-Newton, MA-NH | 1,540 | 1.06 | 160,220 | 2,970 |
| Chicago-Naperville-Elgin, IL-IN | 1,530 | 0.63 | 162,730 | 3,250 |
| Phoenix-Mesa-Chandler, AZ | 1,480 | 1.15 | 186,840 | 2,760 |
| Minneapolis-St. Paul-Bloomington, MN-WI | 1,470 | 1.40 | 153,470 | 2,520 |
| San Francisco-Oakland-Fremont, CA | 1,350 | 1.05 | 195,160 | 1,220 |
| Houston-Pasadena-The Woodlands, TX | 1,340 | 0.76 | 142,740 | 3,570 |
Where the vet workforce grew from 2015 to 2025
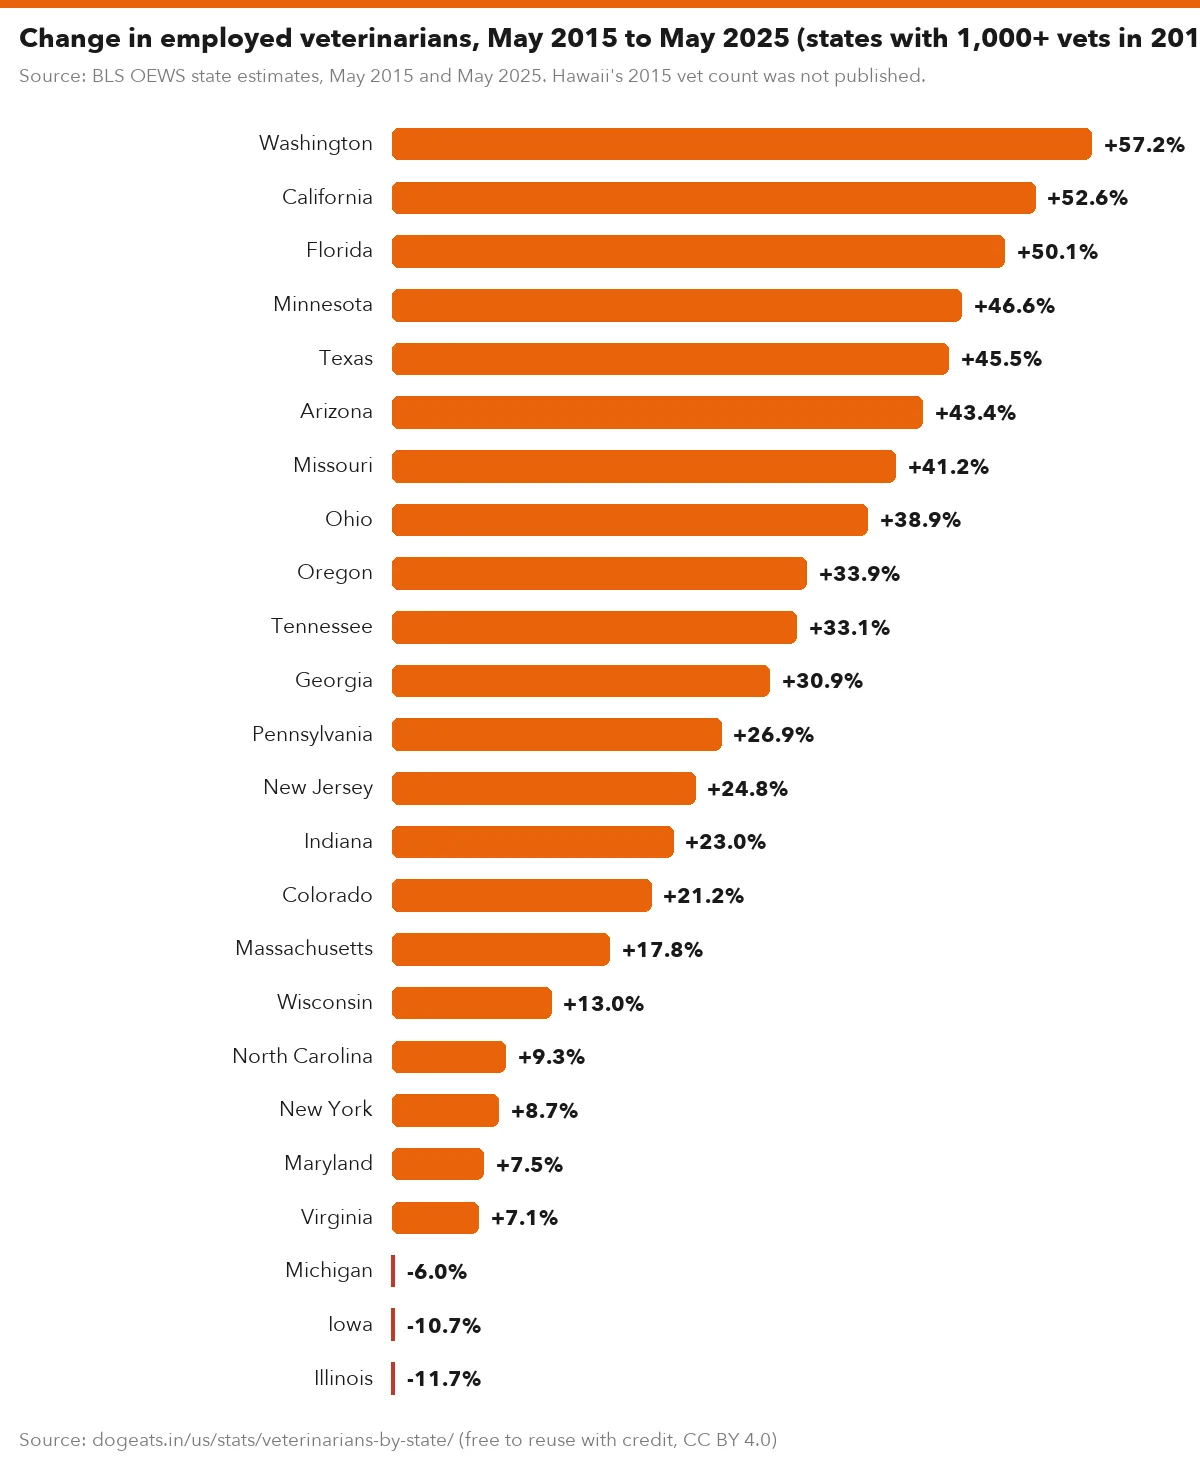
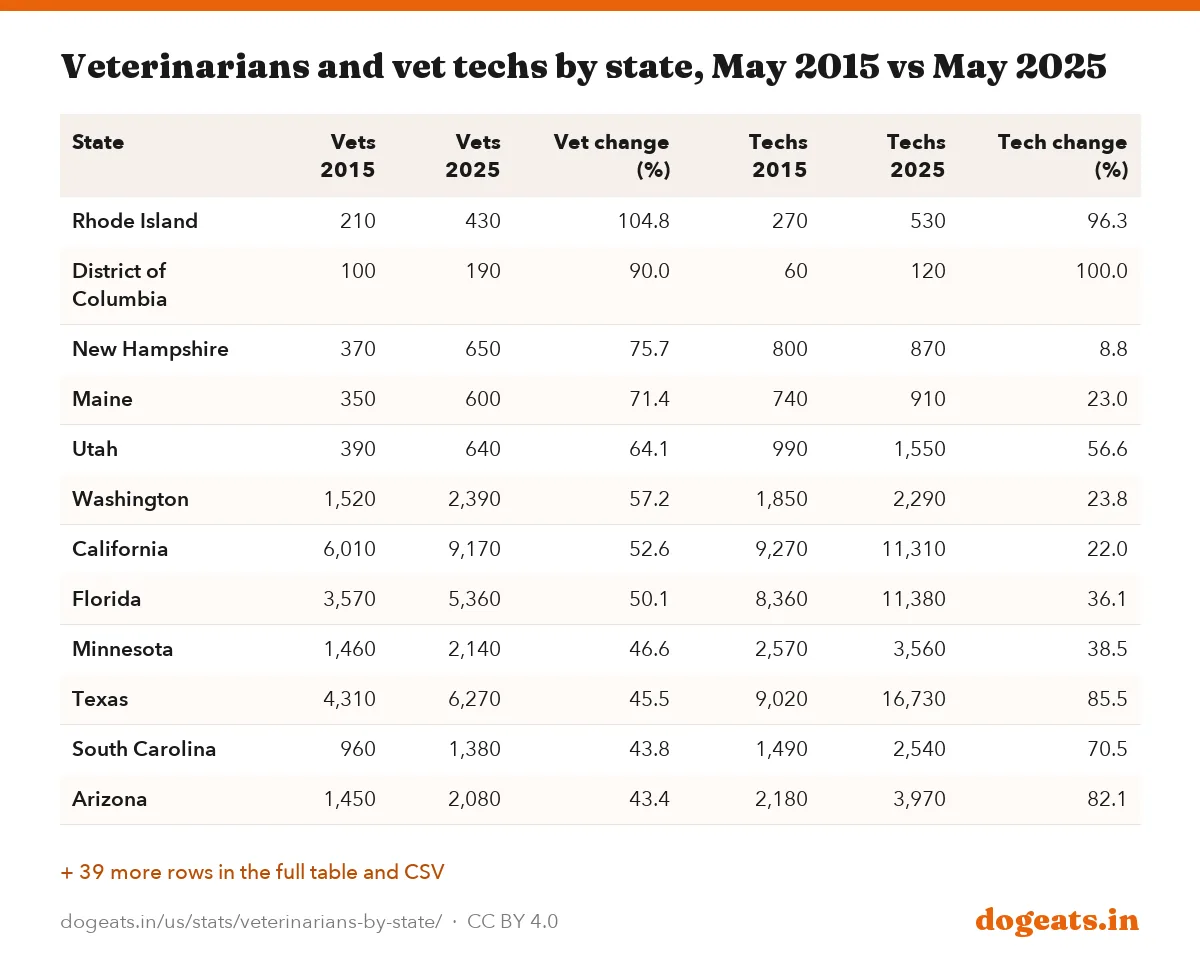
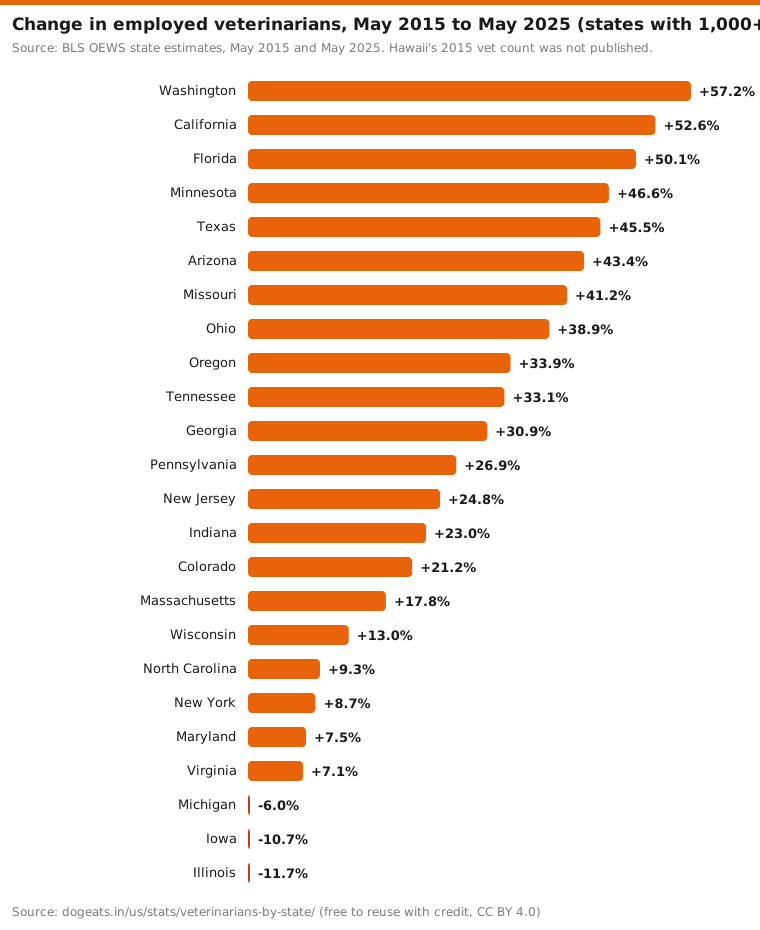
Among states with at least 1,000 vets in 2015, Washington grew fastest, from 1,520 to 2,390 vets (57.2%). California (52.6%) and Florida (50.1%) were next.
Illinois went the other way, falling from 2,640 to 2,330 vets. Michigan and Iowa also reported fewer vets in 2025 than in 2015.
Percent changes in small states swing widely because each estimate carries sampling error. Rhode Island doubled on paper, from 210 to 430 vets, but treat changes of a few hundred jobs with care.
Source: BLS OEWS state estimates, May 2015 and May 2025. Hawaii's 2015 vet count was not published.
Show the numbers
| Label | % |
|---|---|
| Washington | +57.2% |
| California | +52.6% |
| Florida | +50.1% |
| Minnesota | +46.6% |
| Texas | +45.5% |
| Arizona | +43.4% |
| Missouri | +41.2% |
| Ohio | +38.9% |
| Oregon | +33.9% |
| Tennessee | +33.1% |
| Georgia | +30.9% |
| Pennsylvania | +26.9% |
| New Jersey | +24.8% |
| Indiana | +23.0% |
| Colorado | +21.2% |
| Massachusetts | +17.8% |
| Wisconsin | +13.0% |
| North Carolina | +9.3% |
| New York | +8.7% |
| Maryland | +7.5% |
| Virginia | +7.1% |
| Michigan | -6.0% |
| Iowa | -10.7% |
| Illinois | -11.7% |
Embed this chart
| State | Vets 2015 | Vets 2025 | Vet change (%) | Techs 2015 | Techs 2025 | Tech change (%) |
|---|---|---|---|---|---|---|
| Rhode Island | 210 | 430 | 104.8 | 270 | 530 | 96.3 |
| District of Columbia | 100 | 190 | 90.0 | 60 | 120 | 100.0 |
| New Hampshire | 370 | 650 | 75.7 | 800 | 870 | 8.8 |
| Maine | 350 | 600 | 71.4 | 740 | 910 | 23.0 |
| Utah | 390 | 640 | 64.1 | 990 | 1,550 | 56.6 |
| Washington | 1,520 | 2,390 | 57.2 | 1,850 | 2,290 | 23.8 |
| California | 6,010 | 9,170 | 52.6 | 9,270 | 11,310 | 22.0 |
| Florida | 3,570 | 5,360 | 50.1 | 8,360 | 11,380 | 36.1 |
| Minnesota | 1,460 | 2,140 | 46.6 | 2,570 | 3,560 | 38.5 |
| Texas | 4,310 | 6,270 | 45.5 | 9,020 | 16,730 | 85.5 |
| South Carolina | 960 | 1,380 | 43.8 | 1,490 | 2,540 | 70.5 |
| Arizona | 1,450 | 2,080 | 43.4 | 2,180 | 3,970 | 82.1 |
| Missouri | 1,360 | 1,920 | 41.2 | 1,340 | 2,040 | 52.2 |
| West Virginia | 280 | 390 | 39.3 | 350 | 400 | 14.3 |
| Ohio | 2,470 | 3,430 | 38.9 | 3,370 | 4,790 | 42.1 |
| Oklahoma | 830 | 1,150 | 38.6 | 840 | 1,060 | 26.2 |
| Montana | 370 | 510 | 37.8 | 410 | 480 | 17.1 |
| Oregon | 1,240 | 1,660 | 33.9 | 1,460 | 1,120 | -23.3 |
| Tennessee | 1,300 | 1,730 | 33.1 | 1,420 | 1,640 | 15.5 |
| Kansas | 760 | 1,000 | 31.6 | 560 | 1,270 | 126.8 |
| Georgia | 2,040 | 2,670 | 30.9 | 2,540 | 2,410 | -5.1 |
| North Dakota | 210 | 270 | 28.6 | 170 | 340 | 100.0 |
| Pennsylvania | 2,750 | 3,490 | 26.9 | 4,720 | 6,620 | 40.3 |
| Kentucky | 940 | 1,190 | 26.6 | 1,530 | 1,670 | 9.2 |
| Louisiana | 760 | 950 | 25.0 | 1,370 | 2,220 | 62.0 |
| New Jersey | 1,530 | 1,910 | 24.8 | 2,870 | 2,910 | 1.4 |
| Indiana | 1,220 | 1,500 | 23.0 | 1,310 | 1,820 | 38.9 |
| Connecticut | 780 | 950 | 21.8 | 1,600 | 1,690 | 5.6 |
| South Dakota | 230 | 280 | 21.7 | 260 | 300 | 15.4 |
| Colorado | 1,930 | 2,340 | 21.2 | 3,230 | 3,720 | 15.2 |
| Idaho | 450 | 540 | 20.0 | 510 | 790 | 54.9 |
| Alabama | 860 | 1,020 | 18.6 | 910 | 1,880 | 106.6 |
| Massachusetts | 1,630 | 1,920 | 17.8 | 2,790 | 3,990 | 43.0 |
| Nevada | 580 | 680 | 17.2 | 680 | 1,120 | 64.7 |
| Delaware | 200 | 230 | 15.0 | 320 | 530 | 65.6 |
| New Mexico | 400 | 460 | 15.0 | 550 | 890 | 61.8 |
| Wisconsin | 1,620 | 1,830 | 13.0 | 1,950 | 2,590 | 32.8 |
| Nebraska | 710 | 780 | 9.9 | 510 | 690 | 35.3 |
| North Carolina | 2,690 | 2,940 | 9.3 | 3,210 | 2,580 | -19.6 |
| New York | 3,120 | 3,390 | 8.7 | 4,520 | 5,350 | 18.4 |
| Maryland | 1,330 | 1,430 | 7.5 | 2,250 | 2,540 | 12.9 |
| Virginia | 2,520 | 2,700 | 7.1 | 1,480 | 2,790 | 88.5 |
| Vermont | 270 | 280 | 3.7 | 360 | 390 | 8.3 |
| Mississippi | 470 | 480 | 2.1 | 480 | 650 | 35.4 |
| Arkansas | 540 | 540 | 0.0 | 300 | 320 | 6.7 |
| Hawaii | n/a | 370 | n/a | 340 | 270 | -20.6 |
| Alaska | 170 | 160 | -5.9 | 180 | 380 | 111.1 |
| Michigan | 2,160 | 2,030 | -6.0 | 2,900 | 2,550 | -12.1 |
| Iowa | 1,120 | 1,000 | -10.7 | 740 | 1,220 | 64.9 |
| Illinois | 2,640 | 2,330 | -11.7 | 3,640 | 5,040 | 38.5 |
| Wyoming | 180 | 140 | -22.2 | 200 | 310 | 55.0 |
The AVMA count and who works as a vet
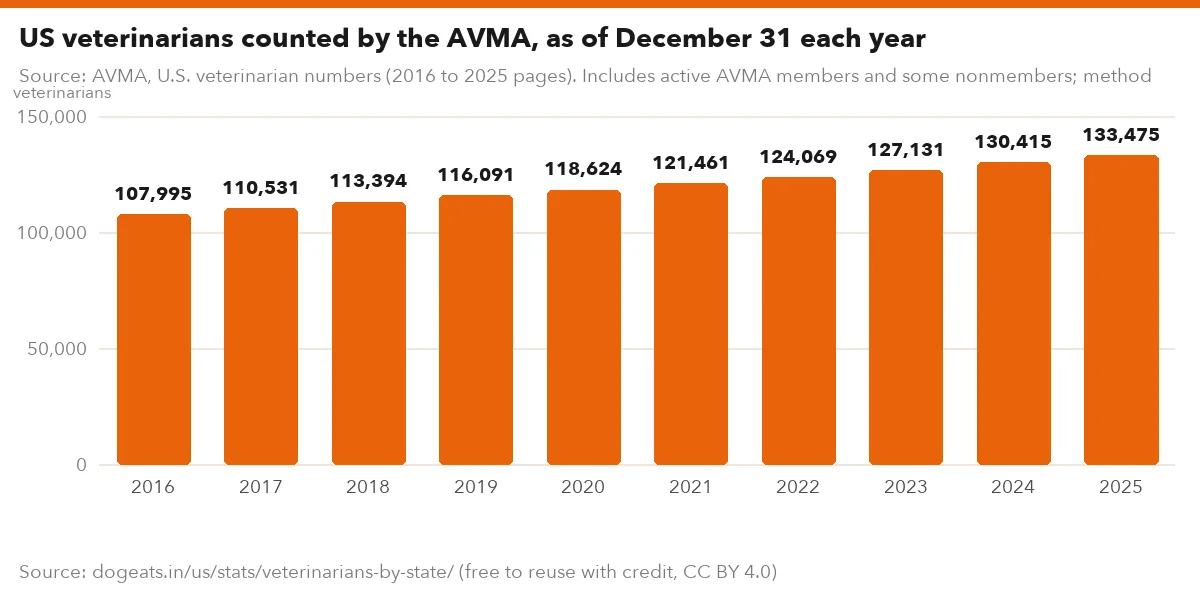
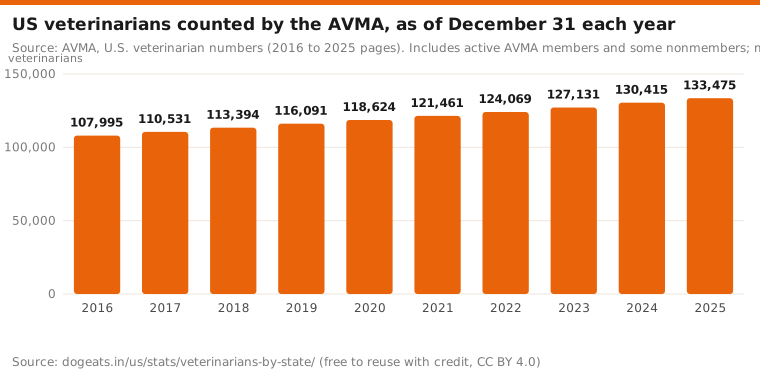
The AVMA keeps its own tally of US veterinarians from its member and nonmember records. It counted 133,475 at the end of 2025, up from 107,995 at the end of 2016. That is 23.6% growth in nine years.
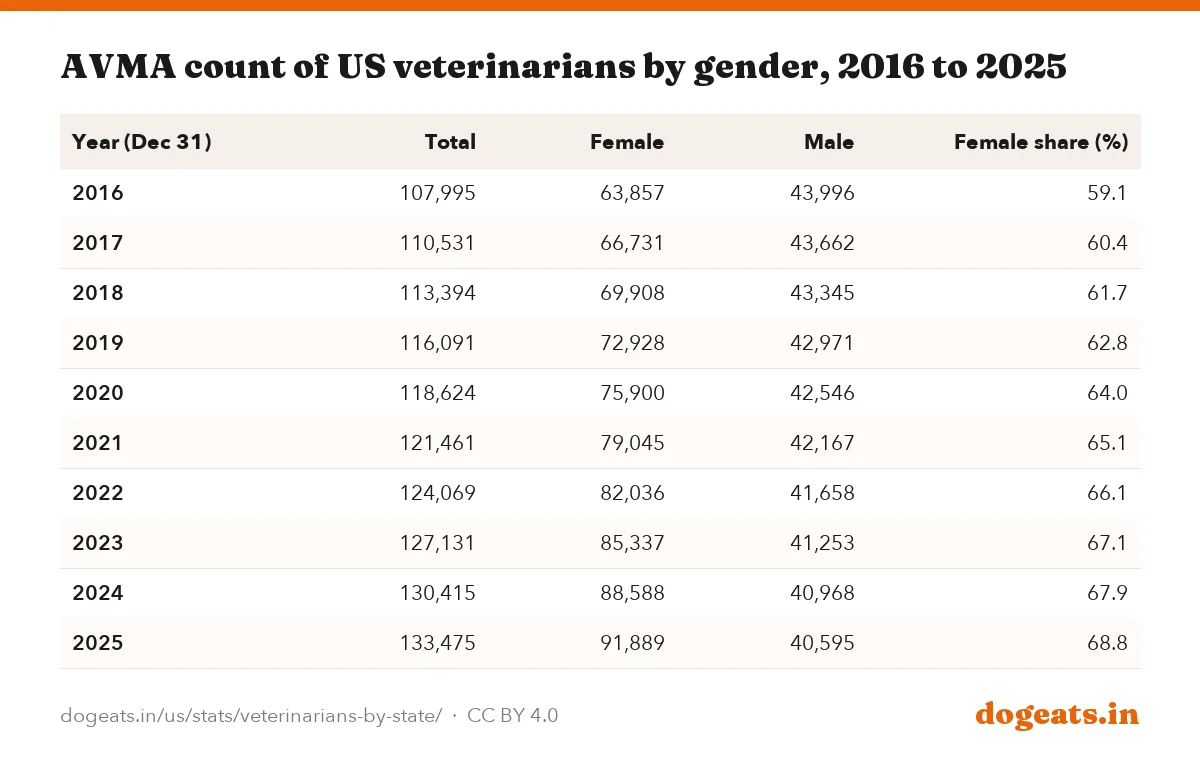
The profession is now mostly female. Women made up 68.8% of the AVMA count in 2025, against 59.1% in 2016. The number of male vets fell every year in that span, from 43,996 to 40,595.
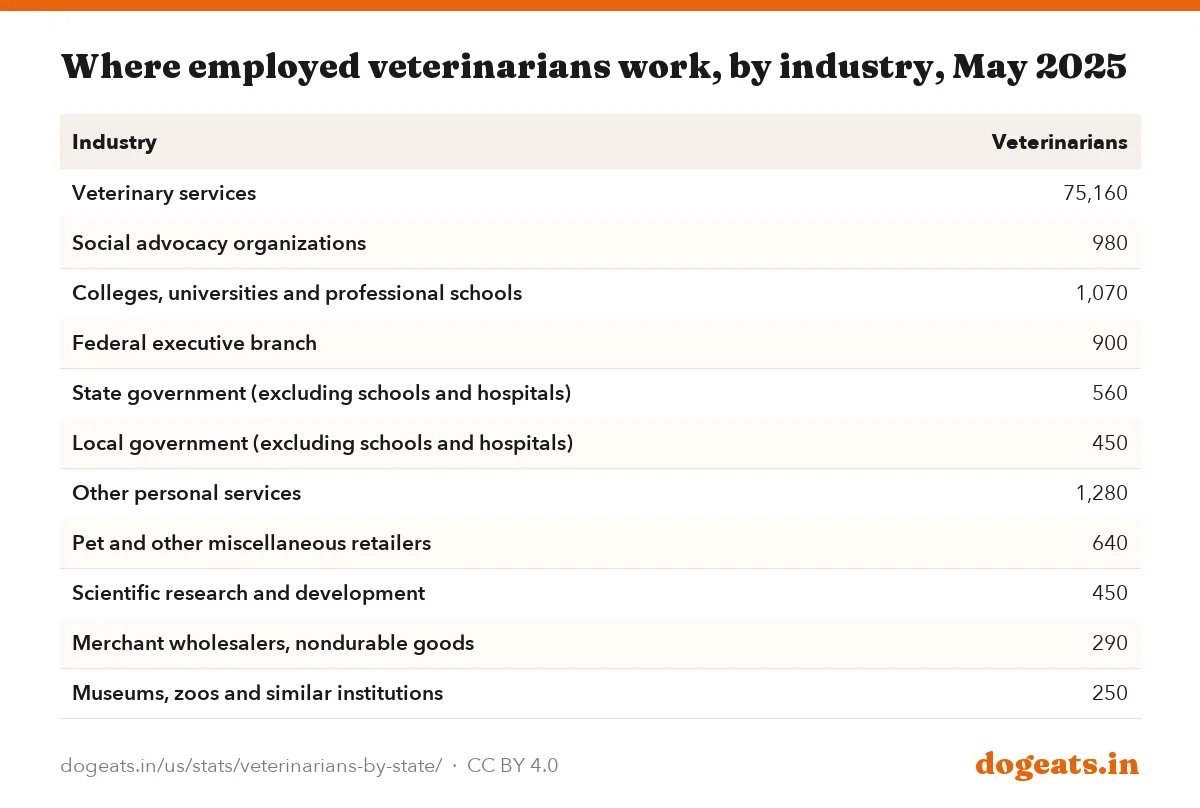
On the BLS payroll measure, 89.6% of employed vets work in the veterinary services industry, meaning clinics and animal hospitals. Colleges and universities employ about 1,070. Government employs about 2,780 when state universities and public hospitals are included.
Source: AVMA, U.S. veterinarian numbers (2016 to 2025 pages). Includes active AVMA members and some nonmembers; method details differ slightly by year.
Show the numbers
| Label | veterinarians |
|---|---|
| 2016 | 107,995 |
| 2017 | 110,531 |
| 2018 | 113,394 |
| 2019 | 116,091 |
| 2020 | 118,624 |
| 2021 | 121,461 |
| 2022 | 124,069 |
| 2023 | 127,131 |
| 2024 | 130,415 |
| 2025 | 133,475 |
Embed this chart
| Year (Dec 31) | Total | Female | Male | Female share (%) |
|---|---|---|---|---|
| 2016 | 107,995 | 63,857 | 43,996 | 59.1 |
| 2017 | 110,531 | 66,731 | 43,662 | 60.4 |
| 2018 | 113,394 | 69,908 | 43,345 | 61.7 |
| 2019 | 116,091 | 72,928 | 42,971 | 62.8 |
| 2020 | 118,624 | 75,900 | 42,546 | 64.0 |
| 2021 | 121,461 | 79,045 | 42,167 | 65.1 |
| 2022 | 124,069 | 82,036 | 41,658 | 66.1 |
| 2023 | 127,131 | 85,337 | 41,253 | 67.1 |
| 2024 | 130,415 | 88,588 | 40,968 | 67.9 |
| 2025 | 133,475 | 91,889 | 40,595 | 68.8 |
| Industry | Veterinarians |
|---|---|
| Veterinary services | 75,160 |
| Social advocacy organizations | 980 |
| Colleges, universities and professional schools | 1,070 |
| Federal executive branch | 900 |
| State government (excluding schools and hospitals) | 560 |
| Local government (excluding schools and hospitals) | 450 |
| Other personal services | 1,280 |
| Pet and other miscellaneous retailers | 640 |
| Scientific research and development | 450 |
| Merchant wholesalers, nondurable goods | 290 |
| Museums, zoos and similar institutions | 250 |
The industry table shows BLS published figures for selected industries. They do not add up to the national total, because smaller industries are left out and some estimates are suppressed.
Is there a veterinarian shortage?
BLS projects veterinarian jobs to grow 9% from 2025 to 2035, which it calls much faster than average. It expects about 3,100 openings a year. BLS says many will come from vets who retire or change careers.
Vet tech jobs are also projected to grow 9%, with about 13,400 openings a year. Yearly openings equal about 10% of current tech jobs, against about 3.4% for vets.
The data here measures jobs, not access. A state can have many vets per head and still have rural counties with none. Still, the ratio matters to owners: there is about one payroll vet for every 1,040 pet dogs, before counting cats.
- Vets per 100,000 residents: 24.5 nationally; middle state 25.8.
- Pet dogs per payroll vet: about 1,040 (AVMA 87.3 million dogs / BLS 83,900 vets).
- Projected vet job growth, 2025 to 2035: 9% (BLS Employment Projections).
- Projected yearly openings: 3,100 for vets, 13,400 for vet techs.
Vet supply matters most when something is urgent, such as a dog eating a chocolate bar. Our page on whether dogs can eat Hershey's chocolate explains when to call a vet straight away.
For how many households own dogs in the first place, see our dog ownership statistics.
Frequently asked questions
How many veterinarians are there in the US?
Employers reported 83,900 veterinarians on payrolls in May 2025, according to BLS. Adding the self-employed, BLS puts vet jobs at 91,100. The AVMA, which counts license holders it can track, reported 133,475 US veterinarians at the end of 2025.
Which state has the most veterinarians?
California has the most, with 9,170 employed vets in May 2025. Texas (6,270) and Florida (5,360) follow. Per person, New Hampshire leads with 45.9 vets per 100,000 residents.
Which state has the fewest vets per person?
Mississippi has the fewest, with 16.2 employed vets per 100,000 residents. New York (16.9) and Arkansas (17.3) are next lowest. The national rate is 24.5.
How much do veterinarians make?
The median US veterinarian earned $130,100 a year in May 2025, and the mean was $142,680. The bottom tenth earned under $73,920 and the top tenth over $215,700. California had the highest state median at $163,920.
How much do vet techs make?
Veterinary technologists and technicians earned a median $47,380 a year in May 2025. That is up 49% from $31,800 in 2015. DC and Alaska paid the highest average wages.
How many vet techs are there per vet?
Nationally there are 1.54 vet techs for every employed vet. Texas has the highest ratio at 2.67, and Arkansas the lowest at 0.59.
Is the number of veterinarians growing?
Yes. Payroll vet jobs rose 27.8% from May 2015 to May 2025, and the AVMA count rose 23.6% from 2016 to 2025. BLS projects 9% more vet jobs from 2025 to 2035.
What share of veterinarians are women?
Women made up 68.8% of the 133,475 veterinarians the AVMA counted at the end of 2025. In 2016 the share was 59.1%.
Methodology and limitations
Employment and wage figures come from the Bureau of Labor Statistics Occupational Employment and Wage Statistics (OEWS) survey for May 2025. We pulled them from the BLS OEWS data service on October 10, 2026. Veterinarians are SOC code 29-1131; veterinary technologists and technicians are SOC 29-2056. OEWS counts wage and salary jobs and excludes the self-employed.
Earlier years come from the BLS OEWS national occupation profiles for May 2016 to May 2023 and the May 2015 and May 2024 national data files. The May 2015 state figures come from the BLS state data file for that year.
Per-100,000 rates divide OEWS state employment by the US Census Bureau Vintage 2025 resident population estimate for July 1, 2025. Techs per vet divides tech employment by vet employment in the same state. The location quotient is published by BLS.
AVMA counts come from the AVMA's U.S. veterinarian numbers pages for each year from 2016 to 2025. Projections come from the BLS Occupational Outlook Handbook, which uses the Employment Projections program for 2025 to 2035. Pet dog numbers come from the AVMA's 2025 pet ownership statistics.
Sources
- Bureau of Labor Statistics, OEWS May 2025 data (veterinarians 29-1131; vet techs 29-2056), National, state and metro employment, wages and location quotients
- US Census Bureau, Vintage 2025 state population estimates, Resident population July 1, 2025 for per-100,000 rates
- American Veterinary Medical Association, U.S. veterinarian numbers (2025 and prior years), AVMA counts of US veterinarians 2016 to 2025 and gender breakdown
- Also consulted: BLS Occupational Outlook Handbook, Veterinarians, BLS Occupational Outlook Handbook, Veterinary Technologists and Technicians, BLS OEWS May 2024 national data file, BLS OEWS May 2015 national data file, BLS OEWS May 2015 state data file, BLS OEWS occupation profiles, Veterinarians, May 2016 to May 2023, BLS OEWS occupation profiles, Veterinary Technologists and Technicians, May 2016 to May 2023, AVMA, U.S. pet ownership statistics (2025 Pet Ownership and Demographic Sourcebook).
Cite, embed and download
This report, its data and its images are free to reuse under a Creative Commons Attribution 4.0 licence. Credit dogeats.in with a link to this page. Every chart has its own embed code, every table has a CSV and an image download, and the images below are ready for social posts, slides and articles.
Cite this report
Link to this report
Every chart and table as an image