Data report · Updated October 2026
Pet spending by generation: how much millennials, Gen Z, Gen X and boomers spend on pets
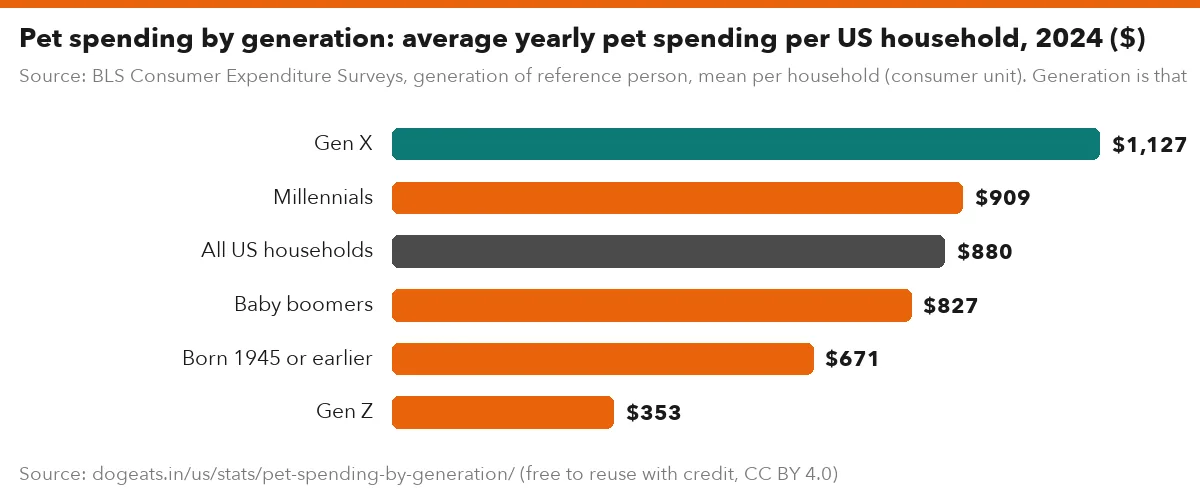
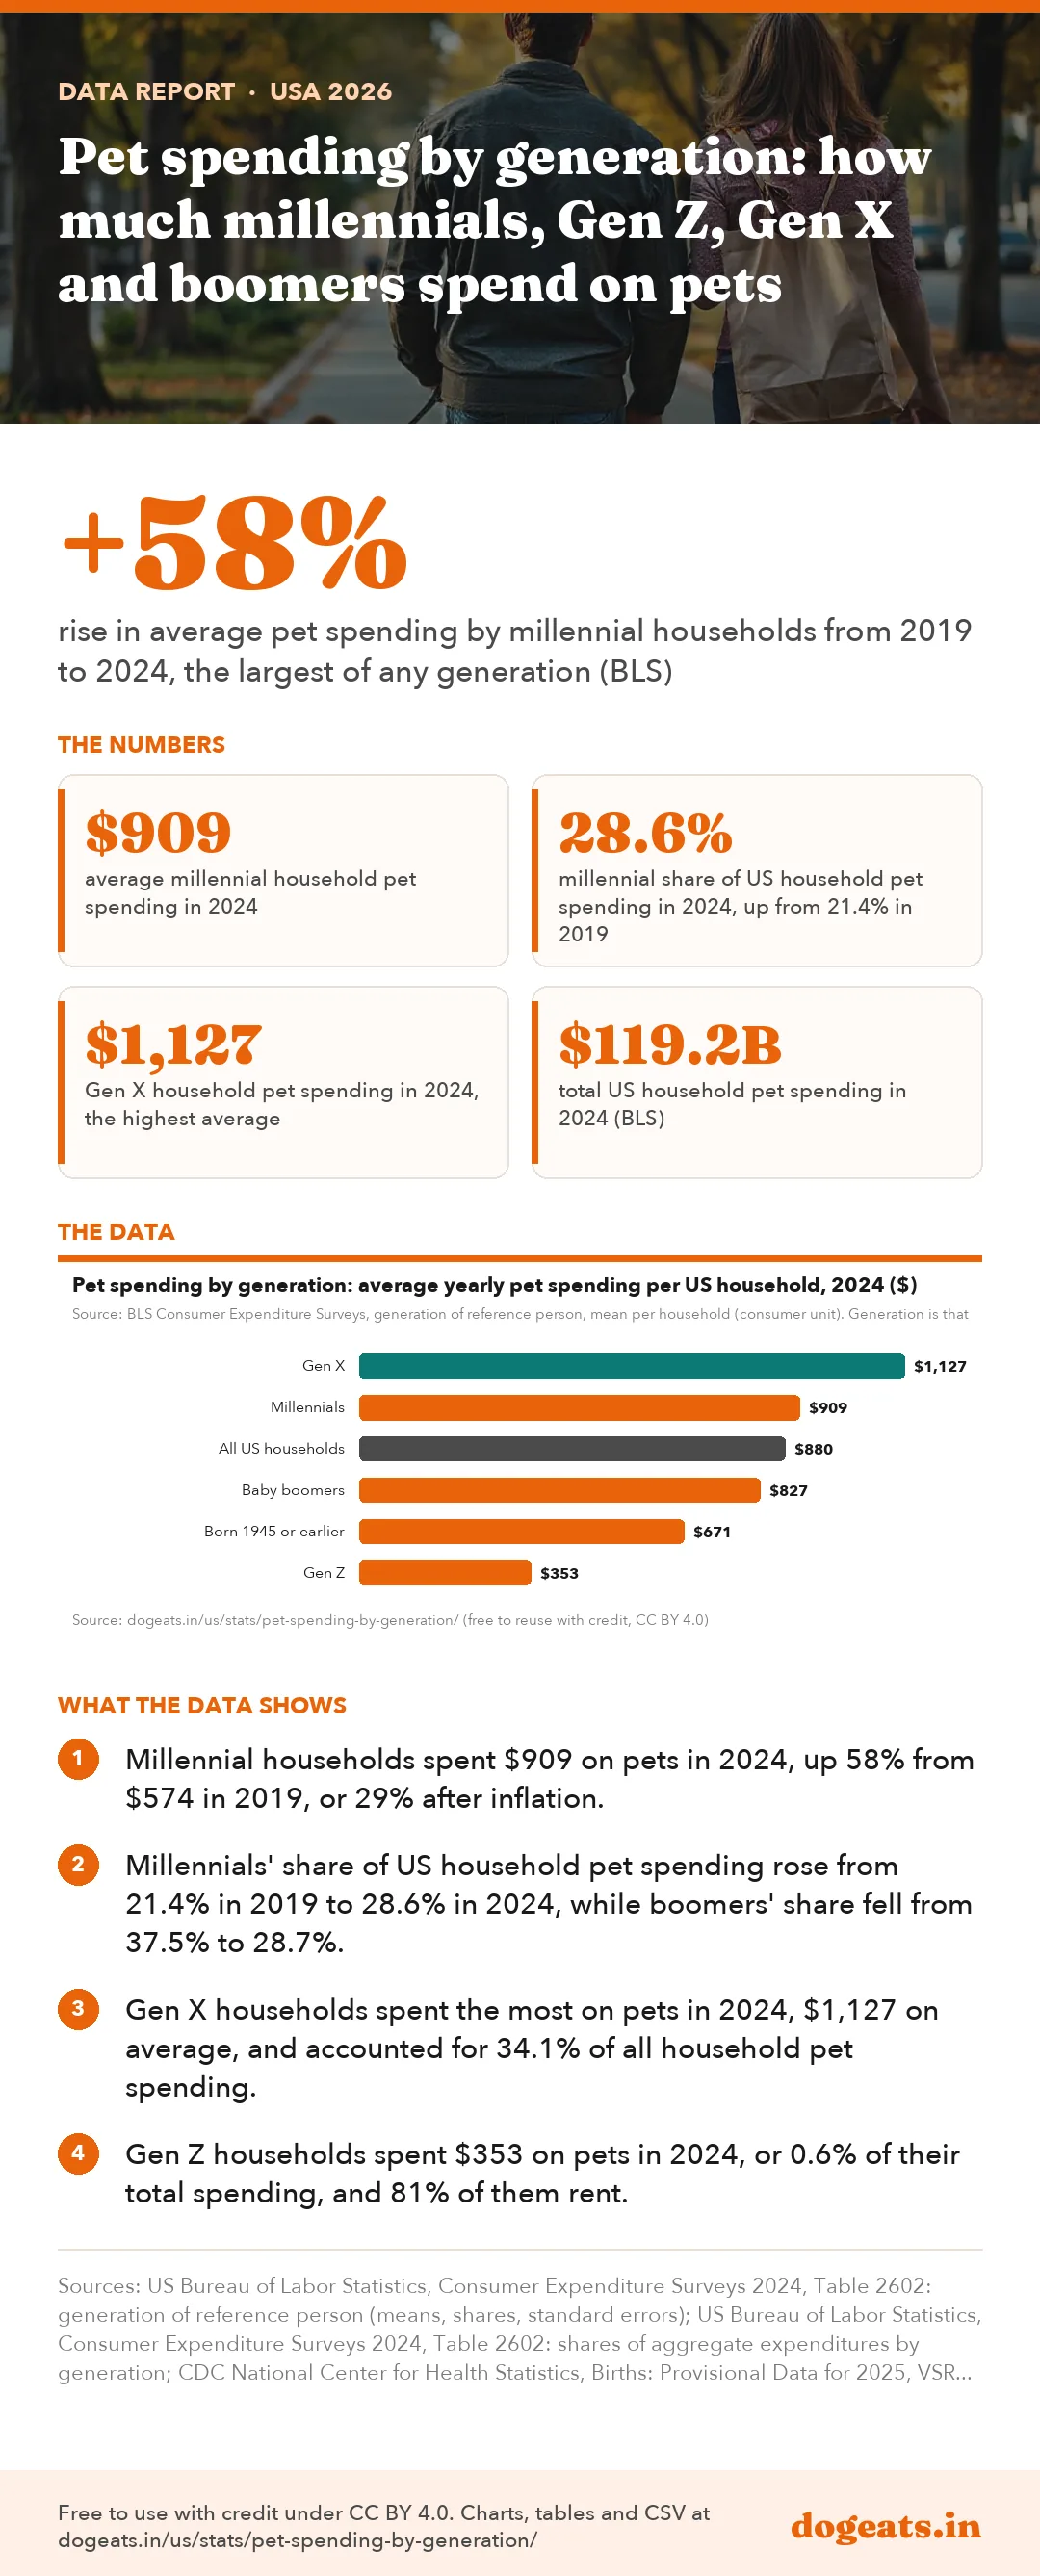
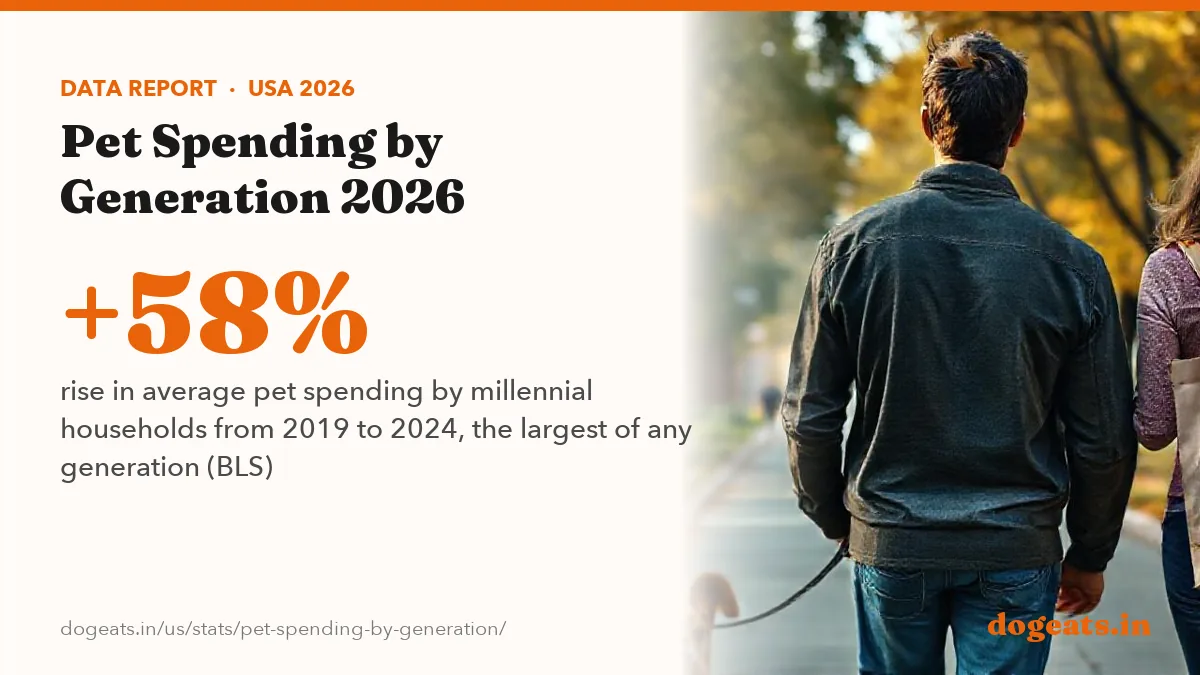
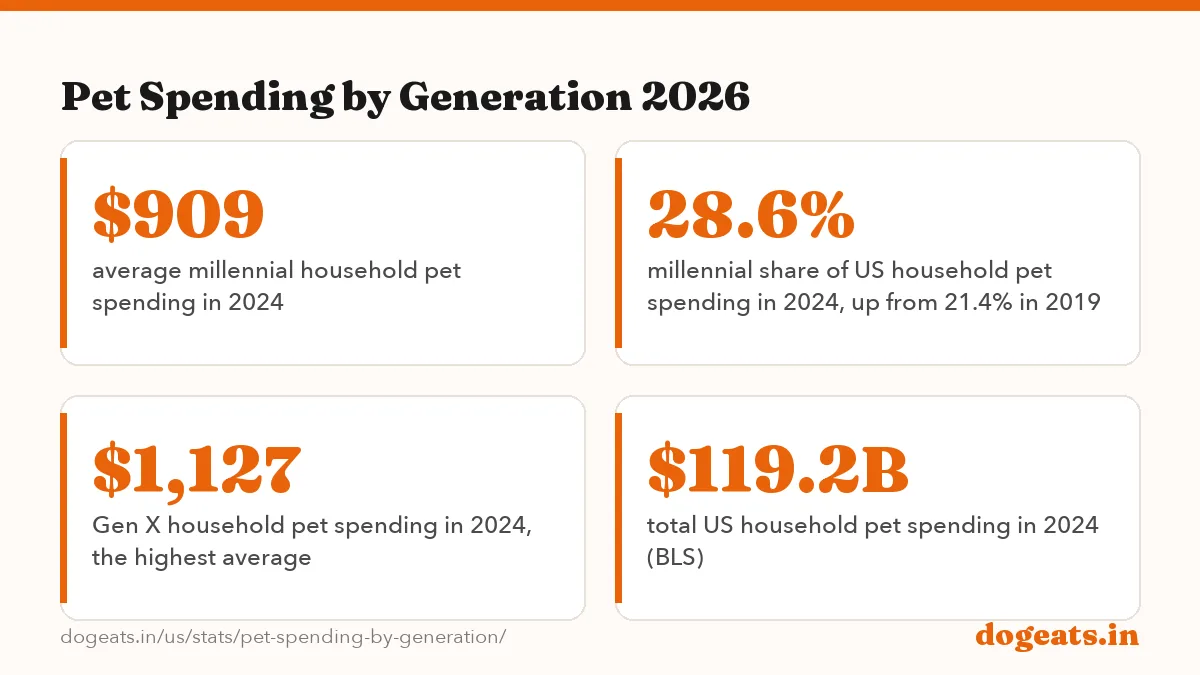
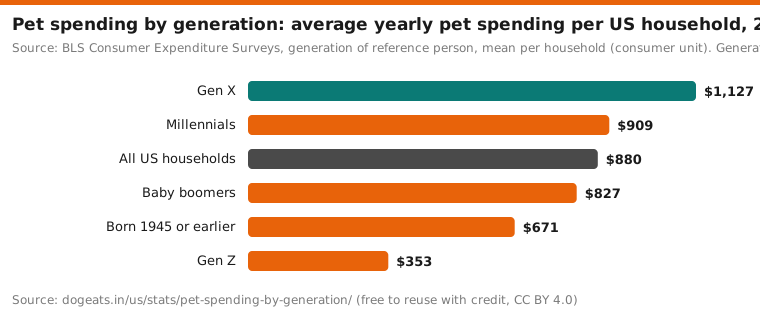
Gen X households spent the most on pets in 2024, $1,127 on average, and millennials spent $909, up 58% from 2019. Gen Z households spent $353. All US households spent $119.2 billion on pets in 2024, according to the BLS Consumer Expenditure Surveys.

Key findings
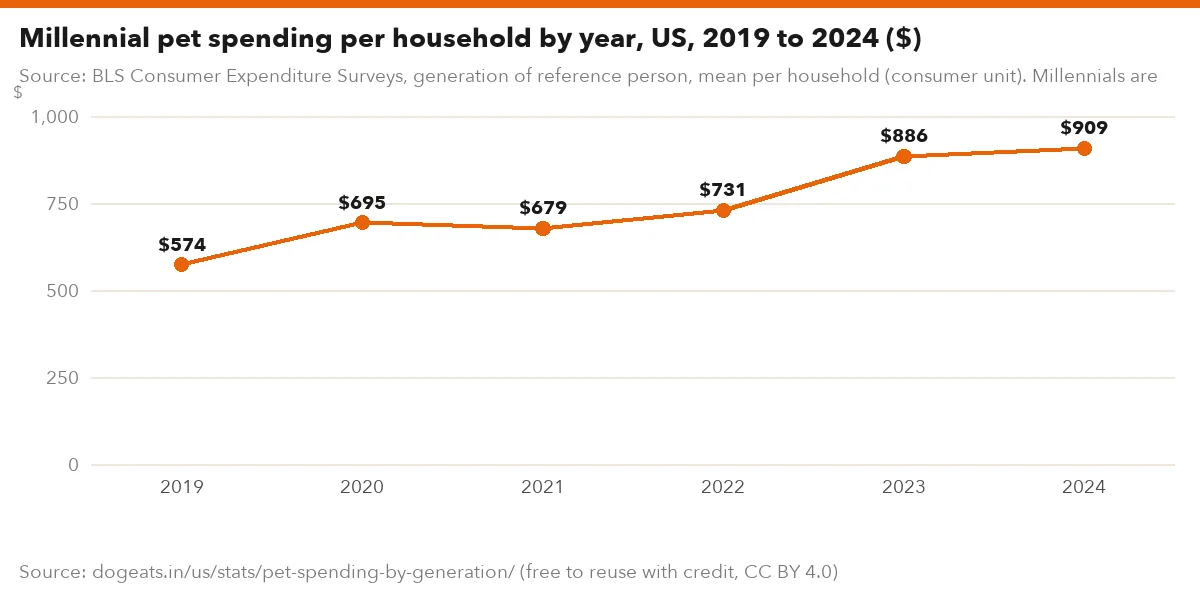
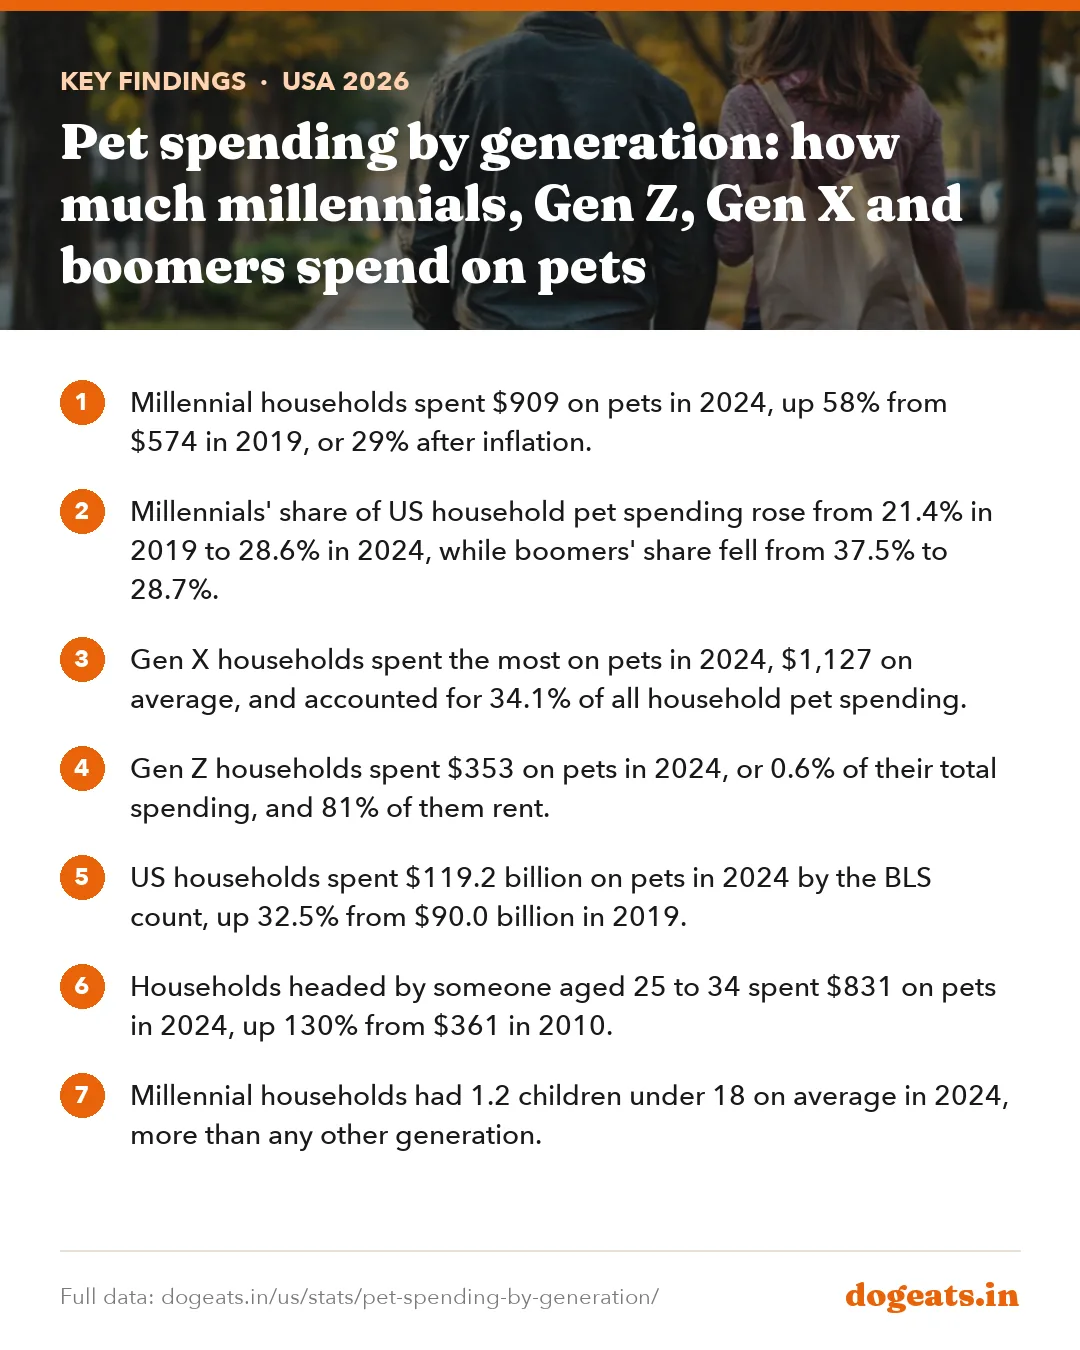
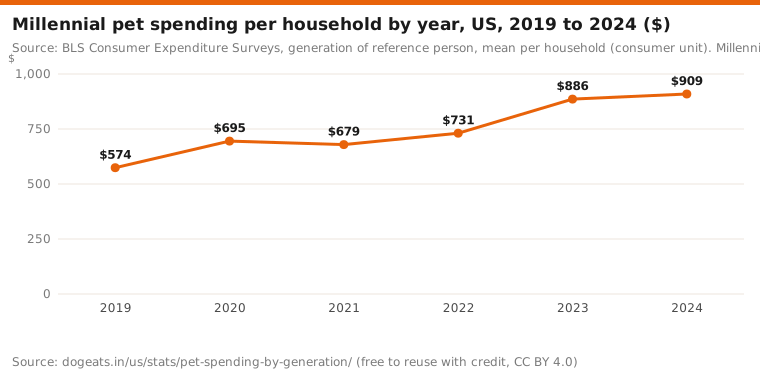
- Millennial households spent $909 on pets in 2024, up 58% from $574 in 2019, or 29% after inflation.
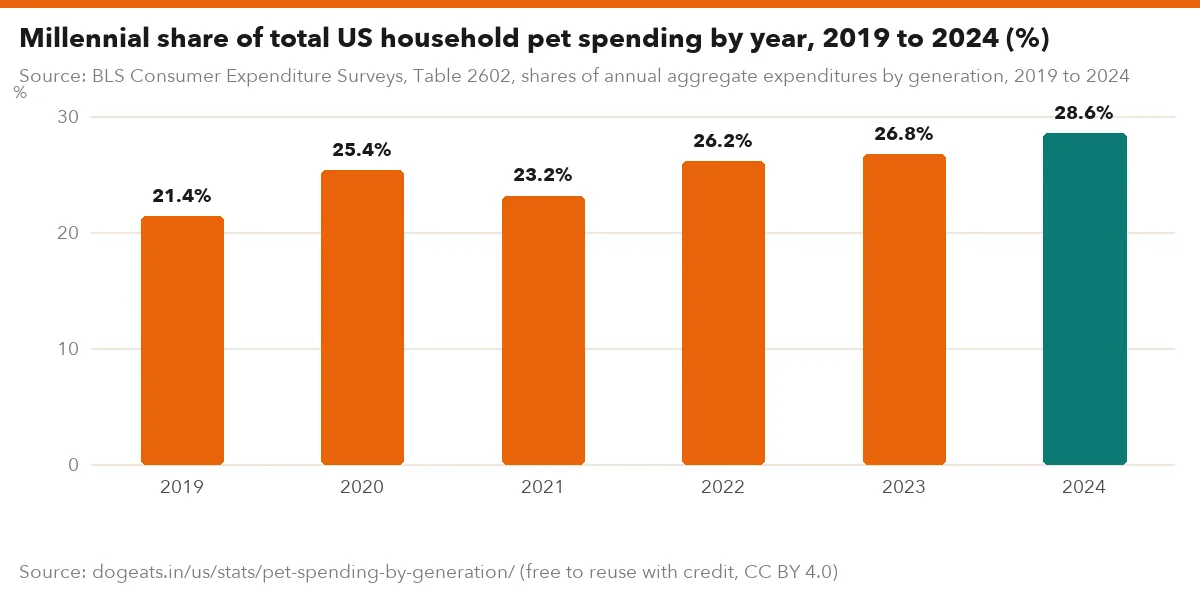
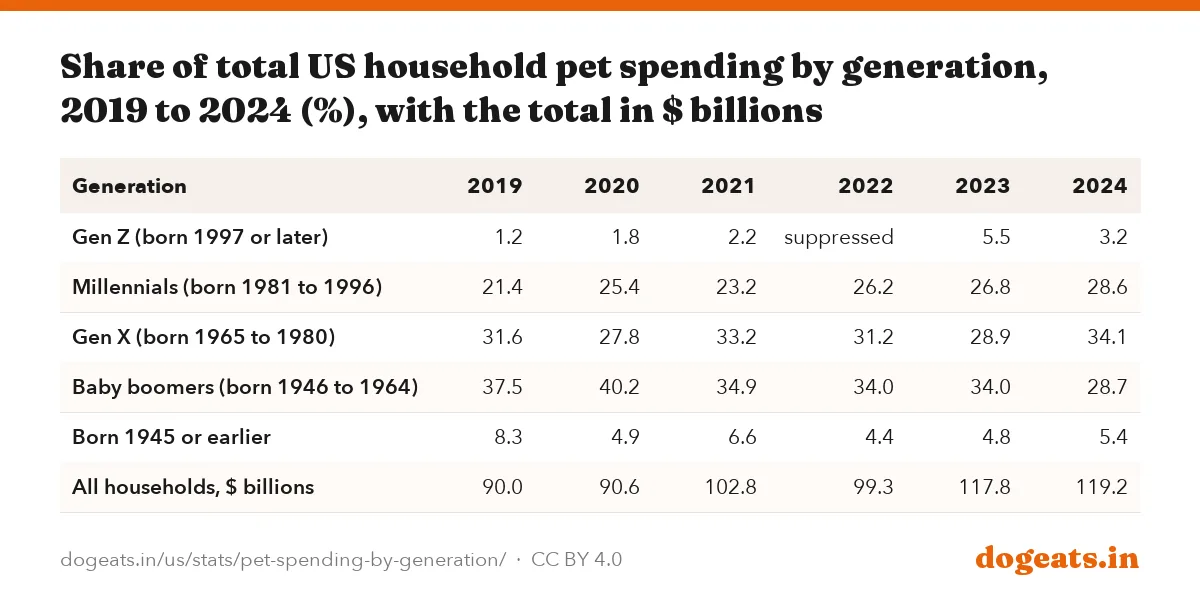
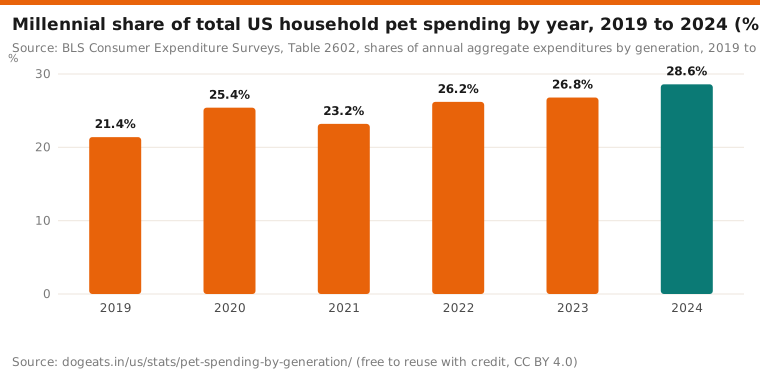
- Millennials' share of US household pet spending rose from 21.4% in 2019 to 28.6% in 2024, while boomers' share fell from 37.5% to 28.7%.
- Gen X households spent the most on pets in 2024, $1,127 on average, and accounted for 34.1% of all household pet spending.
- Gen Z households spent $353 on pets in 2024, or 0.6% of their total spending, and 81% of them rent.
- US households spent $119.2 billion on pets in 2024 by the BLS count, up 32.5% from $90.0 billion in 2019.
- Households headed by someone aged 25 to 34 spent $831 on pets in 2024, up 130% from $361 in 2010.
- Millennial households had 1.2 children under 18 on average in 2024, more than any other generation.
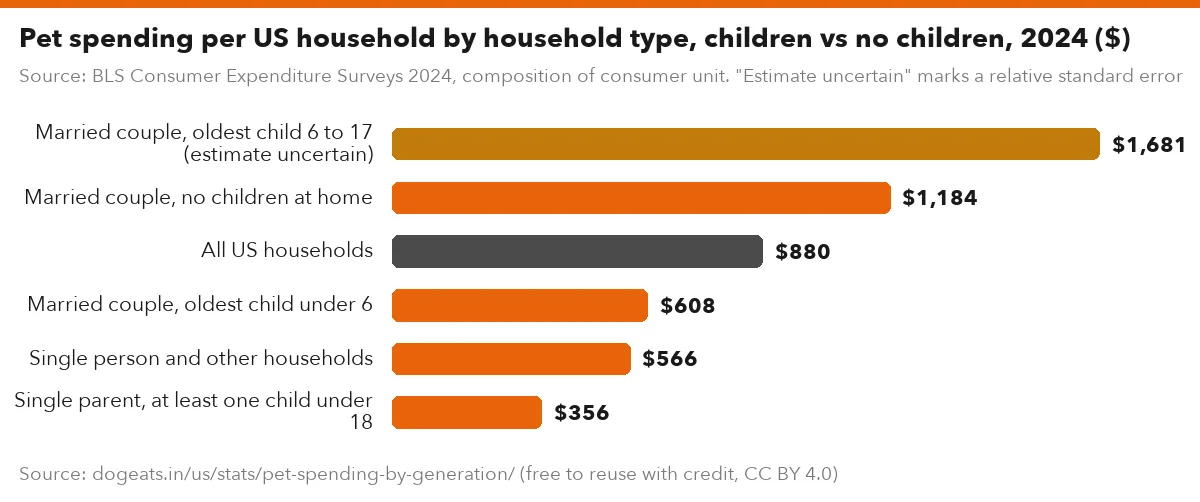
- Married couples with no children at home spent $1,184 on pets in 2024, nearly twice the $608 spent by couples whose oldest child was under 6.
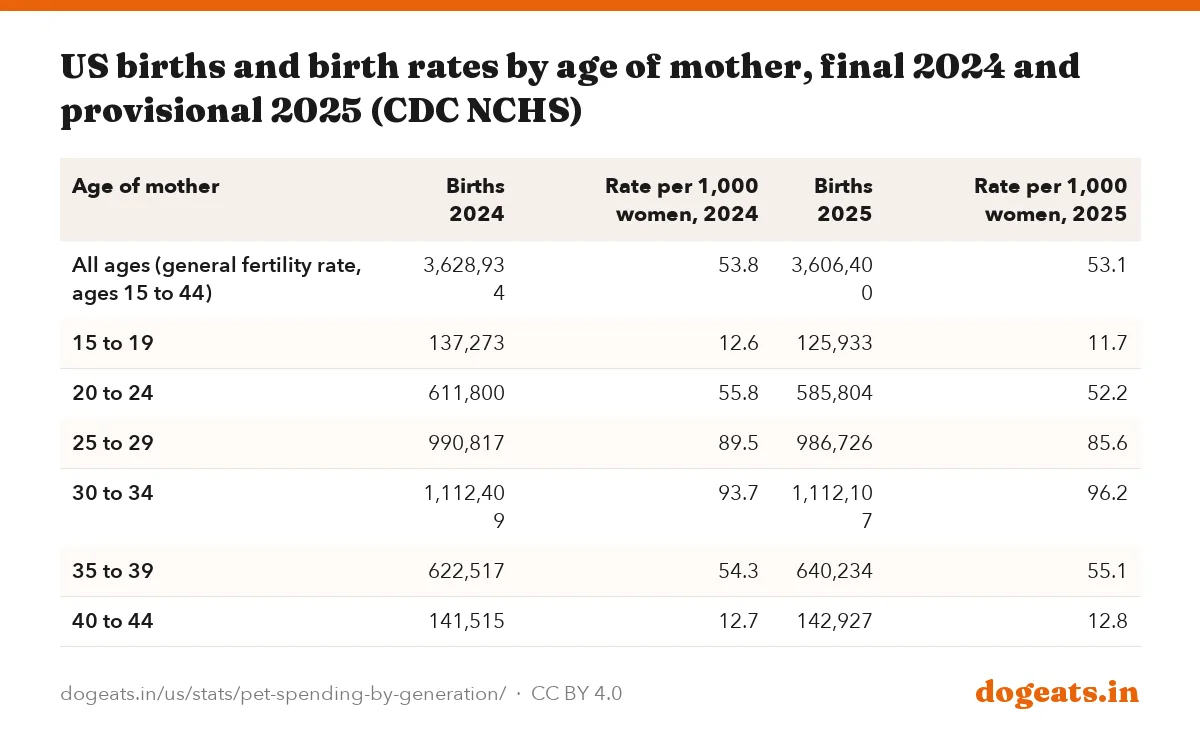
- US births fell to 3,606,400 in 2025, and the general fertility rate fell to 53.1 births per 1,000 women aged 15 to 44, CDC provisional data show.
How much does each generation spend on pets?
Gen X households spent the most on pets in 2024, $1,127 on average. Millennial households spent $909, slightly above the $880 average for all US households.
Baby boomer households spent $827 and households headed by someone born in 1945 or earlier spent $671. Gen Z households spent $353, the least of any generation.
These are averages across all households in each generation, including those with no pet. The BLS does not publish a figure for pet owners only.
Source: BLS Consumer Expenditure Surveys, generation of reference person, mean per household (consumer unit). Generation is that of the household reference person. Released December 2025.
Show the numbers
| Label | $ |
|---|---|
| Gen X | $1,127 |
| Millennials | $909 |
| All US households | $880 |
| Baby boomers | $827 |
| Born 1945 or earlier | $671 |
| Gen Z | $353 |
Embed this chart
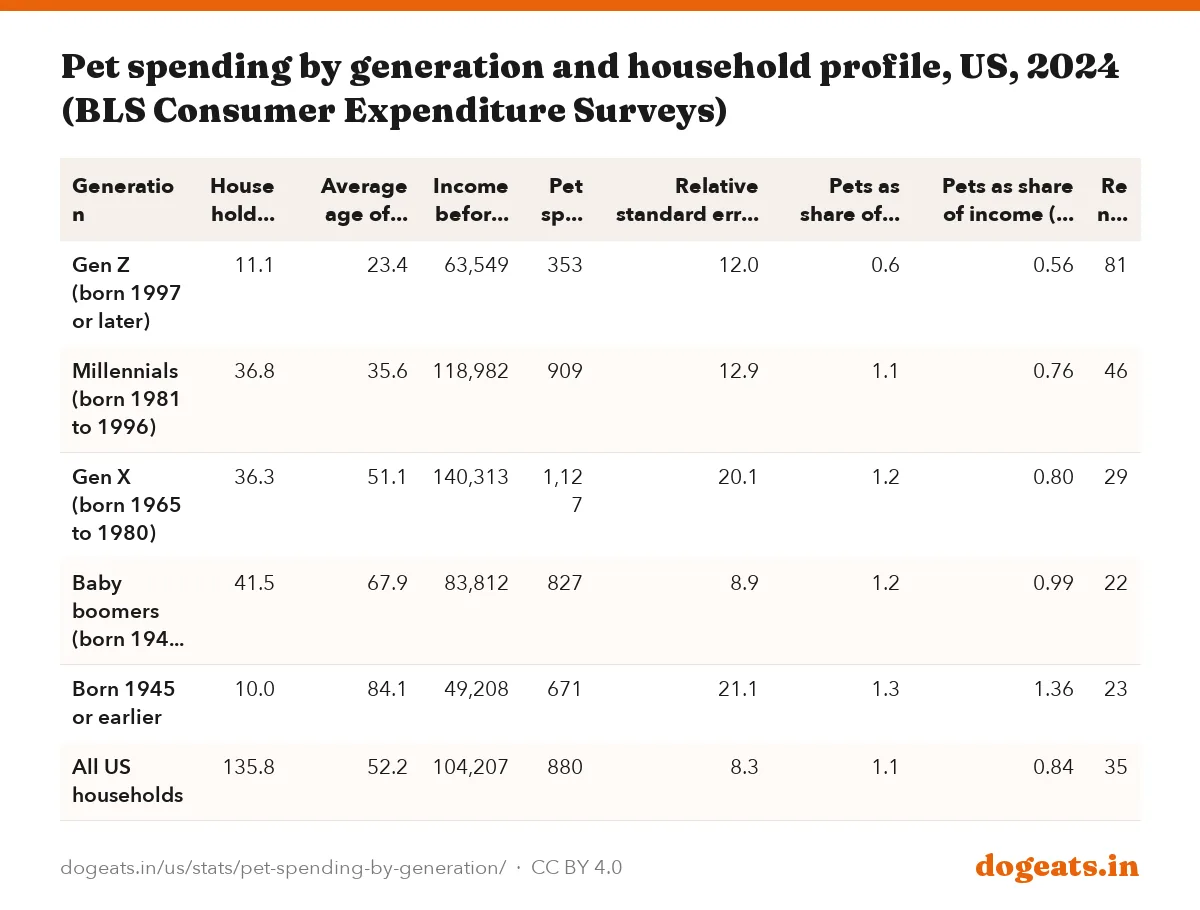
| Generation | Households (millions) | Average age of household head | Income before taxes ($) | Pet spending ($) | Relative standard error of pet spending (%) | Pets as share of total spending (%) | Pets as share of income (%, our calculation) | Renters (%) |
|---|---|---|---|---|---|---|---|---|
| Gen Z (born 1997 or later) | 11.1 | 23.4 | 63,549 | 353 | 12.0 | 0.6 | 0.56 | 81 |
| Millennials (born 1981 to 1996) | 36.8 | 35.6 | 118,982 | 909 | 12.9 | 1.1 | 0.76 | 46 |
| Gen X (born 1965 to 1980) | 36.3 | 51.1 | 140,313 | 1,127 | 20.1 | 1.2 | 0.80 | 29 |
| Baby boomers (born 1946 to 1964) | 41.5 | 67.9 | 83,812 | 827 | 8.9 | 1.2 | 0.99 | 22 |
| Born 1945 or earlier | 10.0 | 84.1 | 49,208 | 671 | 21.1 | 1.3 | 1.36 | 23 |
| All US households | 135.8 | 52.2 | 104,207 | 880 | 8.3 | 1.1 | 0.84 | 35 |
Older households spend a larger slice of their budgets on pets. Pets took 1.3% of spending for households born in 1945 or earlier and 0.6% for Gen Z.
Measured against income, the pattern is the same. Gen Z households put 0.56% of pre-tax income toward pets, against 1.36% for the oldest group.
Millennials have almost caught boomers in total pet spending
Millennials accounted for 28.6% of all US household pet spending in 2024, up from 21.4% in 2019. Boomers accounted for 28.7%, down from 37.5%.
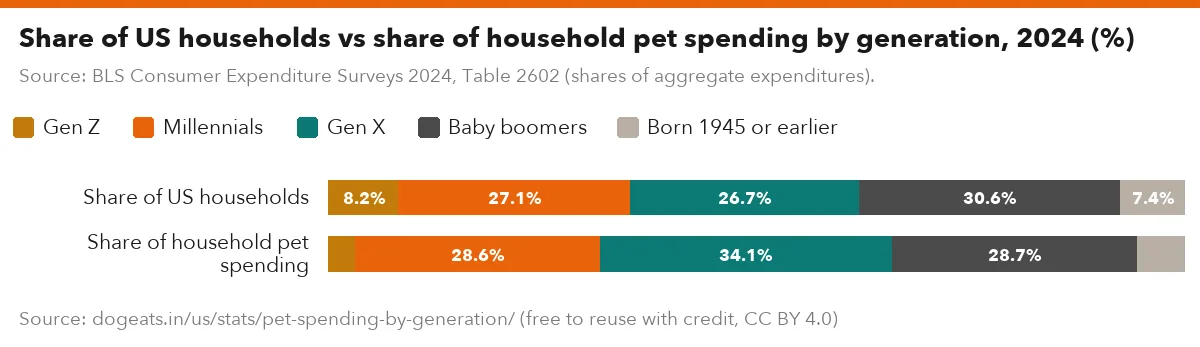
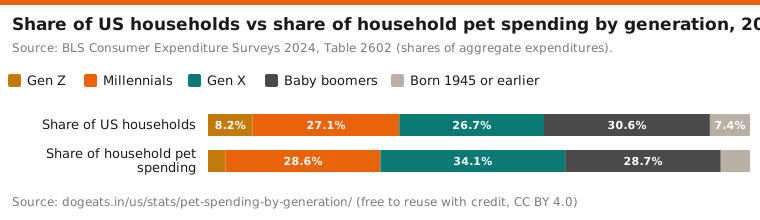
Gen X had the largest share, 34.1%. Gen Z had 3.2%, and the oldest generation 5.4%.
In dollars, millennial households spent about $34.1 billion on pets in 2024, up from about $19.3 billion in 2019. Boomer households spent about $34.2 billion, close to their 2019 total of $33.7 billion.
Millennials hold 27.1% of US households and 28.6% of household pet spending. Gen X holds 26.7% of households but 34.1% of pet spending.
Boomers are 30.6% of households and 28.7% of pet spending. Their number of households fell from 43.1 million in 2019 to 41.5 million in 2024.
The BLS suppressed the Gen Z share for 2022 because its relative standard error was 25% or more.
Millennial pet spending rose 58% in five years
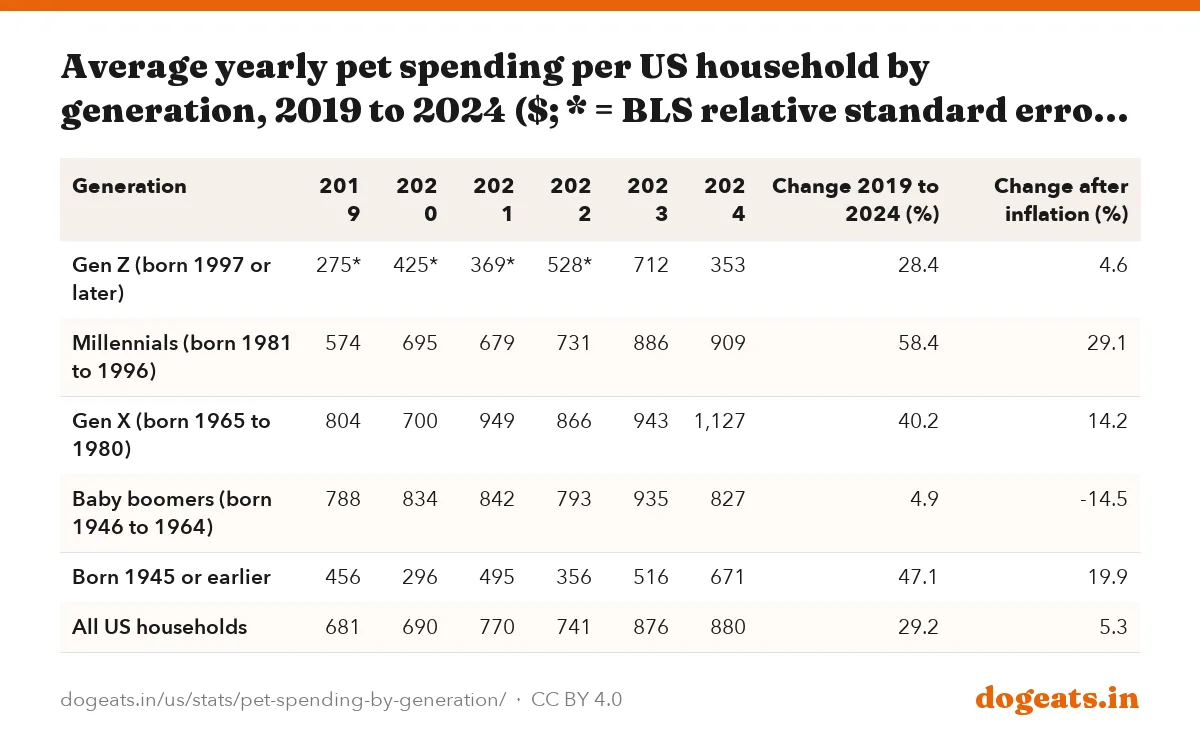
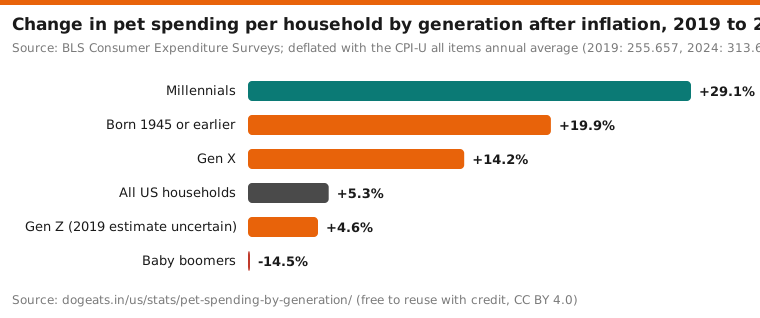
Average pet spending by millennial households rose from $574 in 2019 to $909 in 2024, a rise of 58.4%. After adjusting for inflation with the CPI, the rise was 29.1%.
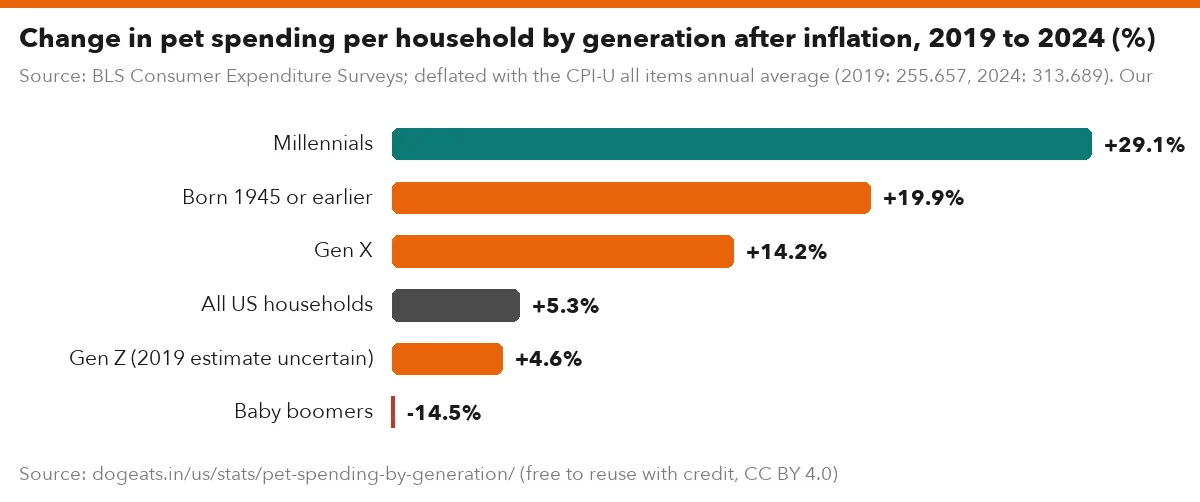
Gen X household spending rose 40.2% over the same years, or 14.2% after inflation. Boomer spending rose 4.9%, which was a 14.5% fall in real terms.
For all US households, pet spending rose 29.2% from $681 to $880. After inflation that was a gain of 5.3%.

Source: BLS Consumer Expenditure Surveys, generation of reference person, mean per household (consumer unit). Millennials are reference persons born 1981 to 1996.
Show the numbers
| Label | $ |
|---|---|
| 2019 | $574 |
| 2020 | $695 |
| 2021 | $679 |
| 2022 | $731 |
| 2023 | $886 |
| 2024 | $909 |
Embed this chart
Source: BLS Consumer Expenditure Surveys; deflated with the CPI-U all items annual average (2019: 255.657, 2024: 313.689). Our calculation. The Gen Z 2019 estimate has a relative standard error of 25% or more.
Show the numbers
| Label | % |
|---|---|
| Millennials | +29.1% |
| Born 1945 or earlier | +19.9% |
| Gen X | +14.2% |
| All US households | +5.3% |
| Gen Z (2019 estimate uncertain) | +4.6% |
| Baby boomers | -14.5% |
Embed this chart
| Generation | 2019 | 2020 | 2021 | 2022 | 2023 | 2024 | Change 2019 to 2024 (%) | Change after inflation (%) |
|---|---|---|---|---|---|---|---|---|
| Gen Z (born 1997 or later) | 275* | 425* | 369* | 528* | 712 | 353 | 28.4 | 4.6 |
| Millennials (born 1981 to 1996) | 574 | 695 | 679 | 731 | 886 | 909 | 58.4 | 29.1 |
| Gen X (born 1965 to 1980) | 804 | 700 | 949 | 866 | 943 | 1,127 | 40.2 | 14.2 |
| Baby boomers (born 1946 to 1964) | 788 | 834 | 842 | 793 | 935 | 827 | 4.9 | -14.5 |
| Born 1945 or earlier | 456 | 296 | 495 | 356 | 516 | 671 | 47.1 | 19.9 |
| All US households | 681 | 690 | 770 | 741 | 876 | 880 | 29.2 | 5.3 |
An asterisk marks an estimate the BLS flags as having a relative standard error of 25% or more. Every Gen Z figure from 2019 to 2022 carries that flag.
Gen Z pet spending jumped to $712 in 2023 and fell back to $353 in 2024. Swings that large in a small group are more likely sampling noise than a real change in behavior.
Generations also age. A millennial household head was 30.7 years old on average in 2019 and 35.6 in 2024, so part of the rise reflects people moving into higher-spending years.
Vet care takes a bigger share of older budgets
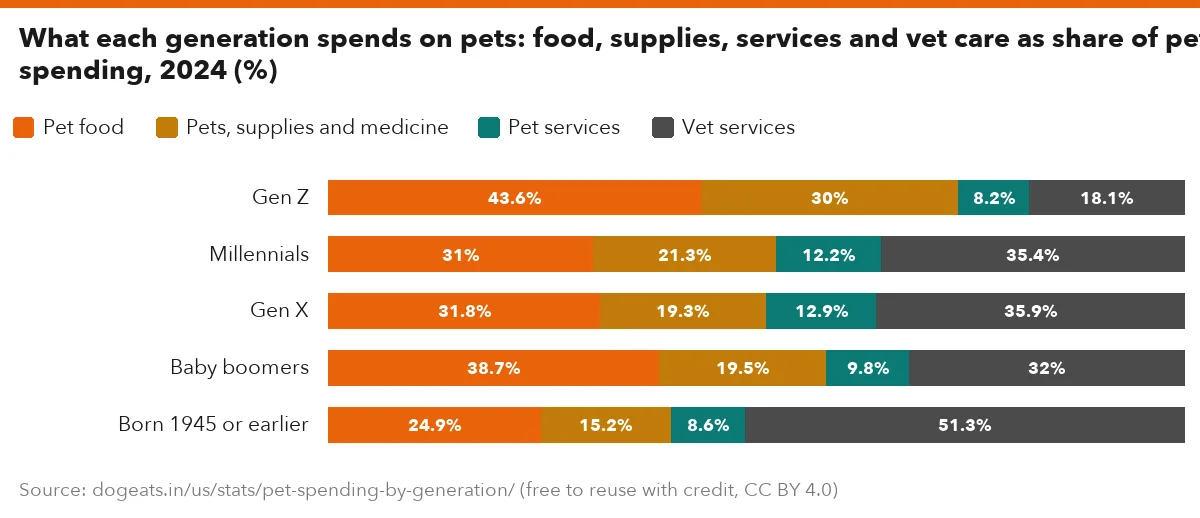
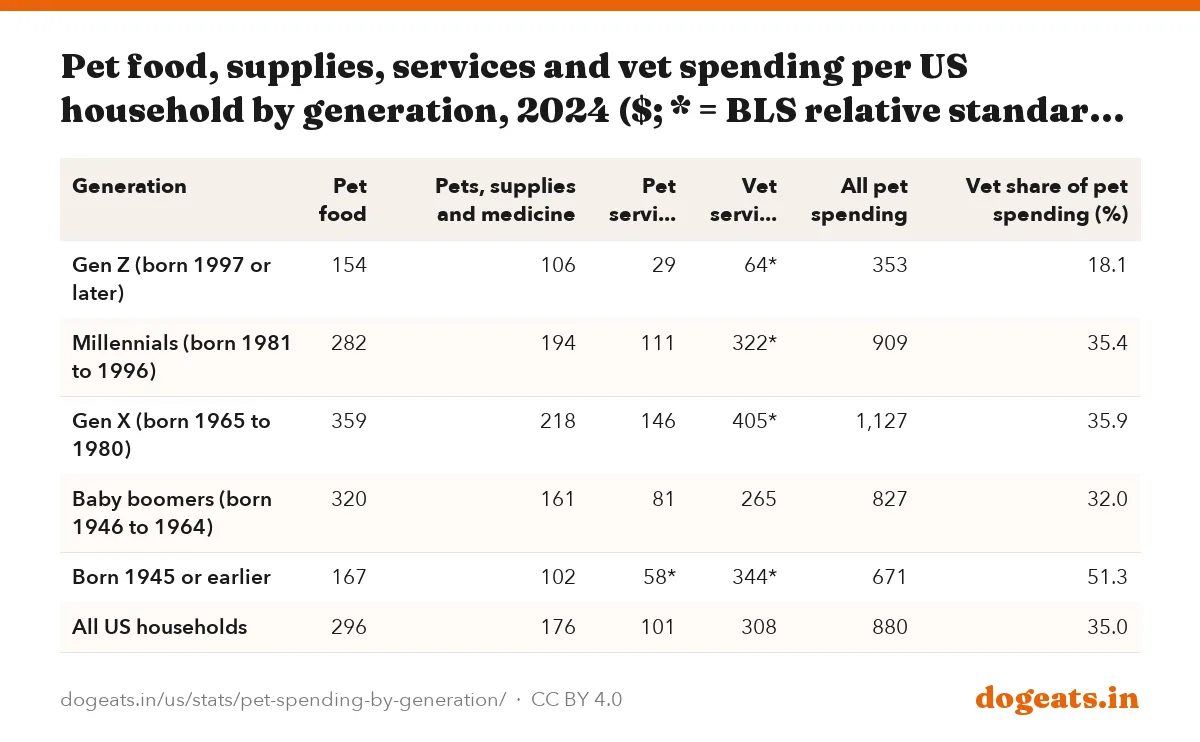
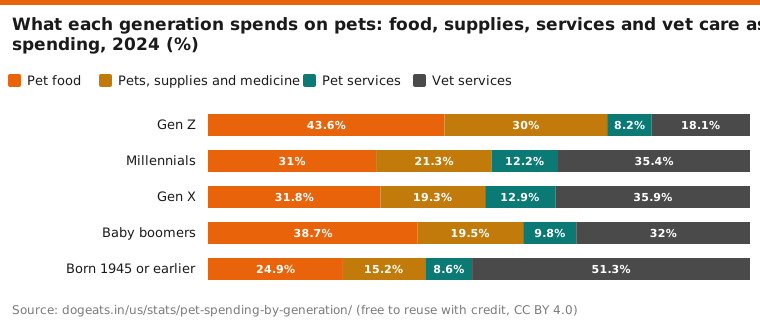
Food is the largest pet cost for Gen Z and boomer households. Gen Z households spent $154 on pet food in 2024, 43.6% of their pet budget.
Vet services took 35.4% of millennial pet spending and 35.9% for Gen X. Households born in 1945 or earlier put 51.3% of their pet spending toward the vet.
Grooming, boarding and other pet services remain small. Gen X households spent $146 on them in 2024 and millennial households $111.
Source: BLS Consumer Expenditure Surveys, generation of reference person, mean per household (consumer unit). Several vet estimates have a relative standard error of 25% or more (see table).
Show the numbers
| Label | Pet food | Pets, supplies and medicine | Pet services | Vet services |
|---|---|---|---|---|
| Gen Z | 154.0 | 106.0 | 29.0 | 64.0 |
| Millennials | 282.0 | 194.0 | 111.0 | 322.0 |
| Gen X | 359.0 | 218.0 | 146.0 | 405.0 |
| Baby boomers | 320.0 | 161.0 | 81.0 | 265.0 |
| Born 1945 or earlier | 167.0 | 102.0 | 58.0 | 344.0 |
Embed this chart
| Generation | Pet food | Pets, supplies and medicine | Pet services | Vet services | All pet spending | Vet share of pet spending (%) |
|---|---|---|---|---|---|---|
| Gen Z (born 1997 or later) | 154 | 106 | 29 | 64* | 353 | 18.1 |
| Millennials (born 1981 to 1996) | 282 | 194 | 111 | 322* | 909 | 35.4 |
| Gen X (born 1965 to 1980) | 359 | 218 | 146 | 405* | 1,127 | 35.9 |
| Baby boomers (born 1946 to 1964) | 320 | 161 | 81 | 265 | 827 | 32.0 |
| Born 1945 or earlier | 167 | 102 | 58* | 344* | 671 | 51.3 |
| All US households | 296 | 176 | 101 | 308 | 880 | 35.0 |
Vet estimates by generation are among the least precise numbers in the survey. Four of the five are flagged by the BLS, so read the vet column as a rough guide.
Prices matter here too. Our vet cost inflation tracker shows vet prices rising faster than overall inflation almost every year since 1998.
Pet spending by age: households under 35 more than doubled theirs since 2010
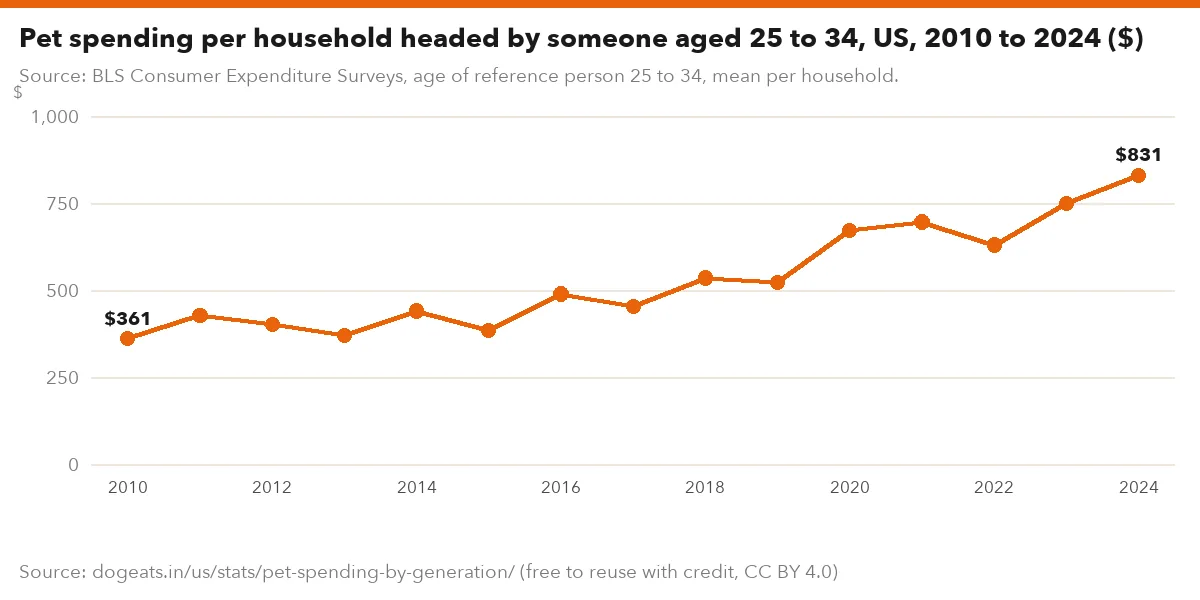
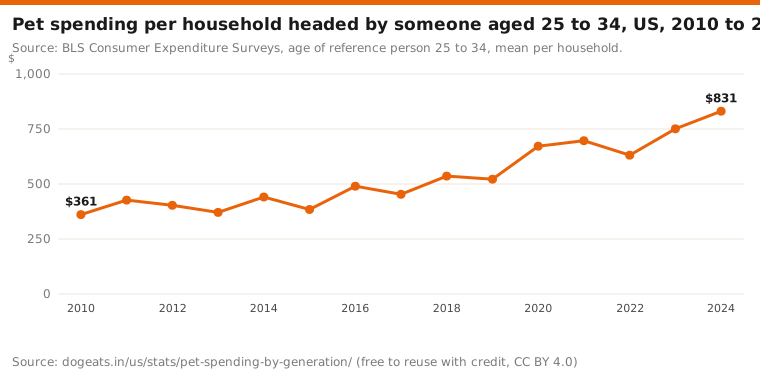
Households headed by someone aged 25 to 34 spent $831 on pets in 2024, up 130.2% from $361 in 2010. After inflation the rise was 60.0%.
All US households raised pet spending by 83.3% over the same period, or 27.4% after inflation. The 25 to 34 group grew faster than any other age band.
In 2024 that age group spent close to the national average, at 94% of it. In 2010 it spent 75% of the average.
Source: BLS Consumer Expenditure Surveys, age of reference person 25 to 34, mean per household.
Show the numbers
| Label | $ |
|---|---|
| 2010 | $361 |
| 2011 | $427 |
| 2012 | $403 |
| 2013 | $371 |
| 2014 | $441 |
| 2015 | $384 |
| 2016 | $490 |
| 2017 | $453 |
| 2018 | $536 |
| 2019 | $522 |
| 2020 | $672 |
| 2021 | $697 |
| 2022 | $631 |
| 2023 | $751 |
| 2024 | $831 |
Embed this chart
| Year | Under 25 | 25 to 34 | 35 to 44 | 45 to 54 | 55 to 64 | 65 and over | All households |
|---|---|---|---|---|---|---|---|
| 2010 | 170 | 361 | 534 | 600 | 559 | 440 | 480 |
| 2011 | 279 | 427 | 465 | 625 | 636 | 426 | 502 |
| 2012 | 185 | 403 | 514 | 620 | 740 | 455 | 522 |
| 2013 | 177 | 371 | 473 | 586 | 625 | 353 | 460 |
| 2014 | 158 | 441 | 505 | 600 | 669 | 454 | 507 |
| 2015 | 209 | 384 | 467 | 645 | 763 | 478 | 528 |
| 2016 | 233 | 490 | 610 | 678 | 784 | 492 | 583 |
| 2017 | 239 | 453 | 853 | 981* | 907 | 549 | 710 |
| 2018 | 270 | 536 | 700 | 868 | 756 | 600 | 662 |
| 2019 | 313 | 522 | 730 | 880 | 874 | 563 | 681 |
| 2020 | 382* | 672 | 873* | 590 | 1,010* | 462 | 690 |
| 2021 | 352* | 697 | 912 | 840 | 766 | 764 | 770 |
| 2022 | 473* | 631 | 871 | 861 | 900 | 591 | 741 |
| 2023 | 687* | 751 | 958 | 949 | 1,041 | 772 | 876 |
| 2024 | 200 | 831 | 866 | 1,266* | 959 | 752 | 880 |
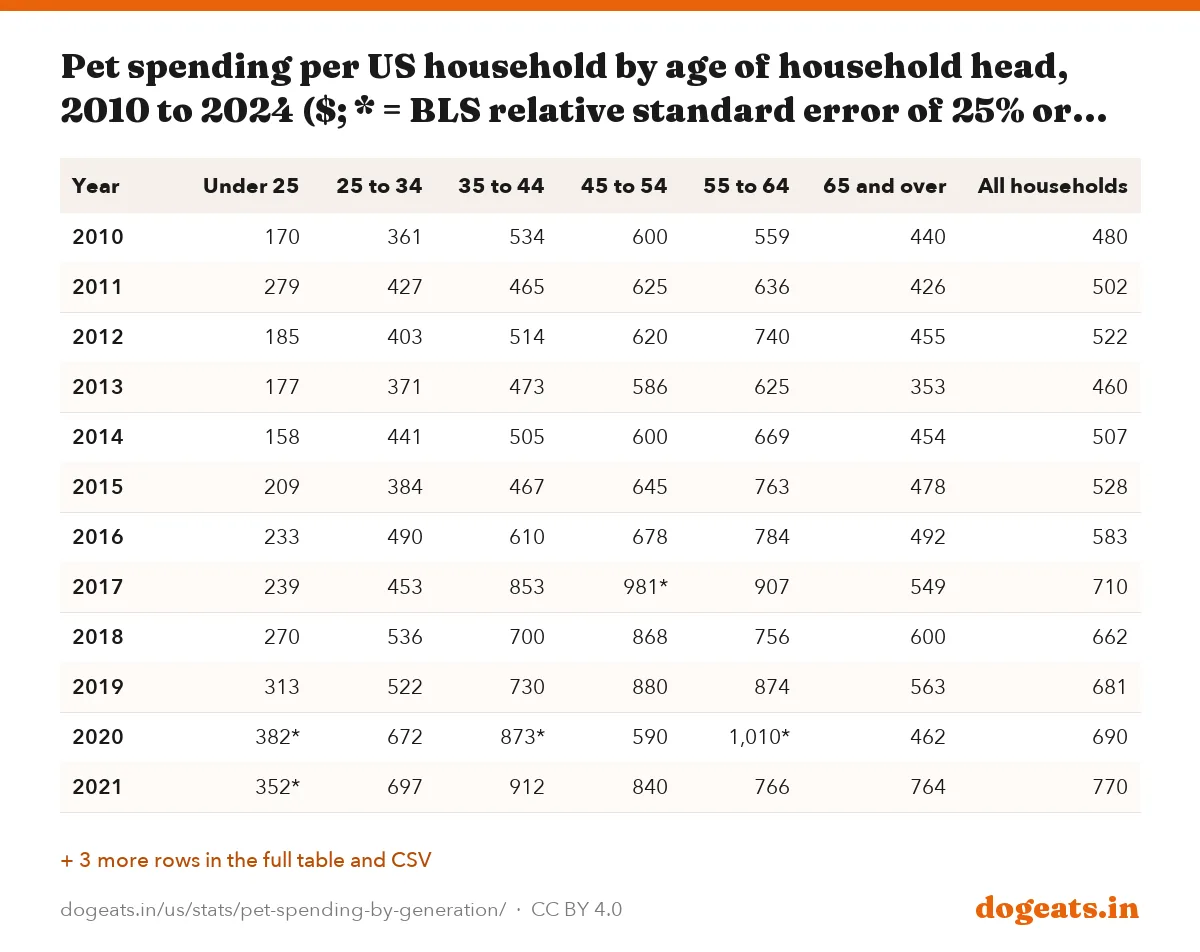
Households aged 45 to 54 had the highest figure in 2024, $1,266, but the BLS flags that estimate as imprecise. Households under 25 spent $200, after an imprecise $687 in 2023.
Age bands and generations overlap but are not the same thing. In 2024 everyone in the 25 to 34 band was a millennial or Gen Z.
Are millennials having pets instead of babies?
The data do not show millennials swapping children for pets. Millennial households had 1.2 children under 18 on average in 2024, more than any other generation, against 0.6 for all households.
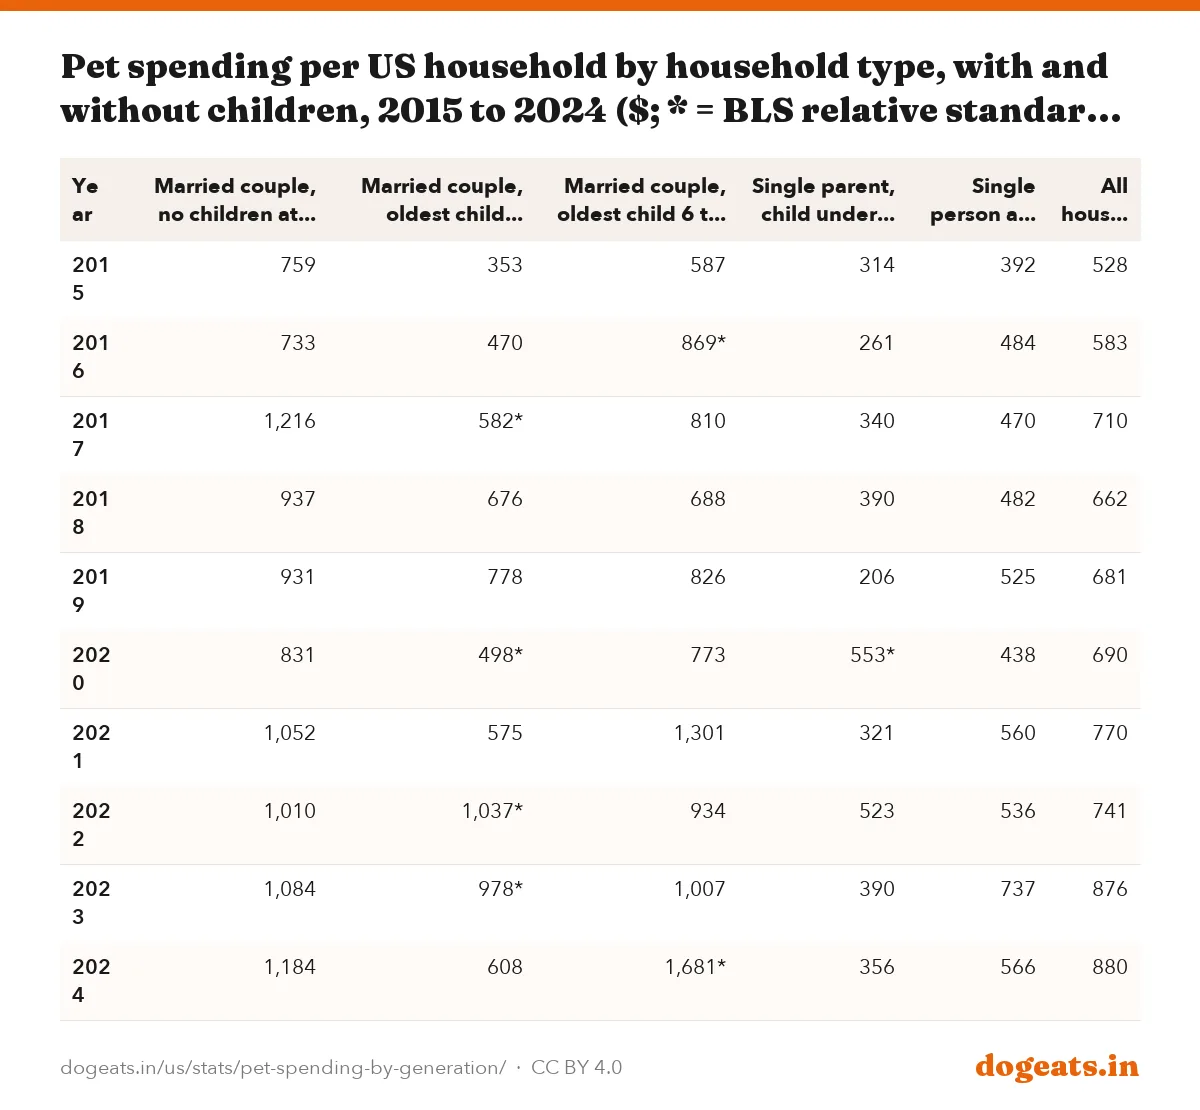
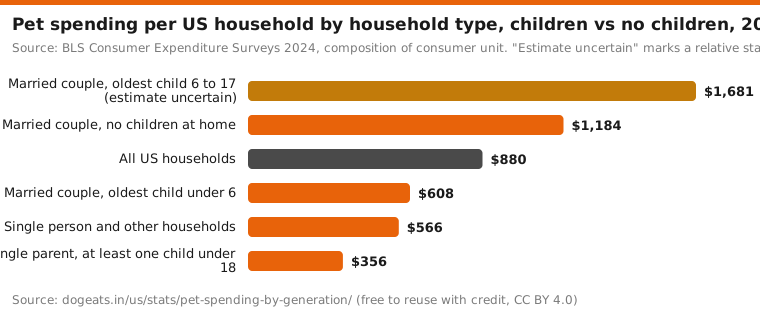
Pet spending does vary with family stage. Married couples with no children at home spent $1,184 on pets in 2024. Couples whose oldest child was under 6 spent $608.
Couples whose oldest child was 6 to 17 spent $1,681, the most of any household type. The BLS flags that estimate as imprecise.

Source: BLS Consumer Expenditure Surveys 2024, composition of consumer unit. "Estimate uncertain" marks a relative standard error of 25% or more.
Show the numbers
| Label | $ |
|---|---|
| Married couple, oldest child 6 to 17 (estimate uncertain) | $1,681 |
| Married couple, no children at home | $1,184 |
| All US households | $880 |
| Married couple, oldest child under 6 | $608 |
| Single person and other households | $566 |
| Single parent, at least one child under 18 | $356 |
Embed this chart
| Year | Married couple, no children at home | Married couple, oldest child under 6 | Married couple, oldest child 6 to 17 | Single parent, child under 18 | Single person and other | All households |
|---|---|---|---|---|---|---|
| 2015 | 759 | 353 | 587 | 314 | 392 | 528 |
| 2016 | 733 | 470 | 869* | 261 | 484 | 583 |
| 2017 | 1,216 | 582* | 810 | 340 | 470 | 710 |
| 2018 | 937 | 676 | 688 | 390 | 482 | 662 |
| 2019 | 931 | 778 | 826 | 206 | 525 | 681 |
| 2020 | 831 | 498* | 773 | 553* | 438 | 690 |
| 2021 | 1,052 | 575 | 1,301 | 321 | 560 | 770 |
| 2022 | 1,010 | 1,037* | 934 | 523 | 536 | 741 |
| 2023 | 1,084 | 978* | 1,007 | 390 | 737 | 876 |
| 2024 | 1,184 | 608 | 1,681* | 356 | 566 | 880 |
Births are falling slowly. The CDC counted 3,606,400 provisional births in 2025, down from 3,628,934 in 2024. The general fertility rate fell to 53.1 births per 1,000 women aged 15 to 44, from 53.8.
| Age of mother | Births 2024 | Rate per 1,000 women, 2024 | Births 2025 | Rate per 1,000 women, 2025 |
|---|---|---|---|---|
| All ages (general fertility rate, ages 15 to 44) | 3,628,934 | 53.8 | 3,606,400 | 53.1 |
| 15 to 19 | 137,273 | 12.6 | 125,933 | 11.7 |
| 20 to 24 | 611,800 | 55.8 | 585,804 | 52.2 |
| 25 to 29 | 990,817 | 89.5 | 986,726 | 85.6 |
| 30 to 34 | 1,112,409 | 93.7 | 1,112,107 | 96.2 |
| 35 to 39 | 622,517 | 54.3 | 640,234 | 55.1 |
| 40 to 44 | 141,515 | 12.7 | 142,927 | 12.8 |
Birth rates fell for women in their twenties and rose slightly for women in their thirties. The rate for ages 25 to 29 fell 4.4%, while the rate for ages 30 to 34 rose 2.7%.
The CDC says the general fertility rate has declined by 23% since 2007. Those years overlap with rising pet spending, but neither data set can show that one causes the other.
Gen Z pet ownership is common, but budgets are small
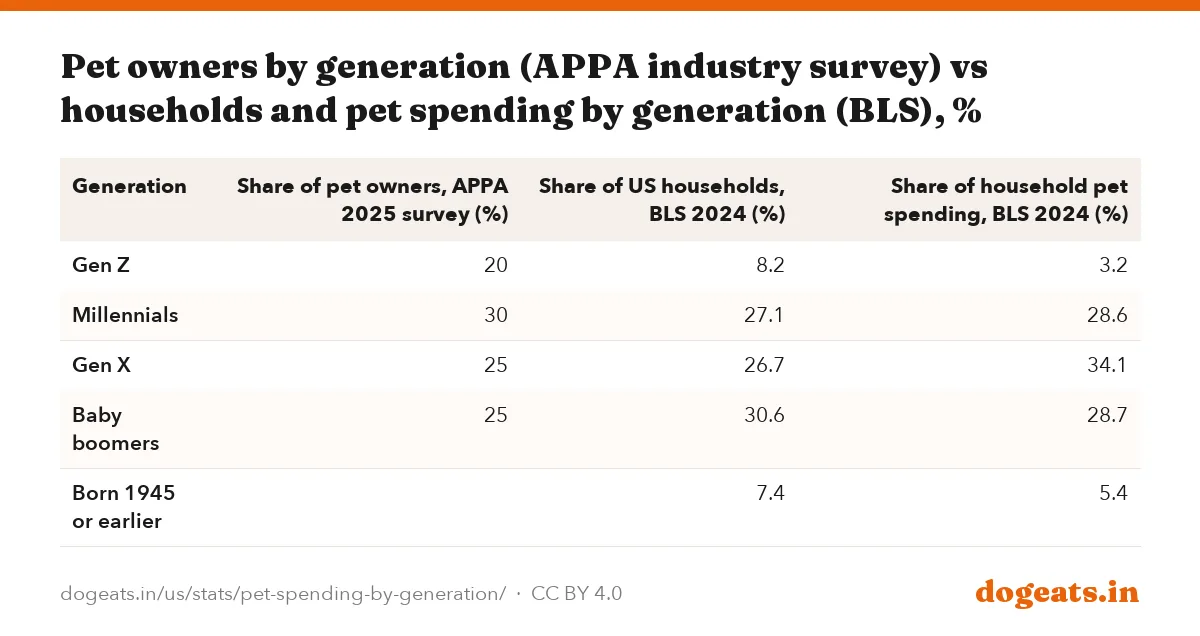
In the pet industry's 2025 survey, Gen Z made up 20% of pet owners. The American Pet Products Association (APPA), a trade group, put millennials at 30% and Gen X and boomers at 25% each.
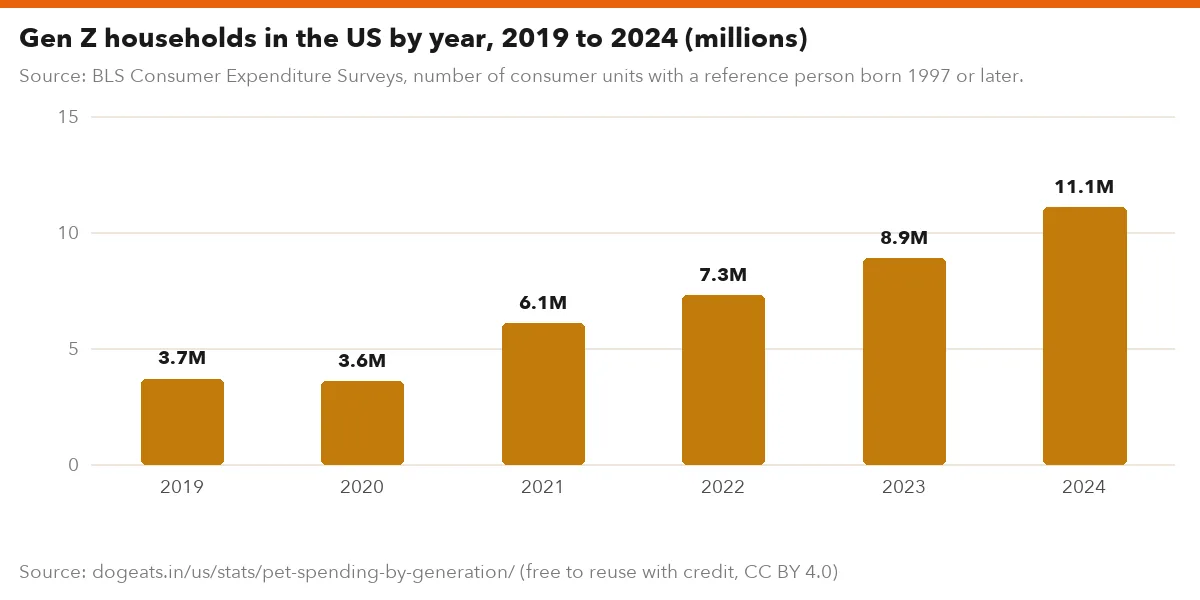
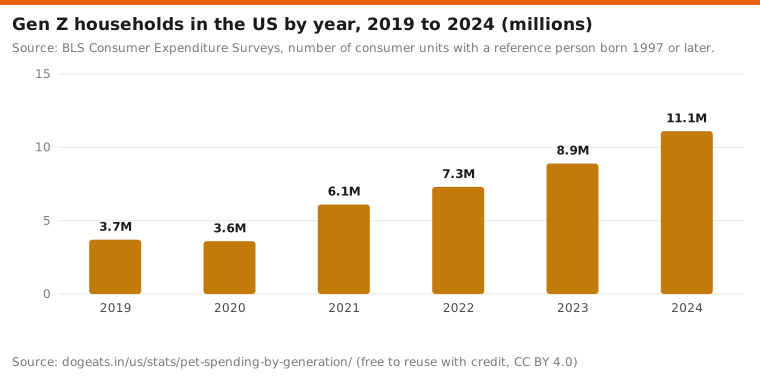
The BLS count of households tells a different story about money. Gen Z headed 8.2% of US households in 2024 and accounted for 3.2% of household pet spending.
Gen Z households had an average income of $63,549, about half the millennial figure of $118,982. Some 81% rented their home.
Source: BLS Consumer Expenditure Surveys, number of consumer units with a reference person born 1997 or later.
Show the numbers
| Label | Value |
|---|---|
| 2019 | 3.7M |
| 2020 | 3.6M |
| 2021 | 6.1M |
| 2022 | 7.3M |
| 2023 | 8.9M |
| 2024 | 11.1M |
Embed this chart
| Generation | Share of pet owners, APPA 2025 survey (%) | Share of US households, BLS 2024 (%) | Share of household pet spending, BLS 2024 (%) |
|---|---|---|---|
| Gen Z | 20 | 8.2 | 3.2 |
| Millennials | 30 | 27.1 | 28.6 |
| Gen X | 25 | 26.7 | 34.1 |
| Baby boomers | 25 | 30.6 | 28.7 |
| Born 1945 or earlier | 7.4 | 5.4 |
The number of Gen Z households tripled from 3.7 million in 2019 to 11.1 million in 2024 as more of the generation left home.
The two sources measure different things. APPA surveys pet owners, while the BLS counts all households and what they spend, so the shares are not directly comparable.
Renting matters for pet budgets. Renters spent $386 on pets in 2024 and homeowners $1,147. Our pet rent and deposit laws by state report covers the extra fees renters can face.
How much do Americans spend on pets per year?
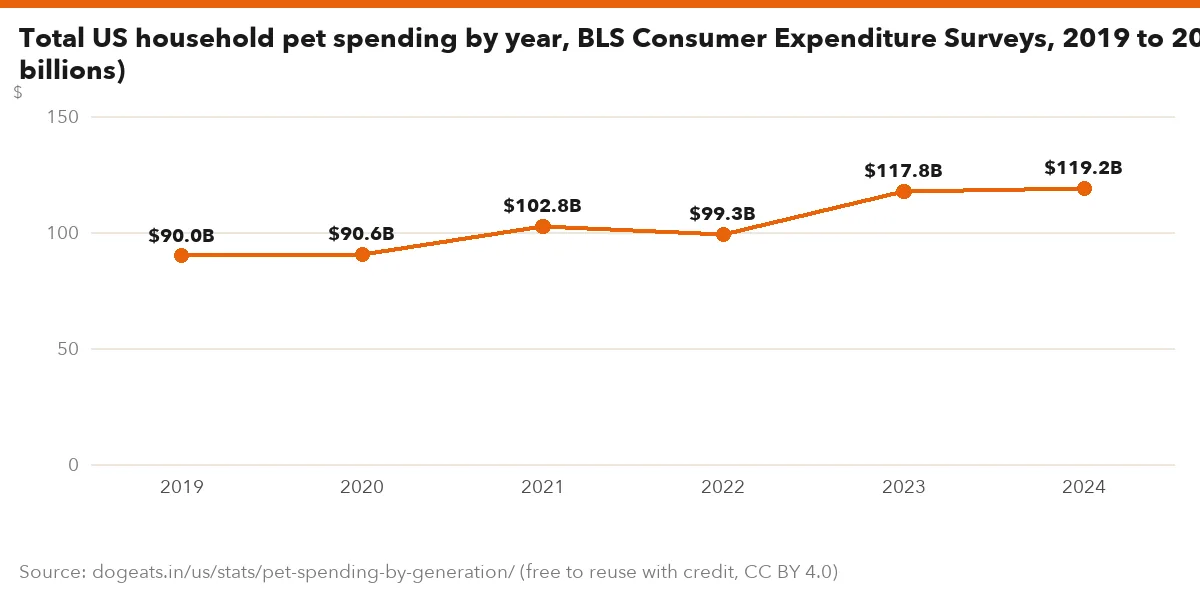
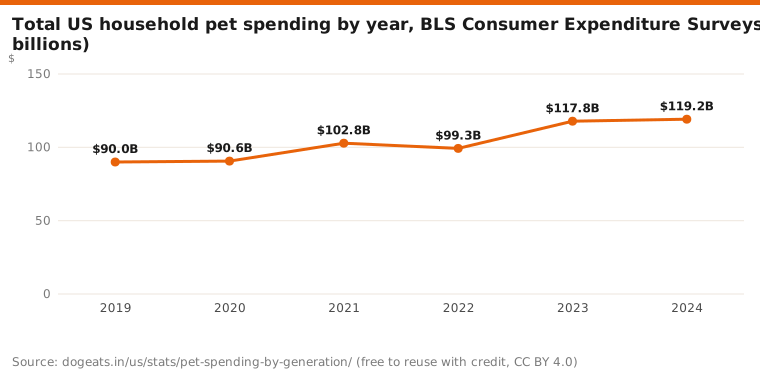
US households spent $119.2 billion on pets in 2024, according to the BLS Consumer Expenditure Surveys. That was up 1.2% from $117.8 billion in 2023 and 32.5% from $90.0 billion in 2019.
After inflation, household pet spending rose 8.0% from 2019 to 2024. The average household spent $880.
The pet industry measures a bigger total. APPA estimates $158 billion in US pet industry spending in 2025, up 3.7%, and projects $165 billion for 2026.
Source: BLS Consumer Expenditure Surveys, Table 2602, aggregate expenditure on pets.
Show the numbers
| Label | $ |
|---|---|
| 2019 | $90.0B |
| 2020 | $90.6B |
| 2021 | $102.8B |
| 2022 | $99.3B |
| 2023 | $117.8B |
| 2024 | $119.2B |
Embed this chart
APPA counts sales to all buyers and the BLS counts only what households report. Our pet industry spending report compares the two sources in detail.
APPA says 95 million US households owned at least one pet in 2025. It reported 71 million dog-owning households, 53% of all households, and said Gen X dog ownership rose 12%.
Pet spending by region and housing
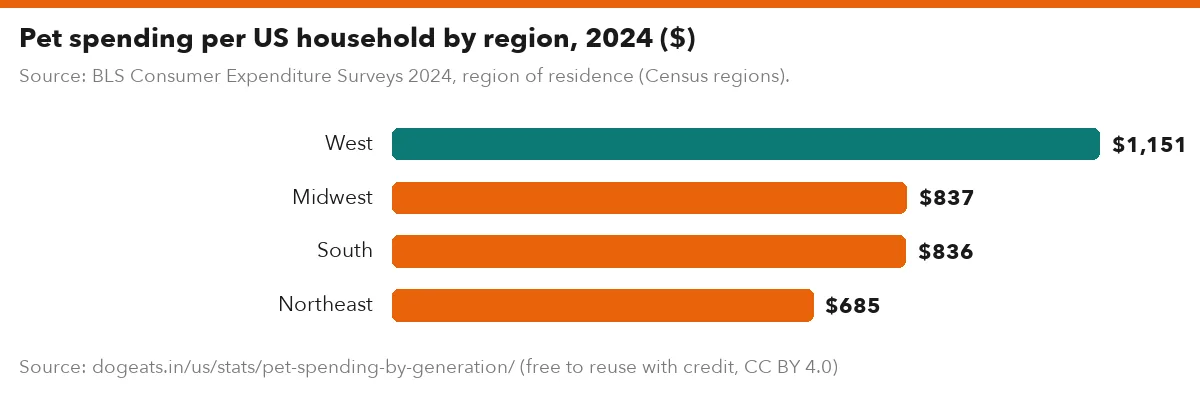
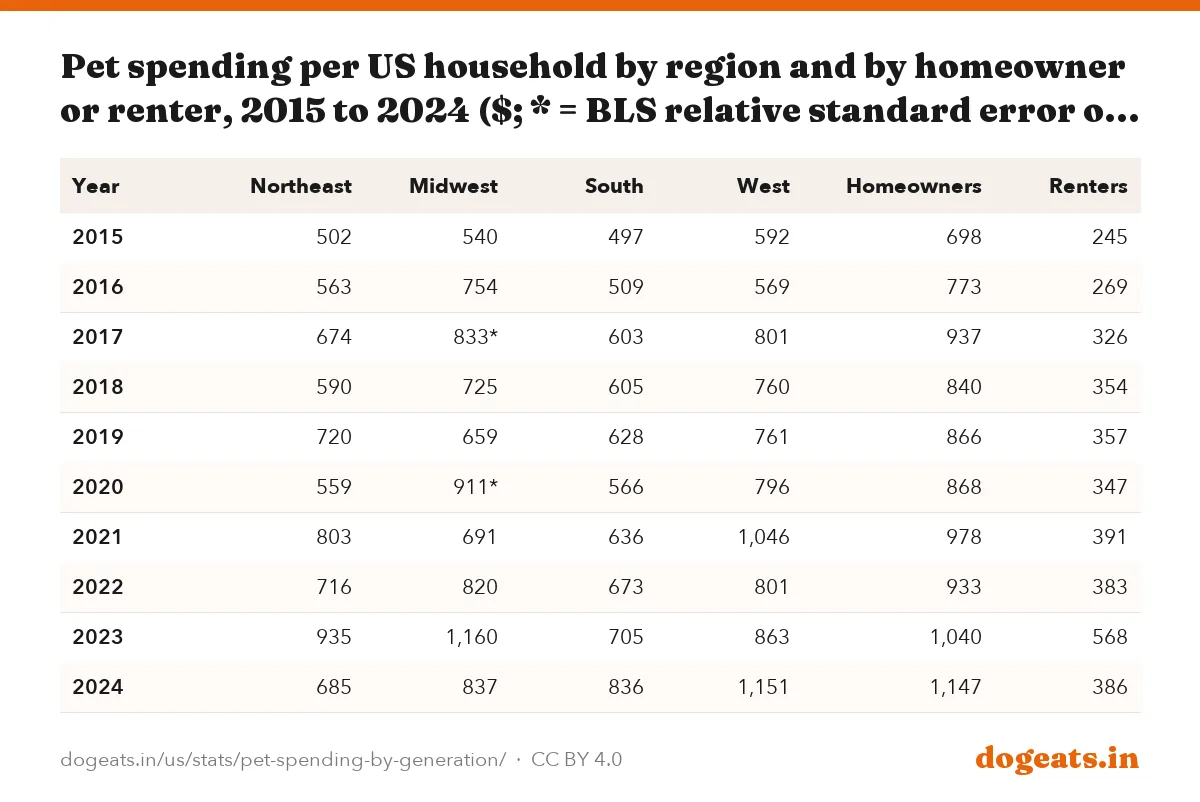
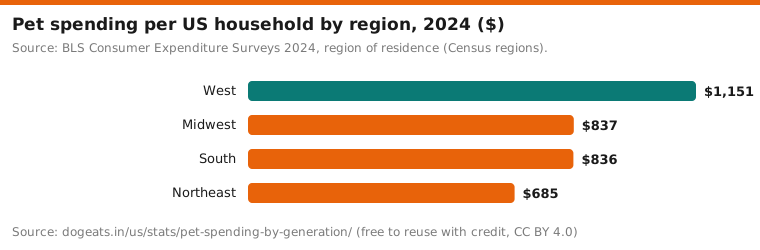
Households in the West spent the most on pets in 2024, $1,151 on average. The Midwest spent $837, the South $836 and the Northeast $685.
Western households spent 1.68 times as much as those in the Northeast. Western pet spending rose 94.4% from 2015, the fastest of the four regions.
Homeowners spent $1,147 on pets in 2024, nearly three times the $386 spent by renters. Renter spending rose 57.6% from 2015 and owner spending 64.3%.

Source: BLS Consumer Expenditure Surveys 2024, region of residence (Census regions).
Show the numbers
| Label | $ |
|---|---|
| West | $1,151 |
| Midwest | $837 |
| South | $836 |
| Northeast | $685 |
Embed this chart
| Year | Northeast | Midwest | South | West | Homeowners | Renters |
|---|---|---|---|---|---|---|
| 2015 | 502 | 540 | 497 | 592 | 698 | 245 |
| 2016 | 563 | 754 | 509 | 569 | 773 | 269 |
| 2017 | 674 | 833* | 603 | 801 | 937 | 326 |
| 2018 | 590 | 725 | 605 | 760 | 840 | 354 |
| 2019 | 720 | 659 | 628 | 761 | 866 | 357 |
| 2020 | 559 | 911* | 566 | 796 | 868 | 347 |
| 2021 | 803 | 691 | 636 | 1,046 | 978 | 391 |
| 2022 | 716 | 820 | 673 | 801 | 933 | 383 |
| 2023 | 935 | 1,160 | 705 | 863 | 1,040 | 568 |
| 2024 | 685 | 837 | 836 | 1,151 | 1,147 | 386 |
The BLS does not publish pet spending by state. Region is the finest geographic level in these tables. For where dogs are most common, see our dog ownership statistics.
What generation data can and cannot show
The Consumer Expenditure Surveys interview a sample of households, so every figure here is an estimate. The BLS puts the relative standard error of the 2024 all-household pet figure at 8.28%, and at 20.09% for Gen X.
Generation is assigned by the birth year of the household reference person, usually the person who owns or rents the home. A Gen Z adult living with boomer parents counts as a boomer household.
Averages include households with no pet. A generation with fewer pet owners will show lower spending even if each owner spends the same. For the cost of one dog, see our cost of owning a dog report.
- BLS 2025 Consumer Expenditure data were not yet released on October 11, 2026, so 2024 is the latest year. The BLS has scheduled the 2025 release for October 29, 2026.
- No data were collected in October and November 2025 during the lapse in federal appropriations. The BLS says it will adjust survey weights for the 2025 release.
- APPA figures come from an industry survey and are not directly comparable with the BLS household survey.
Frequently asked questions
How much do millennials spend on pets?
Millennial households spent $909 on pets in 2024, according to the BLS Consumer Expenditure Surveys. That was up from $574 in 2019, a rise of 58%. Millennials accounted for 28.6% of all US household pet spending.
Which generation spends the most on pets?
Gen X households spent the most on average in 2024, $1,127, and the most in total, 34.1% of household pet spending. The Gen X estimate is imprecise, so its lead over millennials at $909 is not certain.
How much does Gen Z spend on pets?
Gen Z households spent $353 on pets in 2024, 0.6% of their total spending. Most Gen Z households are young renters with lower incomes, averaging $63,549 before taxes.
Are millennials having pets instead of babies?
The spending data do not show that. Millennial households had 1.2 children under 18 on average in 2024, the most of any generation. Couples with young children do spend less on pets, $608 against $1,184 for couples with no children at home.
How much do Americans spend on pets per year?
US households spent $119.2 billion on pets in 2024, or $880 per household, by the BLS count. The pet industry group APPA estimates $158 billion in total industry spending for 2025 and projects $165 billion for 2026.
What share of pet owners are Gen Z?
In APPA's 2025 industry survey, Gen Z made up 20% of US pet owners and millennials 30%. Gen X and boomers made up 25% each.
Do older people spend more on pets?
They spend a larger share of their budget. Households born in 1945 or earlier put 1.3% of spending toward pets in 2024, against 0.6% for Gen Z. In dollars, households aged 45 to 64 spend the most.
Where does this pet spending data come from?
From the US Bureau of Labor Statistics Consumer Expenditure Surveys, released in December 2025 for 2024. We downloaded the series from the BLS data API and published tables and computed changes and inflation adjustments ourselves.
Methodology and limitations
We downloaded annual mean expenditure on pets and its four components from the BLS public data API on October 11, 2026. Groupings are generation, age, household type, region and housing tenure of the reference person.
Generation shares of total pet spending and the dollar totals come from the BLS Table 2602 workbooks for 2019 to 2024. Standard errors are from the 2024 workbook. Dollar totals by generation are those shares applied to the BLS aggregate.
Inflation adjustments use the CPI-U all items annual average. Asterisks mark estimates that the BLS footnotes as having a relative standard error of 25% or more.
Births come from the CDC NCHS Vital Statistics Rapid Release report 43 (April 2026). APPA figures are industry survey results, taken from APPA releases and trade press coverage.
Sources
- US Bureau of Labor Statistics, Consumer Expenditure Surveys 2024, Table 2602: generation of reference person (means, shares, standard errors), Pet spending by generation, 2024, with standard errors
- US Bureau of Labor Statistics, Consumer Expenditure Surveys 2024, Table 2602: shares of aggregate expenditures by generation, Generation shares of total pet spending and the $119.2 billion total
- CDC National Center for Health Statistics, Births: Provisional Data for 2025, VSRR report 43 (April 2026), Births and birth rates by age, 2024 and 2025
- Also consulted: BLS, Consumer Expenditure Surveys series CXUPETSLB0101M and related pets series (API download October 11, 2026), BLS, Table 2602 aggregate shares by generation, 2019 to 2023 editions, BLS, Consumer Expenditure Surveys home page, BLS, Consumer Expenditure Surveys notice on 2024 and 2025 two-year tables (October 6, 2026), BLS Monthly Labor Review, Addressing missing Consumer Expenditure data due to the 2025 lapse in appropriations (June 2026), CDC NCHS press release, U.S. births down 1% in 2025 (April 9, 2026), APPA, 2026 State of the Industry release (May 11, 2026), industry data, PetfoodIndustry, coverage of the APPA 2025 National Pet Owners Survey (June 2025, archived), BLS, CPI-U all items, US city average.
Cite, embed and download
This report, its data and its images are free to reuse under a Creative Commons Attribution 4.0 licence. Credit dogeats.in with a link to this page. Every chart has its own embed code, every table has a CSV and an image download, and the images below are ready for social posts, slides and articles.
Cite this report
Link to this report
Every chart and table as an image