Data report · Updated October 2026
Dog-related injuries in the United States beyond bites: falls, leash injuries and fractures
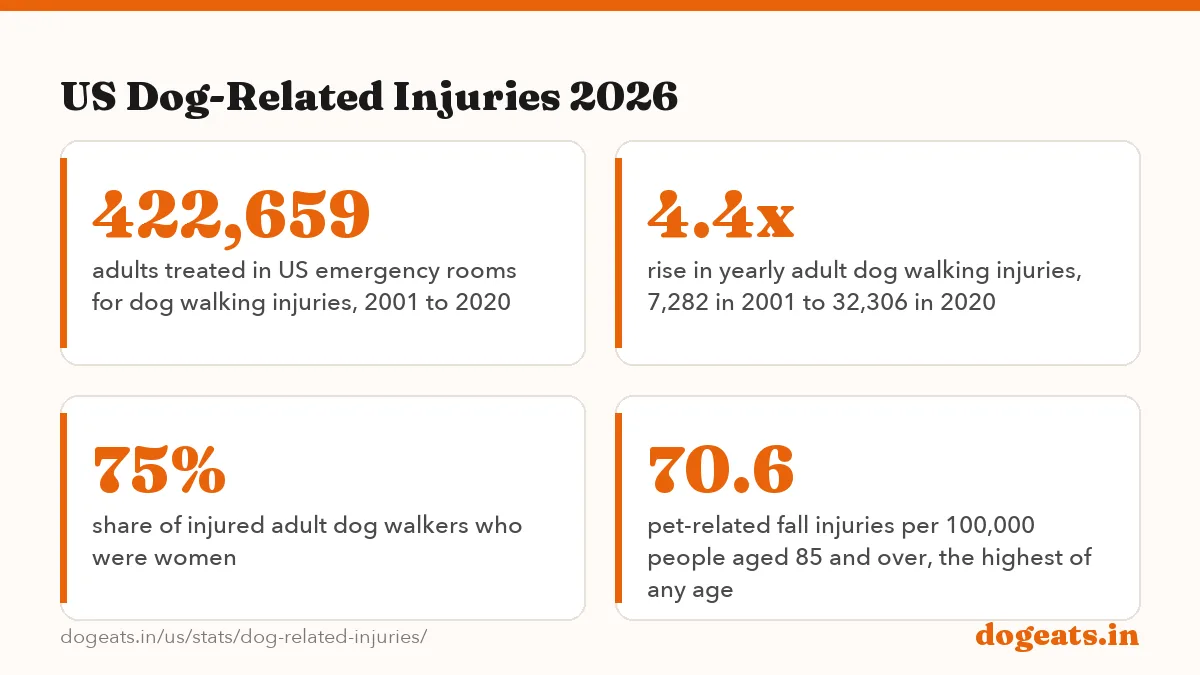
Dogs send tens of thousands of Americans to the emergency room each year without biting anyone. CDC data put falls linked to dogs at about 76,000 ER visits a year in 2001 to 2006. ER visits for adult dog walking injuries rose from 7,282 in 2001 to 32,306 in 2020, and three in four of those hurt were women.

Key findings
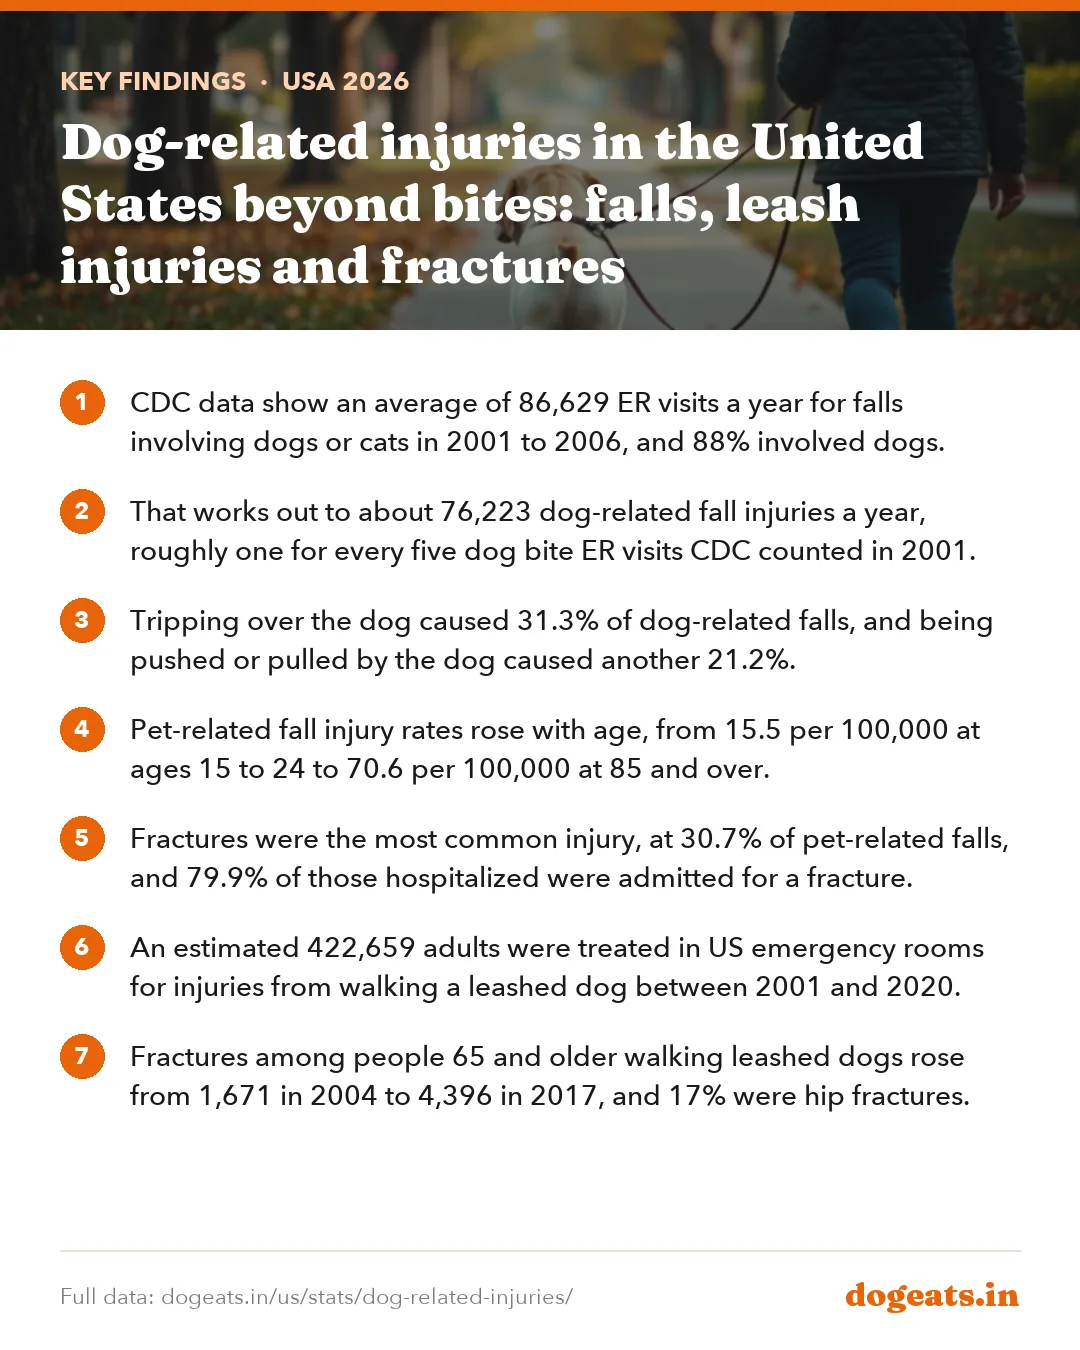
- CDC data show an average of 86,629 ER visits a year for falls involving dogs or cats in 2001 to 2006, and 88% involved dogs.
- That works out to about 76,223 dog-related fall injuries a year, roughly one for every five dog bite ER visits CDC counted in 2001.
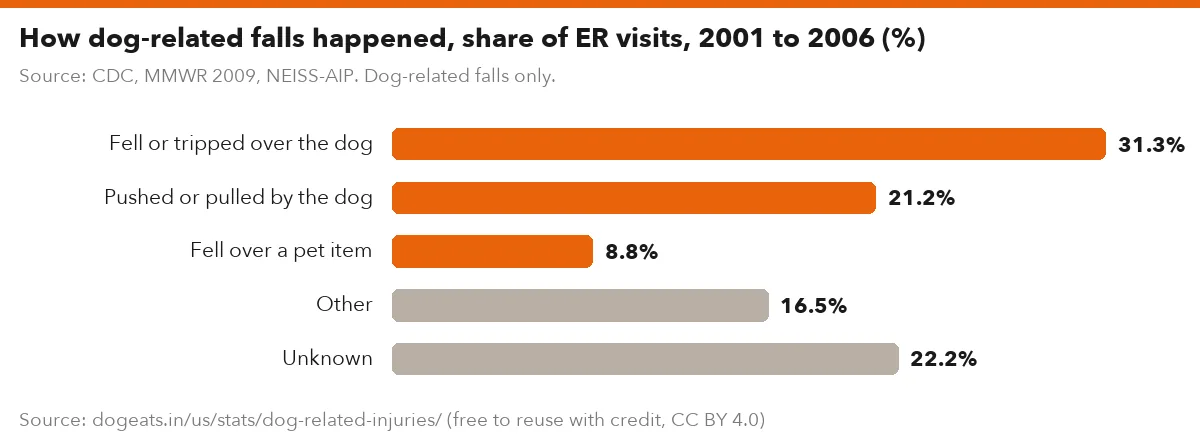
- Tripping over the dog caused 31.3% of dog-related falls, and being pushed or pulled by the dog caused another 21.2%.
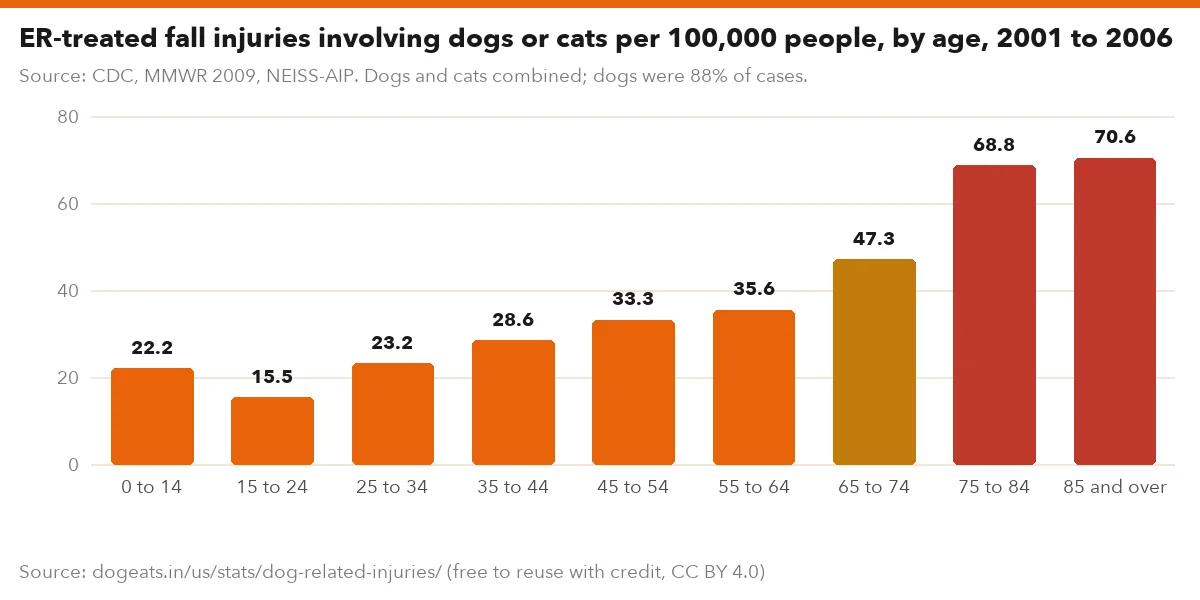
- Pet-related fall injury rates rose with age, from 15.5 per 100,000 at ages 15 to 24 to 70.6 per 100,000 at 85 and over.
- Fractures were the most common injury, at 30.7% of pet-related falls, and 79.9% of those hospitalized were admitted for a fracture.
- An estimated 422,659 adults were treated in US emergency rooms for injuries from walking a leashed dog between 2001 and 2020.
- Fractures among people 65 and older walking leashed dogs rose from 1,671 in 2004 to 4,396 in 2017, and 17% were hip fractures.
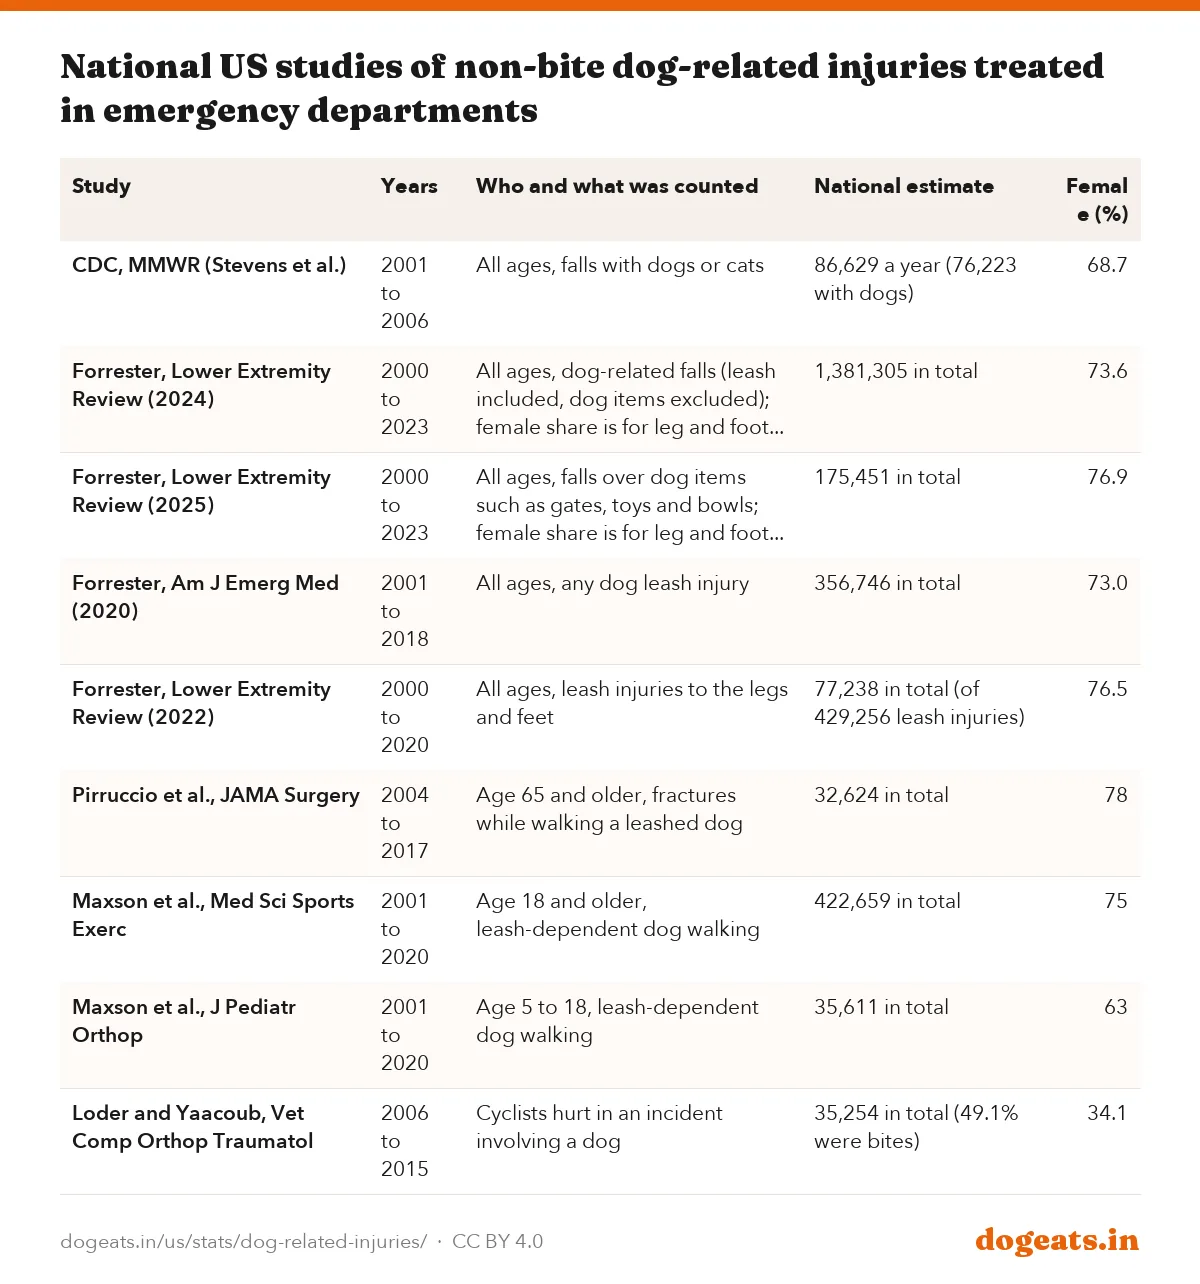
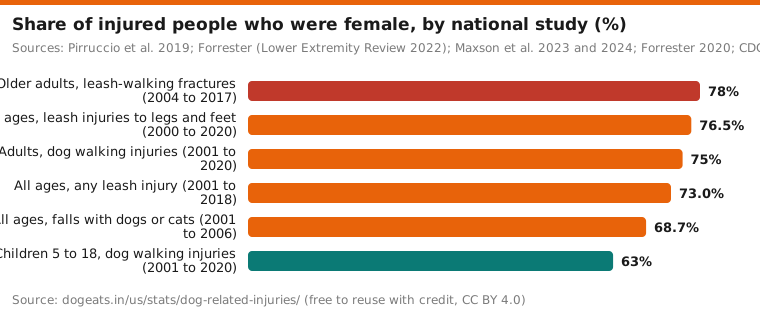
- Women and girls made up 68.7% to 78% of injured people across five national studies of dog falls and leash injuries.
- An estimated 35,611 children aged 5 to 18 were treated in emergency rooms for dog walking injuries in 2001 to 2020.
How many people are injured by dogs without being bitten?
Dogs cause tens of thousands of non-bite injuries in the US every year. The main causes are falls, being pulled over on a leash and tripping over a dog at home. We found no agency that publishes a single yearly total, so the best figures come from national emergency room studies.
The CDC's national count of pet-related falls covers 2001 to 2006. It estimated 86,629 ER visits a year for falls involving dogs or cats. Dogs were involved in 88% of them, or about 76,223 visits a year.
A newer NEISS analysis by Mathias Forrester estimated 1,381,305 dog-related falls treated in emergency rooms from 2000 to 2023, about 57,600 a year by our math. It used the main NEISS sample rather than the CDC's All Injury Program and left out falls over dog items, so the two figures are not directly comparable.
Bites are still far more common. CDC estimated 368,245 ER visits for dog bites in 2001, about five for every dog-related fall. Our dog bite statistics cover bites, claims and deaths in detail.
| Study | Years | Who and what was counted | National estimate | Female (%) |
|---|---|---|---|---|
| CDC, MMWR (Stevens et al.) | 2001 to 2006 | All ages, falls with dogs or cats | 86,629 a year (76,223 with dogs) | 68.7 |
| Forrester, Lower Extremity Review (2024) | 2000 to 2023 | All ages, dog-related falls (leash included, dog items excluded); female share is for leg and foot falls | 1,381,305 in total | 73.6 |
| Forrester, Lower Extremity Review (2025) | 2000 to 2023 | All ages, falls over dog items such as gates, toys and bowls; female share is for leg and foot falls | 175,451 in total | 76.9 |
| Forrester, Am J Emerg Med (2020) | 2001 to 2018 | All ages, any dog leash injury | 356,746 in total | 73.0 |
| Forrester, Lower Extremity Review (2022) | 2000 to 2020 | All ages, leash injuries to the legs and feet | 77,238 in total (of 429,256 leash injuries) | 76.5 |
| Pirruccio et al., JAMA Surgery | 2004 to 2017 | Age 65 and older, fractures while walking a leashed dog | 32,624 in total | 78 |
| Maxson et al., Med Sci Sports Exerc | 2001 to 2020 | Age 18 and older, leash-dependent dog walking | 422,659 in total | 75 |
| Maxson et al., J Pediatr Orthop | 2001 to 2020 | Age 5 to 18, leash-dependent dog walking | 35,611 in total | 63 |
| Loder and Yaacoub, Vet Comp Orthop Traumatol | 2006 to 2015 | Cyclists hurt in an incident involving a dog | 35,254 in total (49.1% were bites) | 34.1 |
The studies count different things, so their totals should not be added together. Leash injuries overlap with falls, and the CDC count includes cats. Read each figure with its scope in mind.
Fall injury rates climb steeply with age
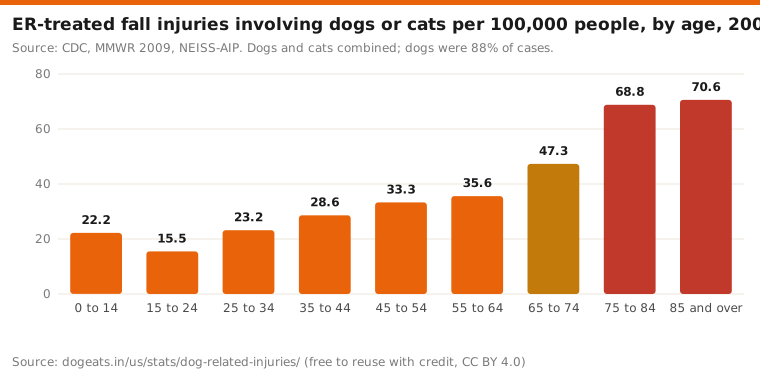
Pet-related fall injuries hit older people hardest. People aged 85 and over were injured at a rate of 70.6 per 100,000, the highest of any age group. The rate for ages 75 to 84 was 68.8.
Children were not spared. Those aged 0 to 14 had a rate of 22.2 per 100,000, above the 15.5 for ages 15 to 24. Among children, the dog-related fall rate was 12.9 times the cat-related rate.
Females were 2.1 times as likely as males to be hurt, with a rate of 40.1 per 100,000 against 18.9. Females made up 68.7% of those injured.
Source: CDC, MMWR 2009, NEISS-AIP. Dogs and cats combined; dogs were 88% of cases.
Show the numbers
| Label | Value |
|---|---|
| 0 to 14 | 22.2 |
| 15 to 24 | 15.5 |
| 25 to 34 | 23.2 |
| 35 to 44 | 28.6 |
| 45 to 54 | 33.3 |
| 55 to 64 | 35.6 |
| 65 to 74 | 47.3 |
| 75 to 84 | 68.8 |
| 85 and over | 70.6 |
Embed this chart
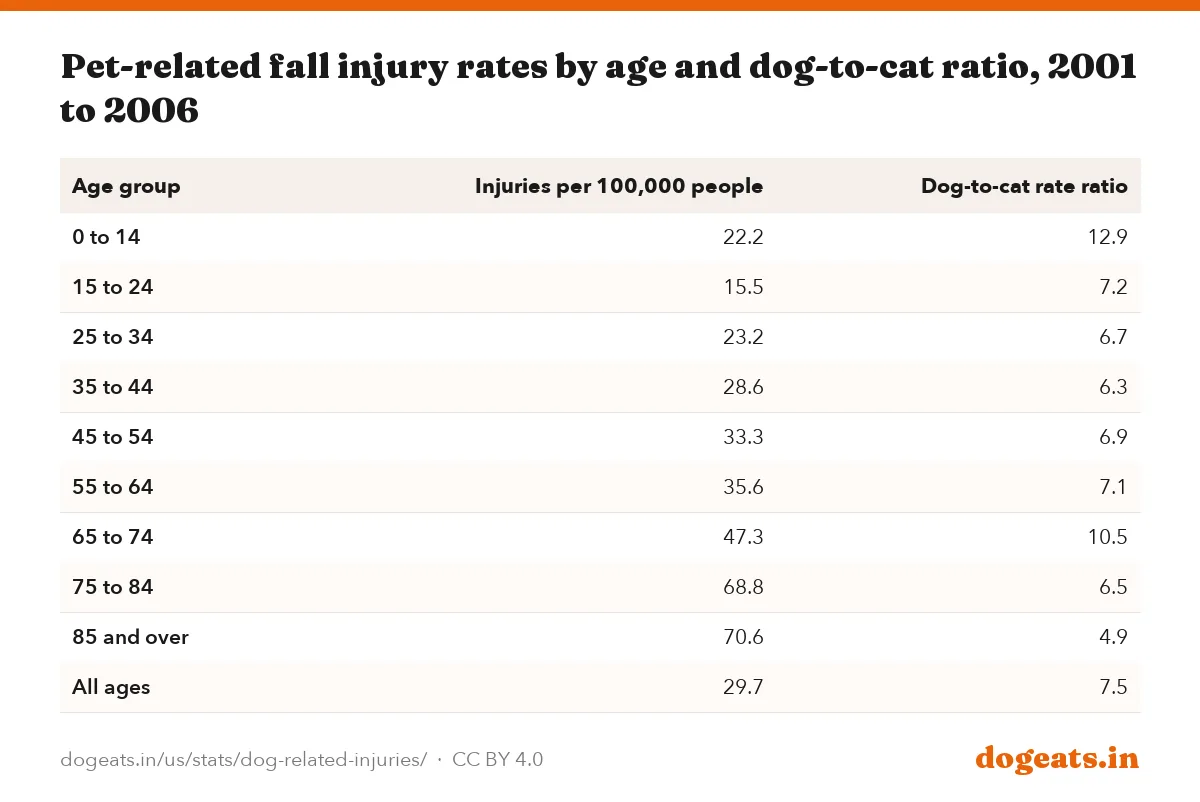
| Age group | Injuries per 100,000 people | Dog-to-cat rate ratio |
|---|---|---|
| 0 to 14 | 22.2 | 12.9 |
| 15 to 24 | 15.5 | 7.2 |
| 25 to 34 | 23.2 | 6.7 |
| 35 to 44 | 28.6 | 6.3 |
| 45 to 54 | 33.3 | 6.9 |
| 55 to 64 | 35.6 | 7.1 |
| 65 to 74 | 47.3 | 10.5 |
| 75 to 84 | 68.8 | 6.5 |
| 85 and over | 70.6 | 4.9 |
| All ages | 29.7 | 7.5 |
The dog-related rate was higher than the cat-related rate in every age group, from 4.9 times at 85 and over to 12.9 times at ages 0 to 14. Falls in general are a large problem for older Americans. The CDC says over 14 million, or 1 in 4 older adults, report falling every year.
Tripping over the dog is the most common cause
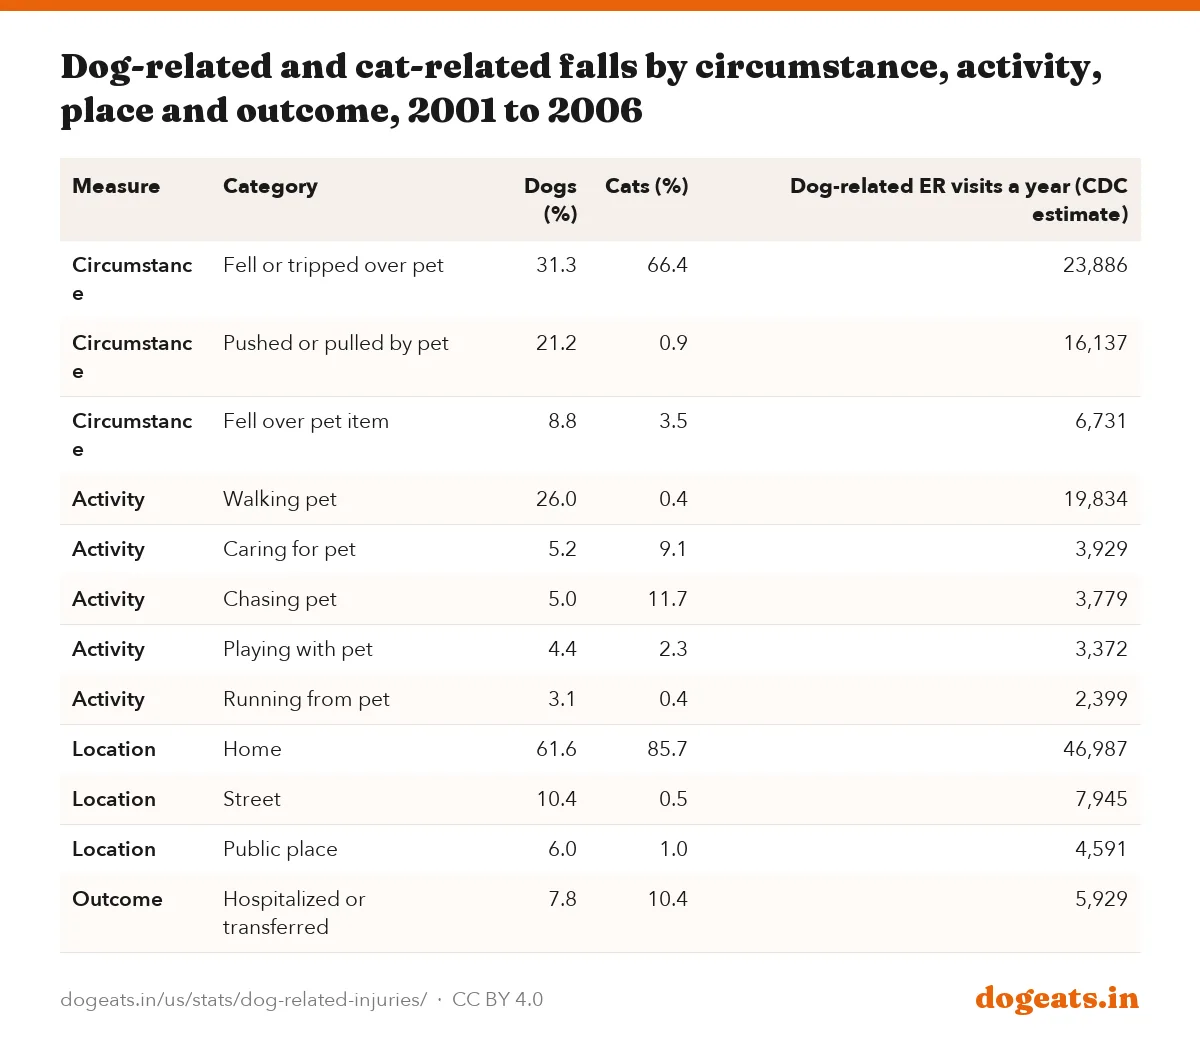
Most dog-related falls happen at home. In the CDC data, 61.6% of dog-related falls occurred at home and 10.4% on the street.
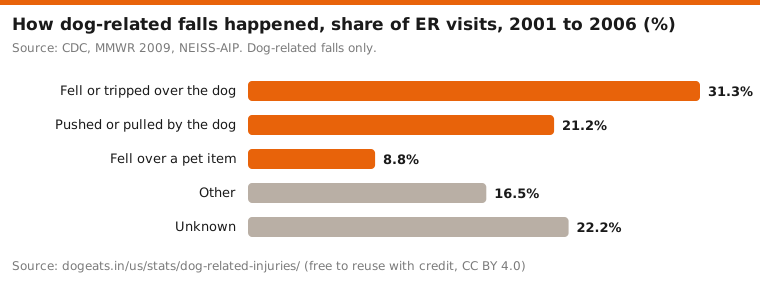
Tripping over the dog caused 31.3% of dog-related falls. Being pushed or pulled by the dog caused 21.2%, and falling over a pet item such as a bowl or toy caused 8.8%.
Walking the dog was the activity in 26.0% of cases. Cats cause falls differently. Two thirds of cat-related falls came from tripping over the cat, and almost none from being pulled.

Source: CDC, MMWR 2009, NEISS-AIP. Dog-related falls only.
Show the numbers
| Label | % |
|---|---|
| Fell or tripped over the dog | 31.3% |
| Pushed or pulled by the dog | 21.2% |
| Fell over a pet item | 8.8% |
| Other | 16.5% |
| Unknown | 22.2% |
Embed this chart
| Measure | Category | Dogs (%) | Cats (%) | Dog-related ER visits a year (CDC estimate) |
|---|---|---|---|---|
| Circumstance | Fell or tripped over pet | 31.3 | 66.4 | 23,886 |
| Circumstance | Pushed or pulled by pet | 21.2 | 0.9 | 16,137 |
| Circumstance | Fell over pet item | 8.8 | 3.5 | 6,731 |
| Activity | Walking pet | 26.0 | 0.4 | 19,834 |
| Activity | Caring for pet | 5.2 | 9.1 | 3,929 |
| Activity | Chasing pet | 5.0 | 11.7 | 3,779 |
| Activity | Playing with pet | 4.4 | 2.3 | 3,372 |
| Activity | Running from pet | 3.1 | 0.4 | 2,399 |
| Location | Home | 61.6 | 85.7 | 46,987 |
| Location | Street | 10.4 | 0.5 | 7,945 |
| Location | Public place | 6.0 | 1.0 | 4,591 |
| Outcome | Hospitalized or transferred | 7.8 | 10.4 | 5,929 |
| Dog item | Share of leg and foot falls (%) |
|---|---|
| Gate, door or fence | 23.8 |
| Toy | 22.4 |
| Bed, mat, blanket or pillow | 10.5 |
| Urine | 9.5 |
| Bowl or dish | 8.0 |
| Other or unknown | 25.9 |
The last column gives the CDC's own yearly estimates for dog-related falls. The activity was unknown in 46.1% of dog cases, so real counts for walking and play are likely higher. Several cat figures here rest on fewer than 20 cases, which the CDC flags as unstable.
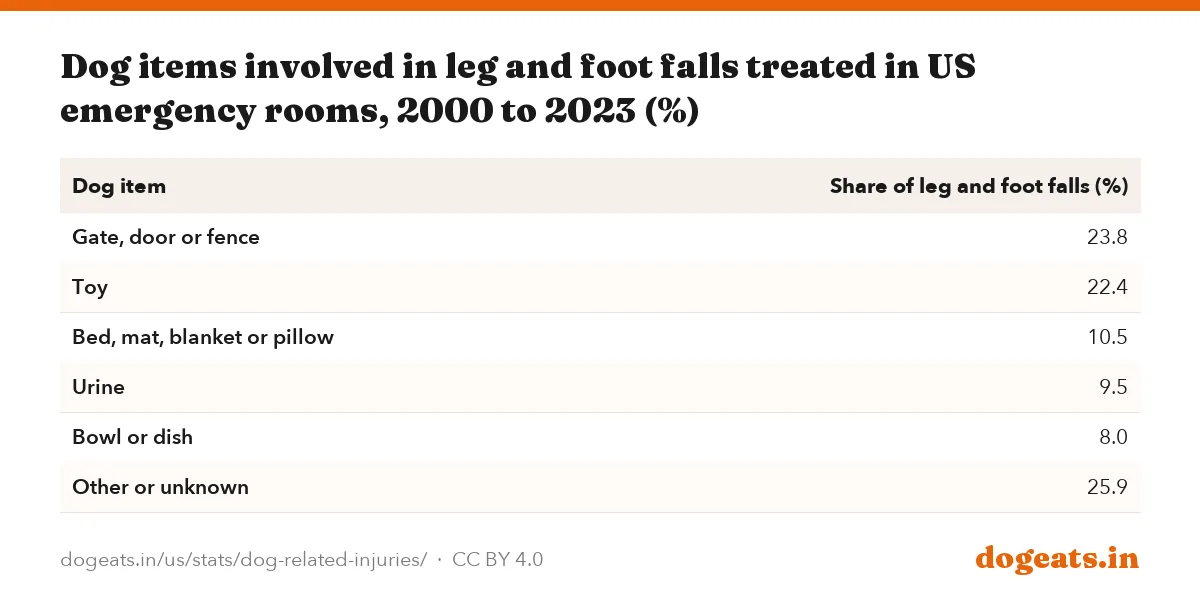
A 2025 NEISS study by Forrester estimated 175,451 ER-treated falls over dog items in 2000 to 2023. Of the 51,978 that hurt a leg or foot, gates, doors or fences were involved in 23.8% and toys in 22.4%. Yearly leg and foot falls over dog items were 11 times higher in 2023 than in 2000.
Fractures are the most common injury
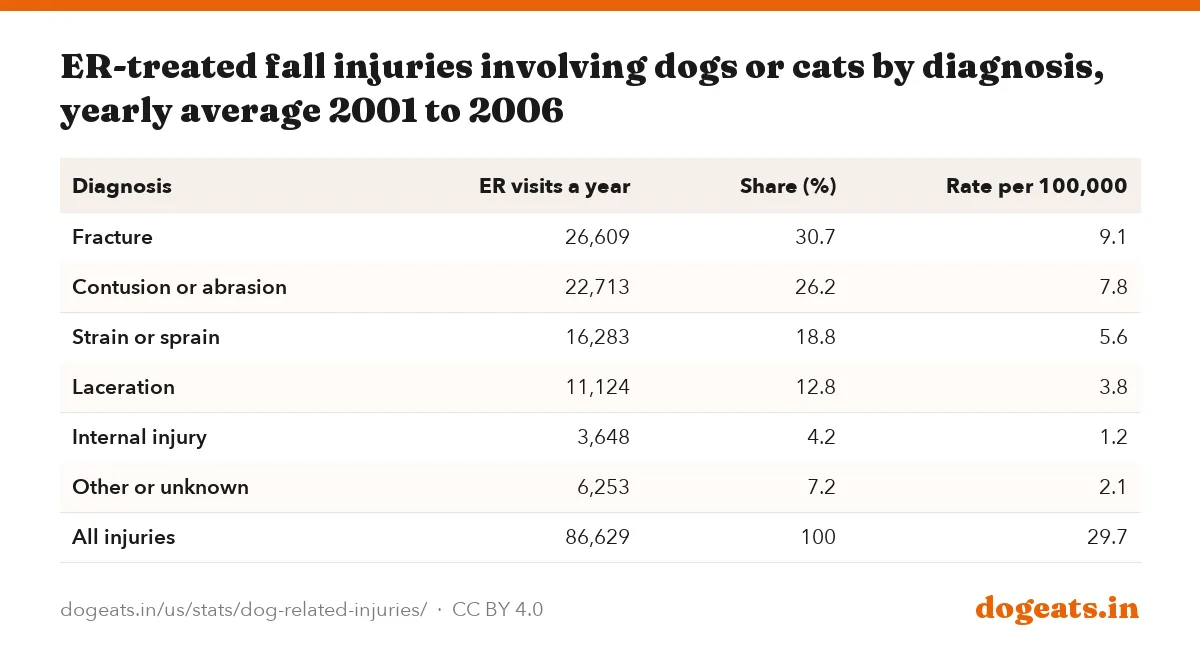
Pet-related falls often break bones. Fractures made up 30.7% of injuries, about 26,609 a year. Contusions and abrasions made up 26.2%, and strains and sprains 18.8%.
Most people went home the same day. Among dog-related falls, 92.0% were treated and released, and 7.8% were hospitalized or transferred. Of those admitted, 79.9% were admitted for fractures.
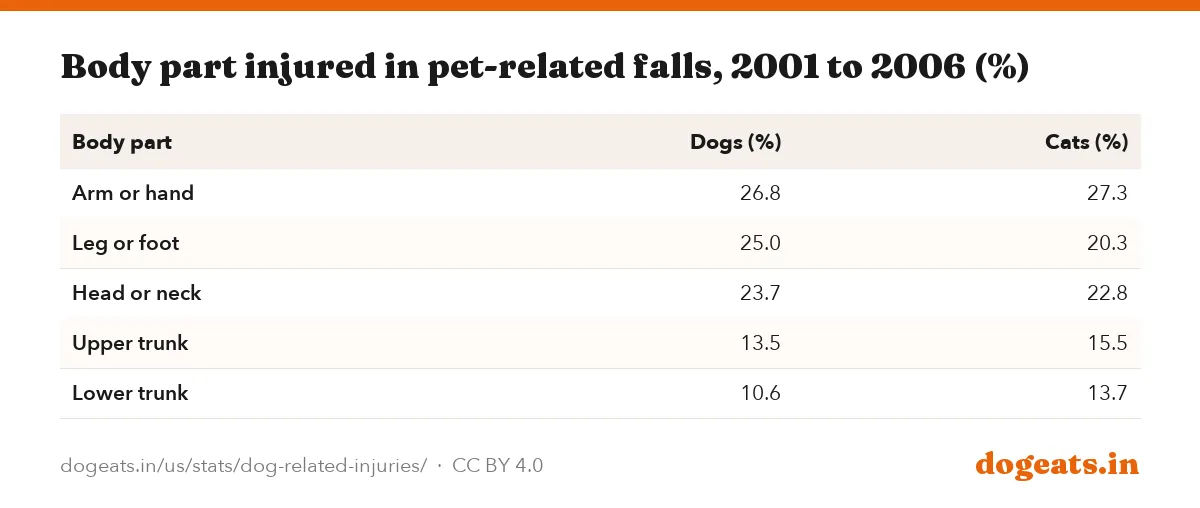
Arms and hands were the most often hurt, in 26.8% of dog-related falls. Legs and feet followed at 25.0%, and the head or neck at 23.7%.
| Diagnosis | ER visits a year | Share (%) | Rate per 100,000 |
|---|---|---|---|
| Fracture | 26,609 | 30.7 | 9.1 |
| Contusion or abrasion | 22,713 | 26.2 | 7.8 |
| Strain or sprain | 16,283 | 18.8 | 5.6 |
| Laceration | 11,124 | 12.8 | 3.8 |
| Internal injury | 3,648 | 4.2 | 1.2 |
| Other or unknown | 6,253 | 7.2 | 2.1 |
| All injuries | 86,629 | 100 | 29.7 |
| Body part | Dogs (%) | Cats (%) |
|---|---|---|
| Arm or hand | 26.8 | 27.3 |
| Leg or foot | 25.0 | 20.3 |
| Head or neck | 23.7 | 22.8 |
| Upper trunk | 13.5 | 15.5 |
| Lower trunk | 10.6 | 13.7 |
How common are dog walking injuries?
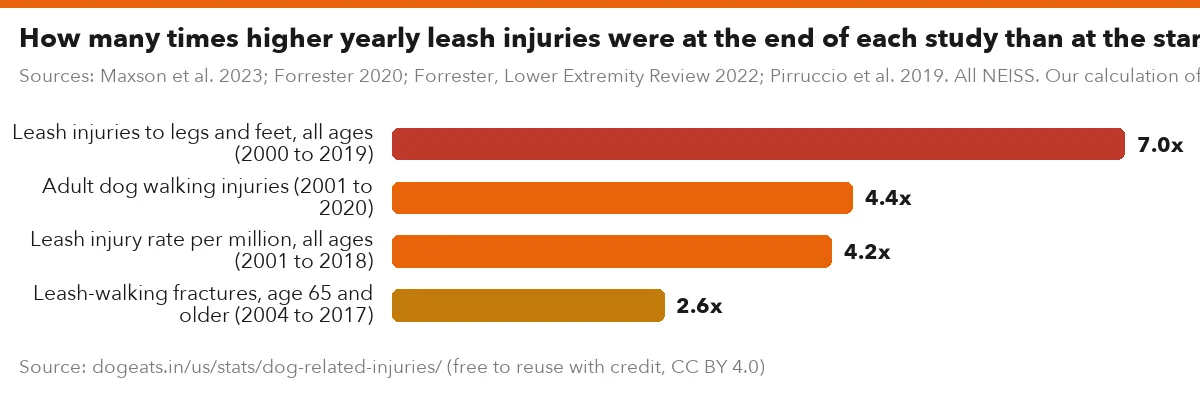
Dog walking injuries are common and rising fast. Johns Hopkins researchers estimate that 422,659 adults were treated in US emergency rooms for injuries from walking a leashed dog in 2001 to 2020. That averages about 21,000 a year.
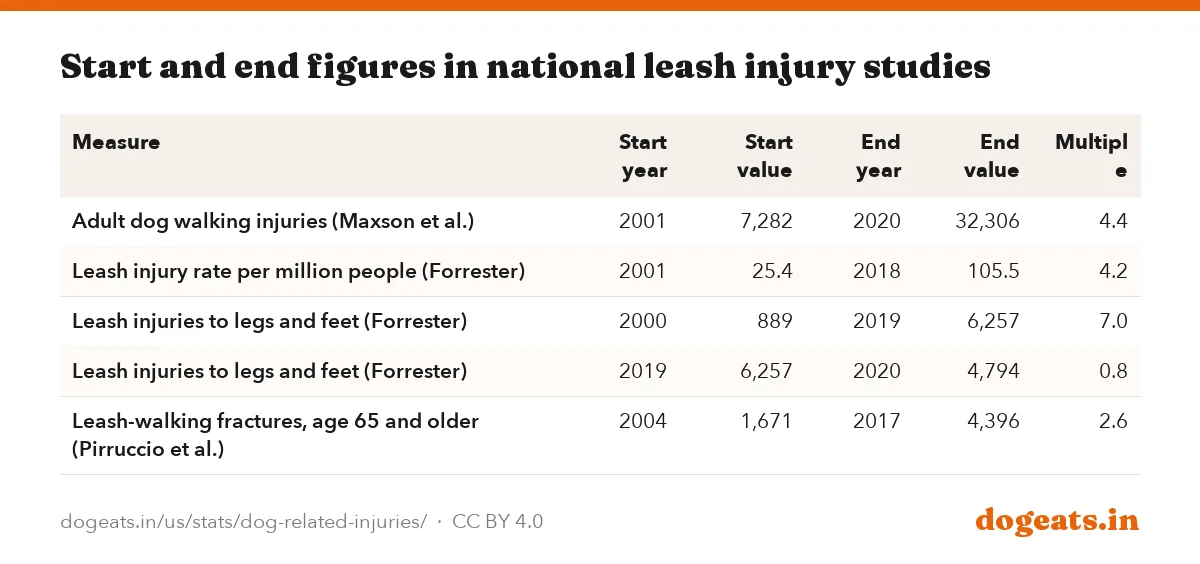
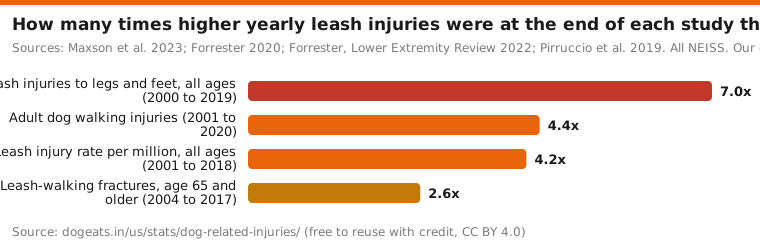
The yearly count rose from 7,282 in 2001 to 32,306 in 2020, more than four times higher. A separate study of all ages found the leash injury rate rose from 25.4 to 105.5 per million people between 2001 and 2018.
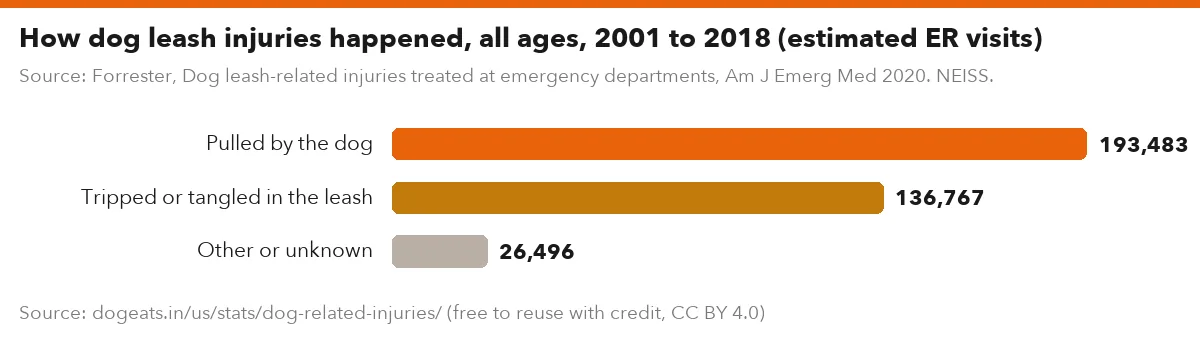
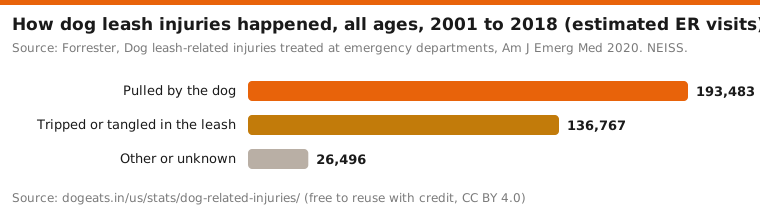
Being pulled is the main way people get hurt. In the all-ages leash study, 193,483 injuries came from a pull and 136,767 from tripping on or tangling in the leash.
Sources: Maxson et al. 2023; Forrester 2020; Forrester, Lower Extremity Review 2022; Pirruccio et al. 2019. All NEISS. Our calculation of multiples.
Show the numbers
| Label | x |
|---|---|
| Leash injuries to legs and feet, all ages (2000 to 2019) | 7.0x |
| Adult dog walking injuries (2001 to 2020) | 4.4x |
| Leash injury rate per million, all ages (2001 to 2018) | 4.2x |
| Leash-walking fractures, age 65 and older (2004 to 2017) | 2.6x |
Embed this chart
| Measure | Start year | Start value | End year | End value | Multiple |
|---|---|---|---|---|---|
| Adult dog walking injuries (Maxson et al.) | 2001 | 7,282 | 2020 | 32,306 | 4.4 |
| Leash injury rate per million people (Forrester) | 2001 | 25.4 | 2018 | 105.5 | 4.2 |
| Leash injuries to legs and feet (Forrester) | 2000 | 889 | 2019 | 6,257 | 7.0 |
| Leash injuries to legs and feet (Forrester) | 2019 | 6,257 | 2020 | 4,794 | 0.8 |
| Leash-walking fractures, age 65 and older (Pirruccio et al.) | 2004 | 1,671 | 2017 | 4,396 | 2.6 |
Source: Forrester, Dog leash-related injuries treated at emergency departments, Am J Emerg Med 2020. NEISS.
Show the numbers
| Label | Value |
|---|---|
| Pulled by the dog | 193,483 |
| Tripped or tangled in the leash | 136,767 |
| Other or unknown | 26,496 |
Embed this chart
Leash injuries to the legs and feet rose from 889 in 2000 to 6,257 in 2019, then fell to 4,794 in 2020. Our math puts the drop at 23%, while the article says 22%. The 2020 drop came in the first year of the pandemic, and the source does not explain it. For how many US homes have a dog, see our dog ownership statistics.
Older dog walkers risk hip fractures and head injuries
For people 65 and older, a leash injury is more likely to be serious. University of Pennsylvania researchers estimated 32,624 ER-treated fractures in older adults walking leashed dogs from 2004 to 2017.
Those fractures rose from 1,671 in 2004 to 4,396 in 2017, up 163%. The hip was the most common single site, at 17% of cases. About half of the injuries were to the arms, wrists, shoulders or fingers.
The Johns Hopkins study found the same pattern among all adults. Injured walkers aged 65 and older had 2.1 times the odds of a fracture and 1.6 times the odds of a traumatic brain injury (TBI). TBI and hip fracture were the two most common injuries in that age group.
- Injured adults 65 and older: odds of fracture 2.1 times those of younger walkers, odds of TBI 1.6 times (Maxson et al.).
- Injured women: odds of fracture 1.5 times those of men (Maxson et al.).
- At one rural Appalachian trauma center, 38 of 64 patients aged 65 and older hurt in dog-related falls had a hip fracture (59%). Only 3 of 30 younger patients did (Burns et al., 2026, 94 patients).
The Appalachian study is a single hospital, so it shows severity rather than national numbers. It also found older patients had 10.3 times the odds of being discharged to a care facility, most often skilled nursing.
Women make up most of the injured
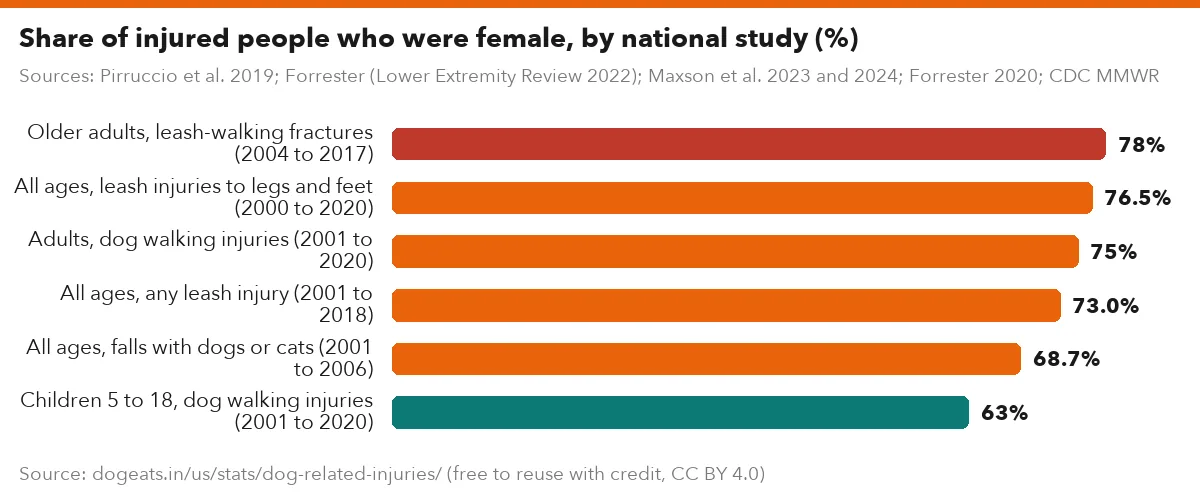
Every national study of dog falls and leash injuries finds more women than men among the injured. The share ranges from 68.7% in the CDC fall data to 78% among older adults with leash-walking fractures.
Among adult dog walkers, 75% of those treated were women. Injured women also had 1.5 times the odds of a fracture compared with men. The studies document the gap but do not explain it.
Children show a smaller gap. Girls made up 63% of children hurt walking dogs, but injured boys had twice the odds of a fracture.
Children and cyclists are hurt too
An estimated 35,611 children aged 5 to 18 were treated in emergency rooms for dog walking injuries in 2001 to 2020. Their average age was 11. Over half (55%) of the injuries were to bones, joints or muscles, and 57% were to the shoulder, arm or hand.
The most frequent child injuries were wrist sprains or strains (5.6%), finger sprains or strains (5.4%) and ankle sprains or strains (5.3%). Injured children aged 5 to 11 had 3.2 times the odds of a TBI compared with older children.
Cyclists meet dogs on the road as well. From 2006 to 2015, dogs were involved in 35,254 ER visits for bicycle injuries, 0.67% of the total. About half of those hurt were bitten. Being chased, hitting a dog, swerving to avoid one or riding with one covered 97.5% of cases.

The cycling study found the most severe injuries came when riders swerved to avoid a dog or hit one. Riders chased by dogs were younger, more often hurt in the leg and often bitten.
What the research suggests about lowering the risk
The study authors point to a few practical steps. The CDC suggested obedience training to cut pulling and pushing, and more awareness of risky moments such as walking or chasing pets.
The Johns Hopkins team advised that dog owners be told about the injury risk and given ways to reduce it. Older owners, and anyone with weak bones, have the most to gain.
- Train dogs not to pull on the leash or jump up, the behaviors behind about one in five dog-related falls.
- Keep toys and bowls out of walkways, since pet items caused 8.8% of dog-related falls.
- Watch for a dog lying underfoot, since tripping over the dog caused 31.3% of dog-related falls.
- Hold the leash so a sudden pull cannot trap a finger, since finger fracture was the most common adult dog walking injury.
These steps come from the researchers' own recommendations and injury patterns. They are general safety points, not medical advice. Anyone who falls and hits their head, or cannot bear weight, should get checked by a doctor.
What these numbers cannot tell you
All the figures come from emergency rooms. People treated by their own doctor, at urgent care or not at all are missing, so the true number of injuries is higher.
The CDC's national fall count is old, covering 2001 to 2006. Forrester's newer estimate runs to 2023 but uses a different sample and definition, so the two cannot be joined into one trend.
None of the studies record the dog's size, breed or training, or the type of leash. Our most popular dog breeds report covers which breeds Americans own. We did not run our own NEISS query, because CPSC's data download was not accessible to us. We relied on published studies.
Frequently asked questions
How many people are injured by dogs each year besides bites?
CDC data put falls involving dogs at about 76,000 ER visits a year in 2001 to 2006. Leash injuries have risen since, with adult dog walking injuries reaching an estimated 32,306 in 2020. No single current total covers every kind of non-bite injury.
How common is tripping over a dog?
Tripping over the dog caused 31.3% of dog-related fall injuries in CDC data, about 23,900 ER visits a year. Most of these falls happened at home. Being pushed or pulled by the dog caused another 21.2%.
How many people get hurt walking their dog?
Researchers estimate 422,659 adults were treated in US emergency rooms for injuries from walking a leashed dog in 2001 to 2020. Another 35,611 children aged 5 to 18 were treated. Yearly adult injuries rose more than fourfold over the period.
Are older people more at risk from dog-related falls?
Yes. Pet-related fall injury rates reached 70.6 per 100,000 for people 85 and over, against 15.5 for ages 15 to 24. Among older adults walking leashed dogs, fractures rose from 1,671 in 2004 to 4,396 in 2017.
What injuries do dog walkers get most often?
Among adults, the three most common were finger fracture (6.9%), traumatic brain injury (5.6%) and shoulder sprain or strain (5.1%). For people 65 and older, TBI and hip fracture were the most common.
Why are women more often injured by dogs?
Women and girls made up 68.7% to 78% of injured people across the national studies. Among adult dog walkers, women were 1.5 times as likely as men to have a fracture. The studies document the pattern but do not explain it.
Can a dog cause a hip fracture?
Yes, mostly through falls. Hip fractures were 17% of leash-walking fractures among Americans 65 and older from 2004 to 2017. In one Appalachian trauma center, 38 of 64 older patients hurt in dog-related falls had a hip fracture.
Do dogs cause bicycle accidents?
They can. Dogs were involved in an estimated 35,254 ER visits for bicycle injuries from 2006 to 2015. About half of those hurt were bitten, and 97.5% of cases involved being chased, hitting a dog, swerving or riding with a dog.
Methodology and limitations
This report collects national estimates of non-bite injuries involving dogs from published studies of the National Electronic Injury Surveillance System (NEISS). NEISS is run by the US Consumer Product Safety Commission and samples about 100 hospital emergency departments. The CDC fall study used its All Injury Program, which then sampled 66 hospitals and drew on 7,456 cases. Weighted records produce national estimates.
Fall figures come from the CDC's MMWR report on nonfatal fall injuries associated with dogs and cats in 2001 to 2006, which used the NEISS All Injury Program. Leash and dog walking figures come from peer-reviewed NEISS studies by Forrester (2020), Pirruccio and colleagues (2019) and Maxson and colleagues (2023 and 2024). The lower-extremity leash figures and the newer dog fall and dog item estimates come from three Forrester articles in Lower Extremity Review (2022, 2024 and 2025).
Some figures are our own arithmetic: CDC percentages applied to the CDC's yearly dog total, growth multiples and yearly averages. These are labeled as our calculations. Pirruccio figures come from the University of Pennsylvania's summary of the JAMA Surgery letter, as reported by Today's Geriatric Medicine, because the full letter is behind a paywall.
Dog bites are excluded here except as a comparison. They are covered in our separate dog bite statistics report.
Sources
- CDC, MMWR: Nonfatal fall-related injuries associated with dogs and cats, United States, 2001 to 2006 (Stevens, Teh, Haileyesus, March 2009), Yearly fall estimates, rates by age and sex, circumstances, diagnoses, body parts, disposition
- Maxson et al., Epidemiology of dog walking-related injuries among adults presenting to US emergency departments, 2001 to 2020, Med Sci Sports Exerc 2023, 422,659 adults, 7,282 in 2001 vs 32,306 in 2020, 75% women, injury types, odds ratios
- Forrester, Dog leash-related injuries treated at emergency departments, Am J Emerg Med 2020, 356,746 leash injuries 2001 to 2018, rate 25.4 to 105.5 per million, mechanisms, 73.0% female
- Also consulted: Pirruccio, Yoon, Ahn, Fractures in elderly Americans associated with walking leashed dogs, JAMA Surgery 2019;154(5):458-459, Today's Geriatric Medicine, report on the Penn Medicine JAMA Surgery study (April 2019), Penn Today, University of Pennsylvania (March 2019), Maxson et al., Epidemiology of pediatric dog walking-related injuries, J Pediatr Orthop 2024, Forrester, Dog leash-related injuries of the lower extremity treated at hospital emergency departments, Lower Extremity Review (July 2022), Forrester, Dog-related falls affecting the lower extremity treated at US hospital emergency departments, Lower Extremity Review (July 2024), Forrester, Dog-item-related falls affecting the lower extremity treated at US hospital emergency departments, Lower Extremity Review (September 2025), Loder and Yaacoub, Injuries to cyclists due to a dog-bicycle interaction, Vet Comp Orthop Traumatol 2018, CDC, MMWR: Nonfatal dog bite-related injuries treated in hospital emergency departments, United States, 2001 (2003), Burns et al., Outcomes in the older Appalachian trauma population after falls caused by dogs, Cureus 2026, Stevens, Teh, Haileyesus, Dogs and cats as environmental fall hazards, J Safety Res 2010, CDC, Older adult falls data, Futurity, Johns Hopkins summary of the dog walking injury study (2023), Rosa and Buckley, Leash-related injuries associated with dog walking, JAVMA 2024 (review).
Cite, embed and download
This report, its data and its images are free to reuse under a Creative Commons Attribution 4.0 licence. Credit dogeats.in with a link to this page. Every chart has its own embed code, every table has a CSV and an image download, and the images below are ready for social posts, slides and articles.
Cite this report
Link to this report

Every chart and table as an image