Data report · Updated October 2026
How many American households own a dog? Two national surveys, two different answers
The AVMA estimates 87.3 million pet dogs lived in 56.3 million US households in 2025, or 42.6% of homes. The pet industry's APPA survey puts dog-owning households far higher, at 71 million or 53%. On the AVMA count, the dog population is up 65% since 1996.

Key findings
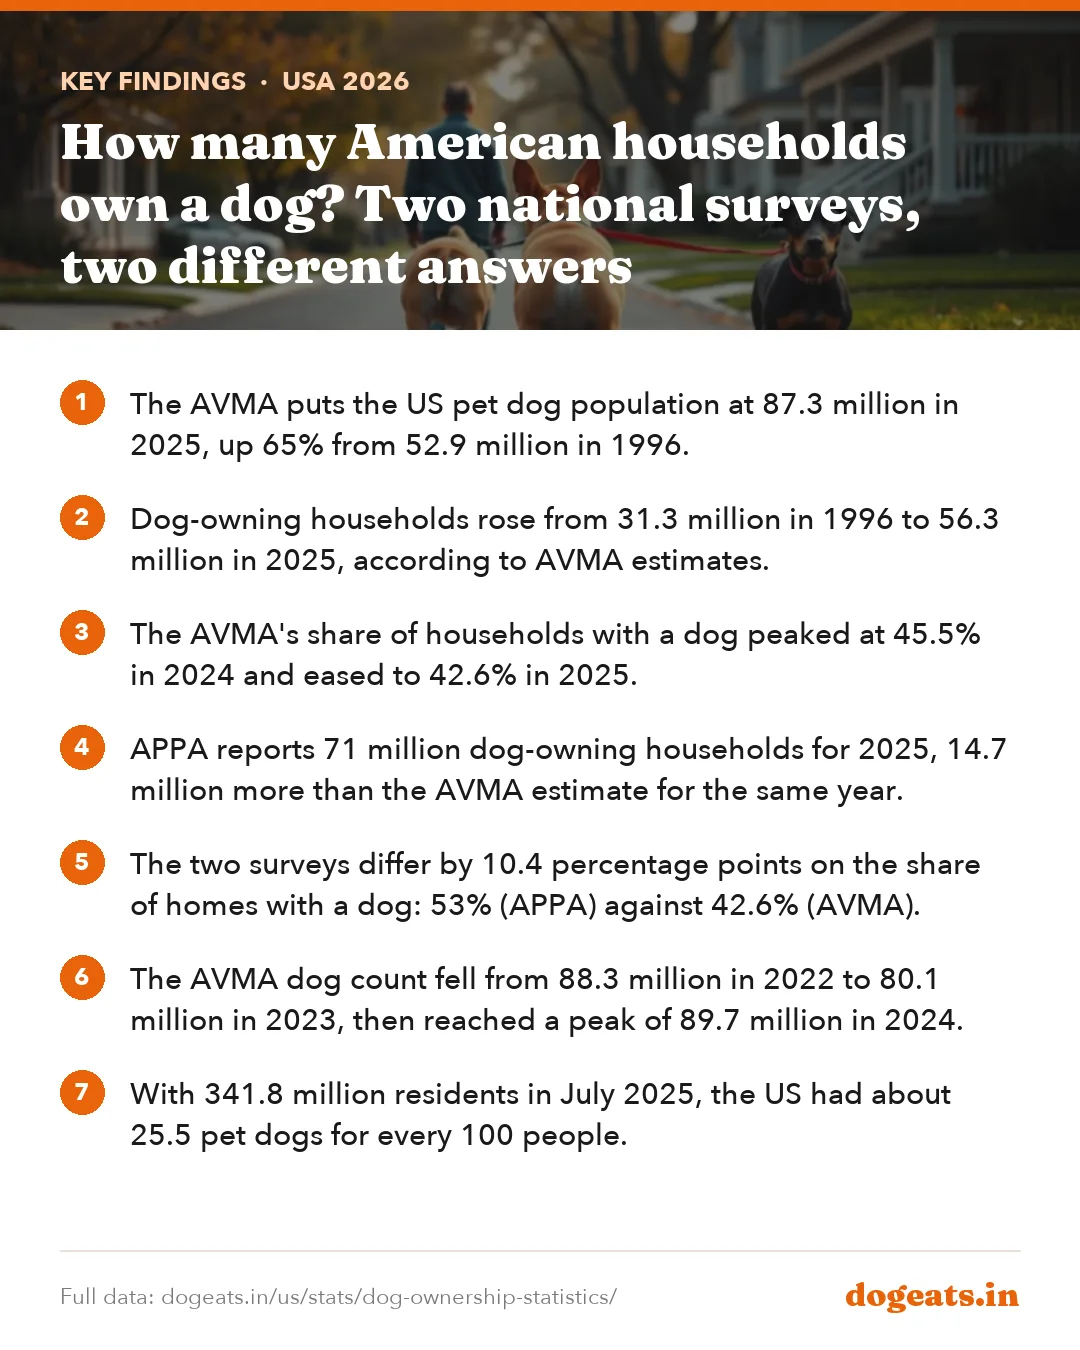
- The AVMA puts the US pet dog population at 87.3 million in 2025, up 65% from 52.9 million in 1996.
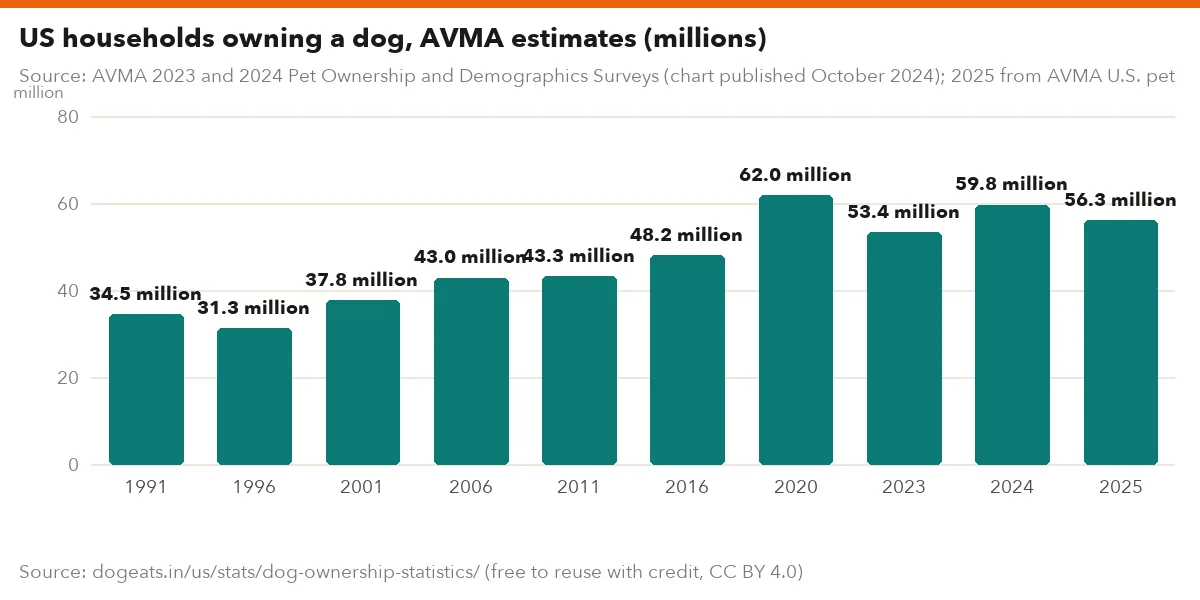
- Dog-owning households rose from 31.3 million in 1996 to 56.3 million in 2025, according to AVMA estimates.
- The AVMA's share of households with a dog peaked at 45.5% in 2024 and eased to 42.6% in 2025.
- APPA reports 71 million dog-owning households for 2025, 14.7 million more than the AVMA estimate for the same year.
- The two surveys differ by 10.4 percentage points on the share of homes with a dog: 53% (APPA) against 42.6% (AVMA).
- The AVMA dog count fell from 88.3 million in 2022 to 80.1 million in 2023, then reached a peak of 89.7 million in 2024.
- With 341.8 million residents in July 2025, the US had about 25.5 pet dogs for every 100 people.
- In the AVMA's last published state ranking of dog ownership, Arkansas led with 47.9% of households and Illinois was lowest at 32.4%.
- Gen Z made up 20% of US dog owners in APPA's 2025 report, an 18% rise from 2023.
How many dogs are there in the US?
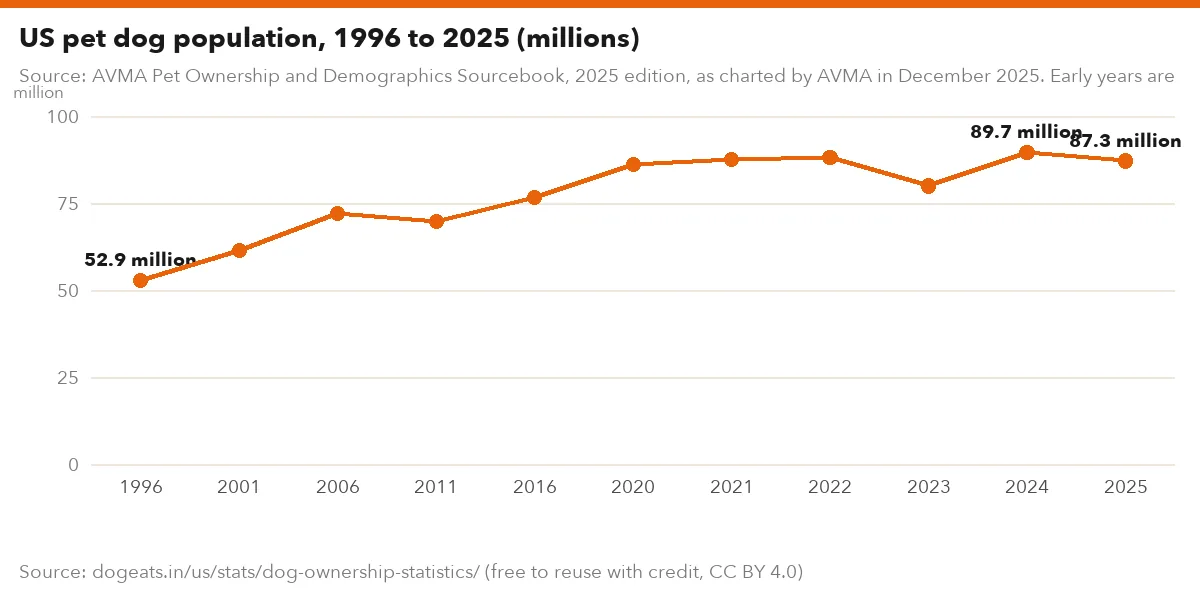
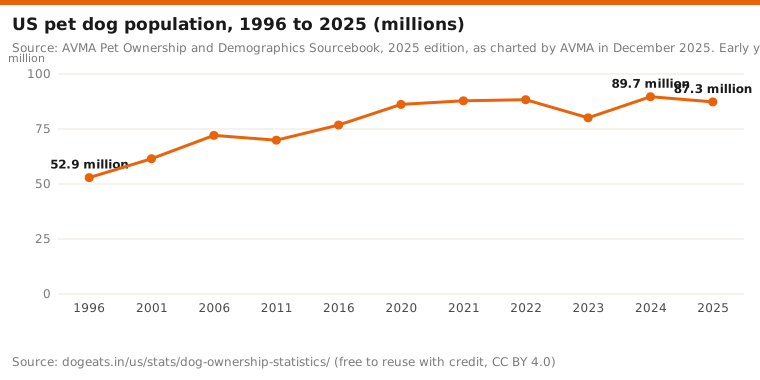
There were about 87.3 million pet dogs in the United States in 2025, according to the American Veterinary Medical Association (AVMA). It is the headline figure in its 2025 Pet Ownership and Demographics Sourcebook. The count was 52.9 million in 1996, so the dog population has grown by 65% in under three decades.
Growth has not been smooth. The AVMA estimate dipped to 69.9 million in 2011, after 72.1 million in 2006. It fell again in 2023, to 80.1 million, before reaching its highest point yet of 89.7 million in 2024.
The AVMA now surveys every year. Before 2020 it fielded its big pet owner survey roughly every five years, which is why the early points in the series are five years apart.
Source: AVMA Pet Ownership and Demographics Sourcebook, 2025 edition, as charted by AVMA in December 2025. Early years are five years apart.
Show the numbers
| Label | million |
|---|---|
| 1996 | 52.9 million |
| 2001 | 61.5 million |
| 2006 | 72.1 million |
| 2011 | 69.9 million |
| 2016 | 76.8 million |
| 2020 | 86.2 million |
| 2021 | 87.8 million |
| 2022 | 88.3 million |
| 2023 | 80.1 million |
| 2024 | 89.7 million |
| 2025 | 87.3 million |
Embed this chart
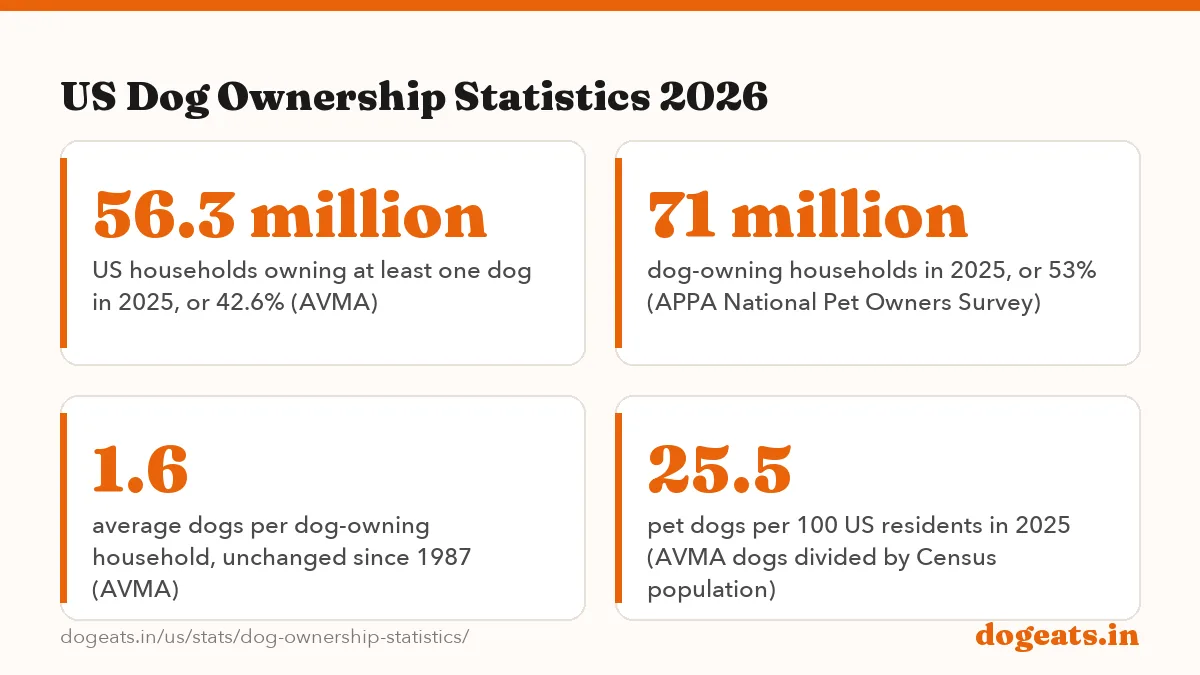
For scale, the Census Bureau estimated the US population at 341.8 million on July 1, 2025. Dividing the AVMA dog count by that figure gives about 25.5 dogs per 100 residents, or one dog for roughly every four people.
What share of US households own a dog?
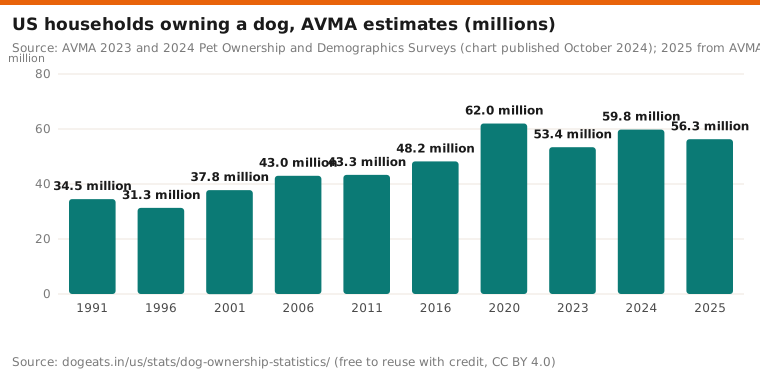
The AVMA estimates that 42.6% of US households owned at least one dog in 2025. That equals 56.3 million homes. Cats were in 32.6% of households, so dogs remain the most common pet by a wide margin.
The dog share has climbed over the long run. It was 31.6% in 1996, the low point of the AVMA series. It reached about 38% in 2016 and about 45% in 2020, during the pandemic rush to adopt.
The 2024 survey put the share at 45.5%, nearly half of all homes. The 2025 survey shows a step back to 42.6%, while the number of dogs stayed above 87 million.
Source: AVMA 2023 and 2024 Pet Ownership and Demographics Surveys (chart published October 2024); 2025 from AVMA U.S. pet ownership statistics page.
Show the numbers
| Label | million |
|---|---|
| 1991 | 34.5 million |
| 1996 | 31.3 million |
| 2001 | 37.8 million |
| 2006 | 43.0 million |
| 2011 | 43.3 million |
| 2016 | 48.2 million |
| 2020 | 62.0 million |
| 2023 | 53.4 million |
| 2024 | 59.8 million |
| 2025 | 56.3 million |
Embed this chart
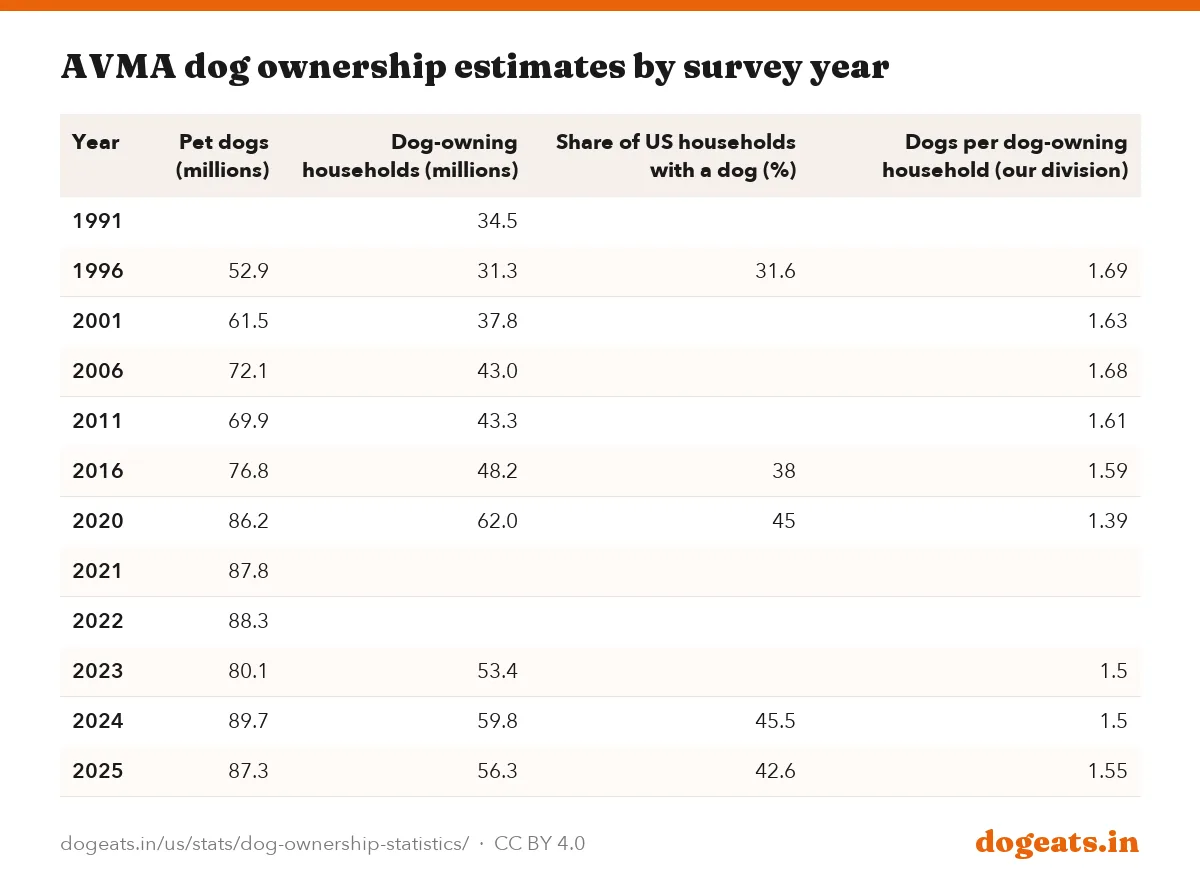
| Year | Pet dogs (millions) | Dog-owning households (millions) | Share of US households with a dog (%) | Dogs per dog-owning household (our division) |
|---|---|---|---|---|
| 1991 | 34.5 | |||
| 1996 | 52.9 | 31.3 | 31.6 | 1.69 |
| 2001 | 61.5 | 37.8 | 1.63 | |
| 2006 | 72.1 | 43.0 | 1.68 | |
| 2011 | 69.9 | 43.3 | 1.61 | |
| 2016 | 76.8 | 48.2 | 38 | 1.59 |
| 2020 | 86.2 | 62.0 | 45 | 1.39 |
| 2021 | 87.8 | |||
| 2022 | 88.3 | |||
| 2023 | 80.1 | 53.4 | 1.5 | |
| 2024 | 89.7 | 59.8 | 45.5 | 1.5 |
| 2025 | 87.3 | 56.3 | 42.6 | 1.55 |
The 2020 household figure of 62.0 million is high compared with the years on either side. AVMA staff tied the 2016 to 2020 rise to remote work, home buying and higher incomes during the pandemic.
AVMA and APPA count dog owners differently
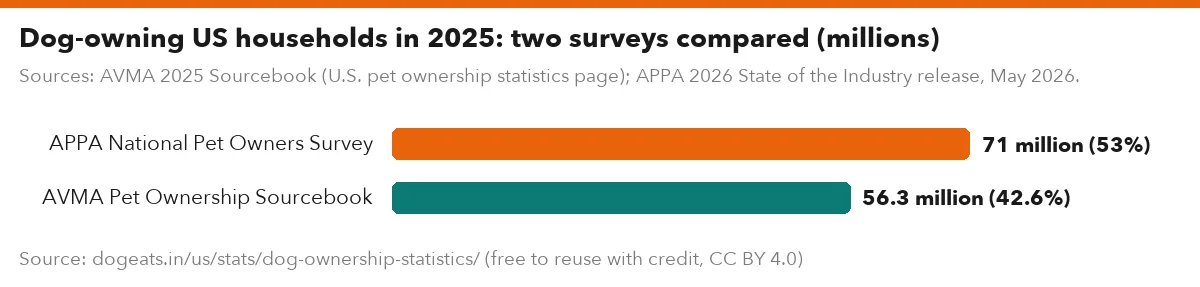
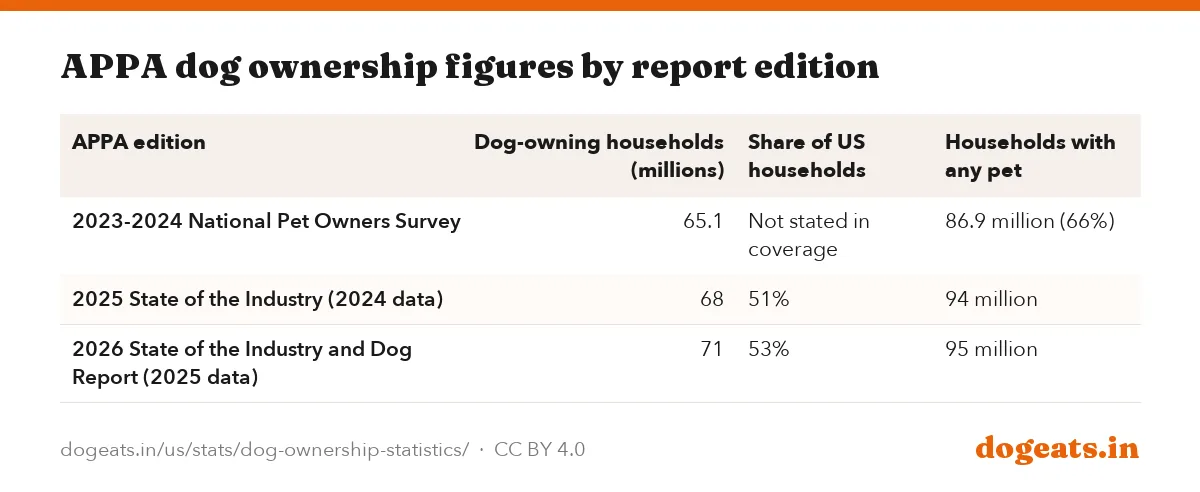
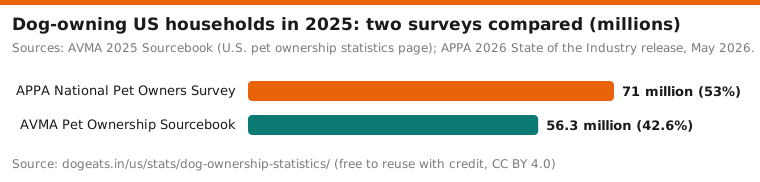
Two national surveys dominate US pet statistics, and they do not agree. The AVMA says 56.3 million households had a dog in 2025. The American Pet Products Association (APPA) says 71 million did, a gap of 14.7 million homes.
The gap shows up in the percentages too: 42.6% of households for the AVMA against 53% for APPA. Both imply a similar total number of US households, about 132.2 million and 134.0 million. So the difference lies in who counts as a dog owner, not in the household base.
APPA's figures have moved quickly from edition to edition. Its 2023 to 2024 National Pet Owners Survey found 65.1 million dog households. The 2025 report said 68 million, or 51%, and the 2026 report said 71 million, or 53%.
Sources: AVMA 2025 Sourcebook (U.S. pet ownership statistics page); APPA 2026 State of the Industry release, May 2026.
Show the numbers
| Label | million |
|---|---|
| APPA National Pet Owners Survey | 71 million (53%) |
| AVMA Pet Ownership Sourcebook | 56.3 million (42.6%) |
Embed this chart
| APPA edition | Dog-owning households (millions) | Share of US households | Households with any pet |
|---|---|---|---|
| 2023-2024 National Pet Owners Survey | 65.1 | Not stated in coverage | 86.9 million (66%) |
| 2025 State of the Industry (2024 data) | 68 | 51% | 94 million |
| 2026 State of the Industry and Dog Report (2025 data) | 71 | 53% | 95 million |
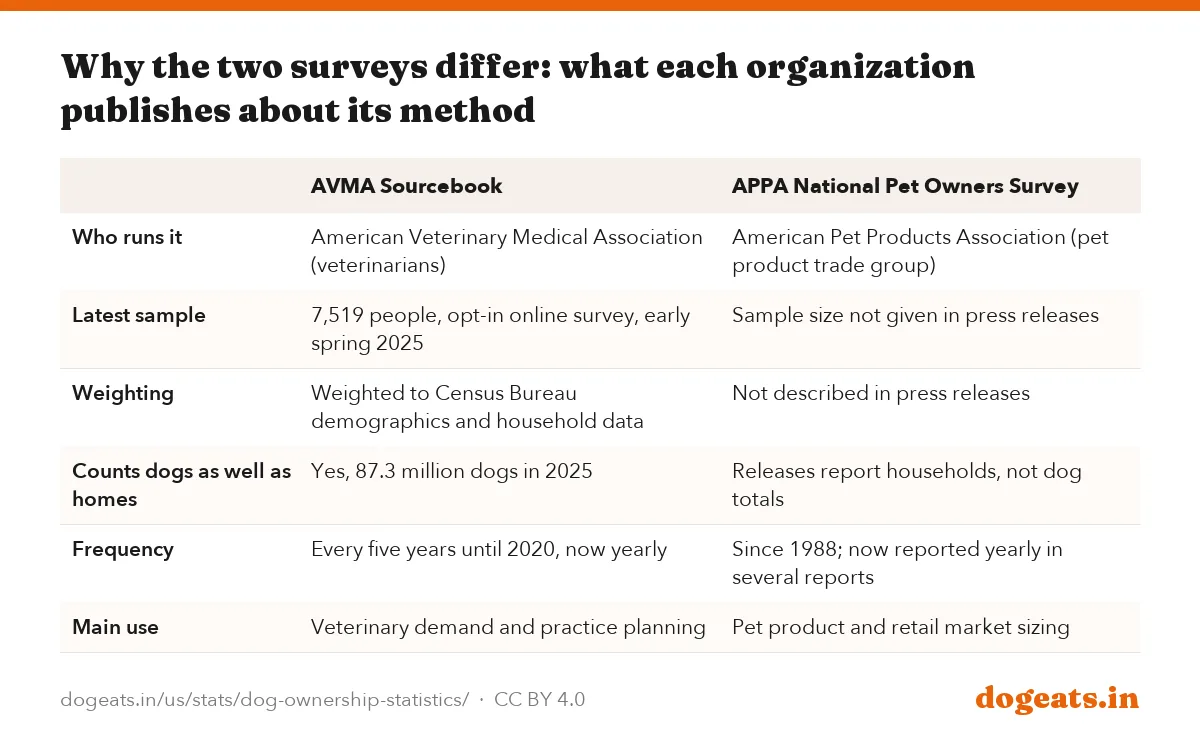
| AVMA Sourcebook | APPA National Pet Owners Survey | |
|---|---|---|
| Who runs it | American Veterinary Medical Association (veterinarians) | American Pet Products Association (pet product trade group) |
| Latest sample | 7,519 people, opt-in online survey, early spring 2025 | Sample size not given in press releases |
| Weighting | Weighted to Census Bureau demographics and household data | Not described in press releases |
| Counts dogs as well as homes | Yes, 87.3 million dogs in 2025 | Releases report households, not dog totals |
| Frequency | Every five years until 2020, now yearly | Since 1988; now reported yearly in several reports |
| Main use | Veterinary demand and practice planning | Pet product and retail market sizing |
Neither survey is wrong by design. Sampling, question wording and how a household with a part-time or shared dog answers can all move the result. When you cite a figure, name the survey and the year.
One wrinkle: APPA's 2025 release said pet-owning households grew from 82 million in 2023. Its earlier 2023 to 2024 survey had reported 86.9 million. Trade coverage also described the 68 million figure as a count of dogs, though APPA's own release calls it households.
Most dog homes have one dog
The AVMA reports an average of 1.6 dogs per dog-owning household in 2025. It says that figure has held steady since 1987. Cats show more change: 2.2 per cat household in 1987, down to 1.8 in 2025.
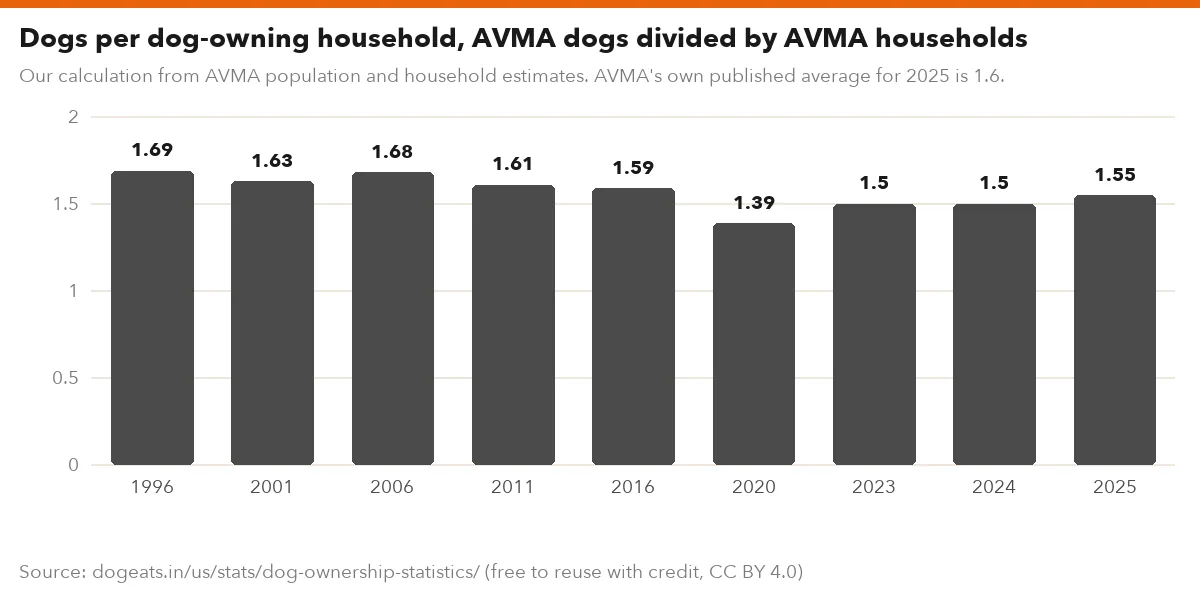
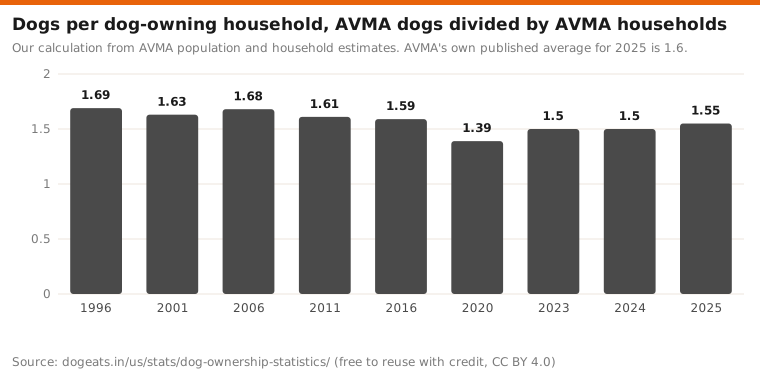
Dividing the AVMA's 2025 dog count by its household count gives 1.55 dogs per home, which rounds to the published 1.6. The same division gives lower values for 2020 to 2024, between 1.39 and 1.5.
The AVMA's 2020 survey found that 65% of dog-owning households had just one dog, up from 60% at the end of 2016. Single-dog homes are the norm in apartments and rentals, where pet limits are common.
Our calculation from AVMA population and household estimates. AVMA's own published average for 2025 is 1.6.
Show the numbers
| Label | Value |
|---|---|
| 1996 | 1.69 |
| 2001 | 1.63 |
| 2006 | 1.68 |
| 2011 | 1.61 |
| 2016 | 1.59 |
| 2020 | 1.39 |
| 2023 | 1.5 |
| 2024 | 1.5 |
| 2025 | 1.55 |
Embed this chart
Recent arrivals tilt toward cats. Among owners who acquired a pet in the previous two years, 54.5% got a dog in 2025, down from 57.3% in 2023. The share getting a cat rose from 43.5% to 47.6%.
Dog ownership by state: rural South leads
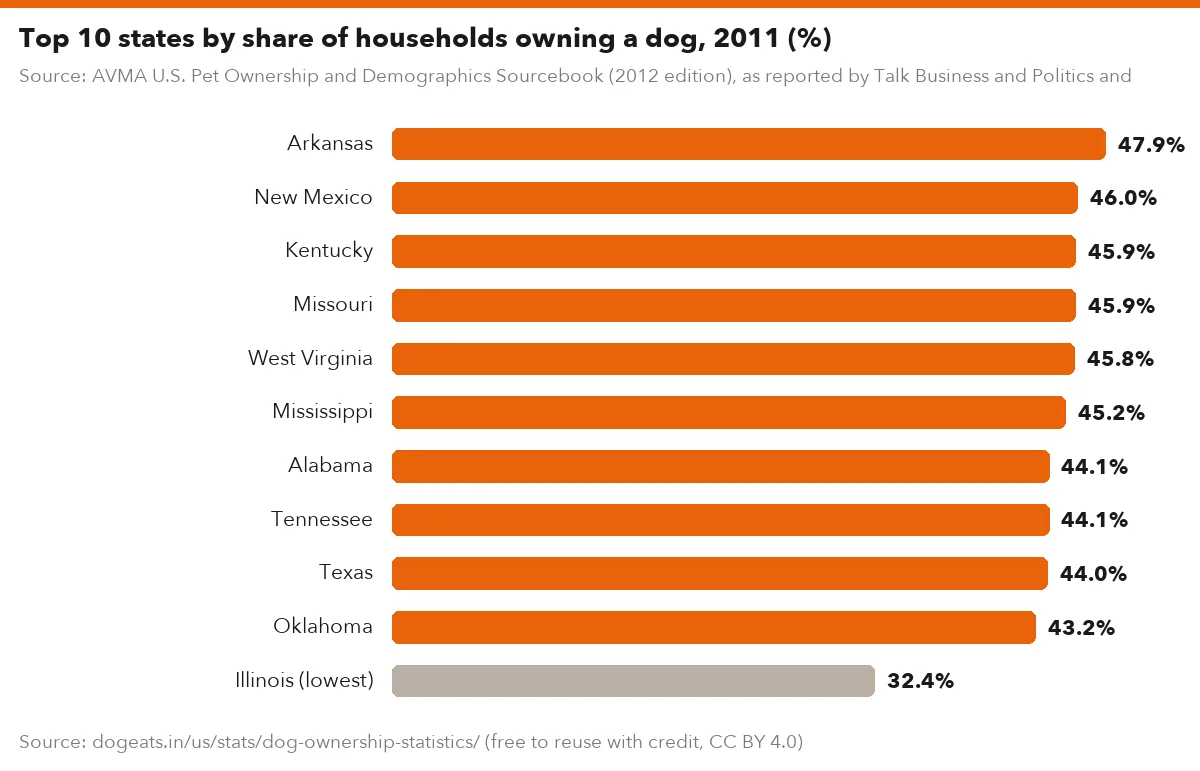
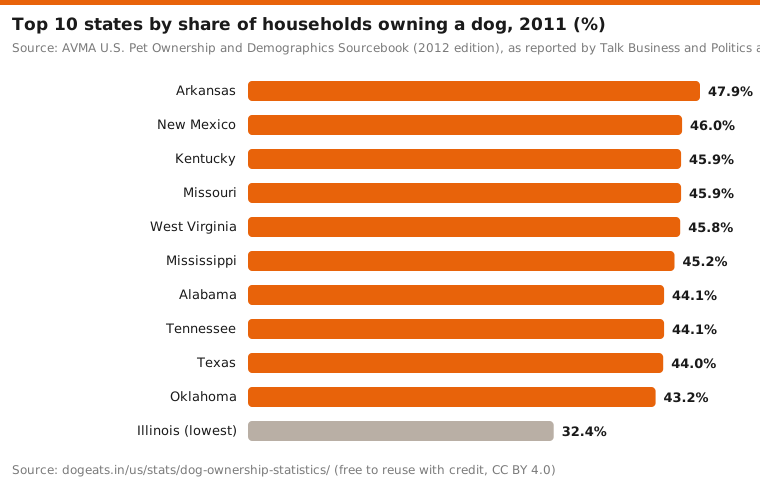
The AVMA's most recent public ranking of dog ownership by state uses data for December 31, 2011, from its 2012 Sourcebook. Arkansas topped the list, with 47.9% of households owning a dog. Illinois had the lowest rate, at 32.4%.
Nine of the top 10 dog states were in the South or Southwest. Rural states with more single-family homes and yard space tend to rank high. Dense, urban states rank lower.
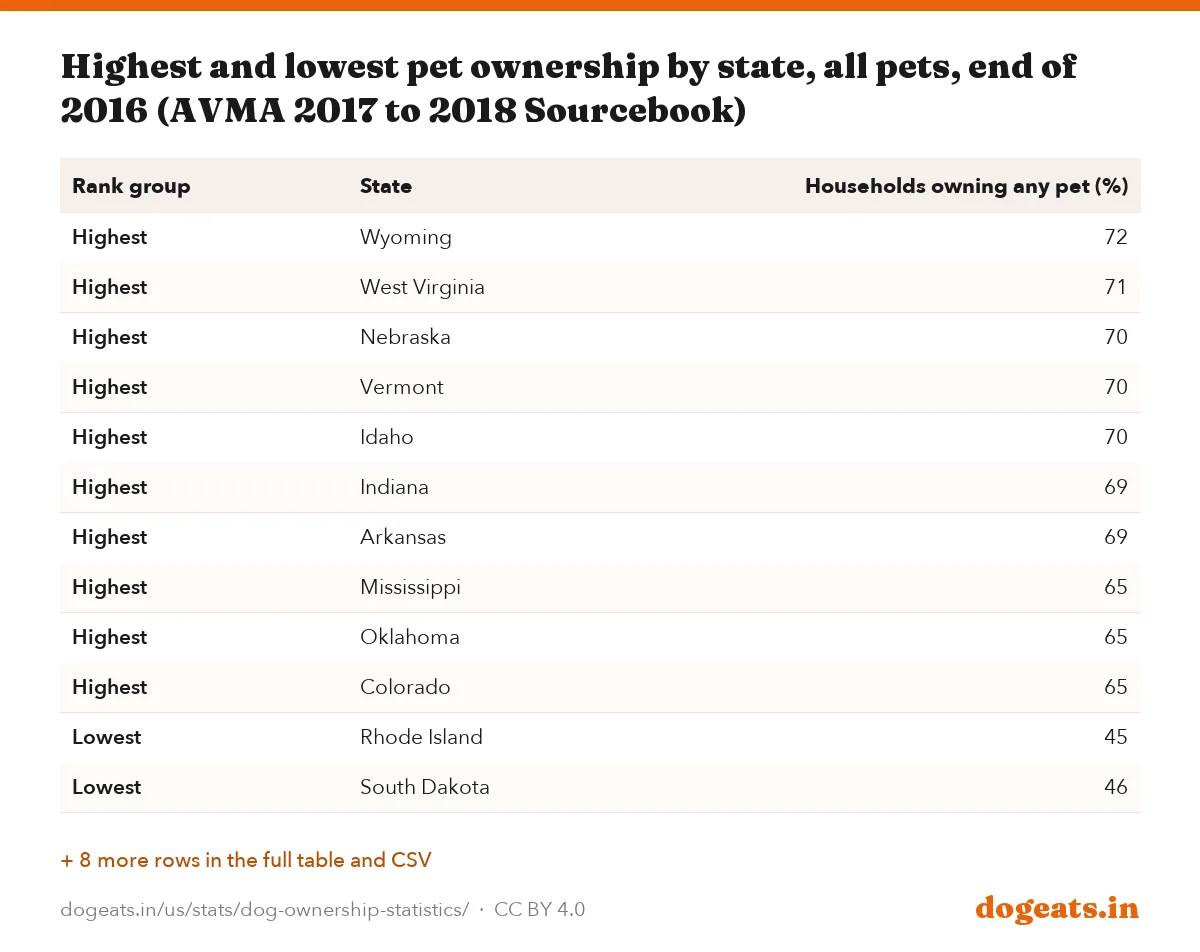
The 2017 to 2018 Sourcebook published overall pet ownership by state for 2016 rather than a dog-only ranking. Wyoming led at 72% of households owning any pet. Rhode Island was lowest at 45%.
Source: AVMA U.S. Pet Ownership and Demographics Sourcebook (2012 edition), as reported by Talk Business and Politics and PetfoodIndustry, January 2013.
Show the numbers
| Label | % |
|---|---|
| Arkansas | 47.9% |
| New Mexico | 46.0% |
| Kentucky | 45.9% |
| Missouri | 45.9% |
| West Virginia | 45.8% |
| Mississippi | 45.2% |
| Alabama | 44.1% |
| Tennessee | 44.1% |
| Texas | 44.0% |
| Oklahoma | 43.2% |
| Illinois (lowest) | 32.4% |
Embed this chart
| Rank group | State | Households owning any pet (%) |
|---|---|---|
| Highest | Wyoming | 72 |
| Highest | West Virginia | 71 |
| Highest | Nebraska | 70 |
| Highest | Vermont | 70 |
| Highest | Idaho | 70 |
| Highest | Indiana | 69 |
| Highest | Arkansas | 69 |
| Highest | Mississippi | 65 |
| Highest | Oklahoma | 65 |
| Highest | Colorado | 65 |
| Lowest | Rhode Island | 45 |
| Lowest | South Dakota | 46 |
| Lowest | New Jersey | 47 |
| Lowest | Maryland | 49 |
| Lowest | Illinois | 49 |
| Lowest | Massachusetts | 49 |
| Lowest | New York | 50 |
| Lowest | Connecticut | 50 |
| Lowest | Georgia | 51 |
| Lowest | New Hampshire | 52 |
These state figures are old. The AVMA's newer editions sell state detail in the full report but have not released a public dog-by-state ranking we could find. Treat any recent dog-by-state list from other sites with care, and ask for its source.
South Dakota appears among the lowest states in 2016 after ranking third highest in 2011. Small state samples can swing widely between editions.
Gen Z and millennials are driving new dog ownership
APPA reports ownership by generation; the AVMA's public summaries do not. In APPA's 2025 report, Gen Z made up 20% of dog owners. That was an 18% increase from 2023.
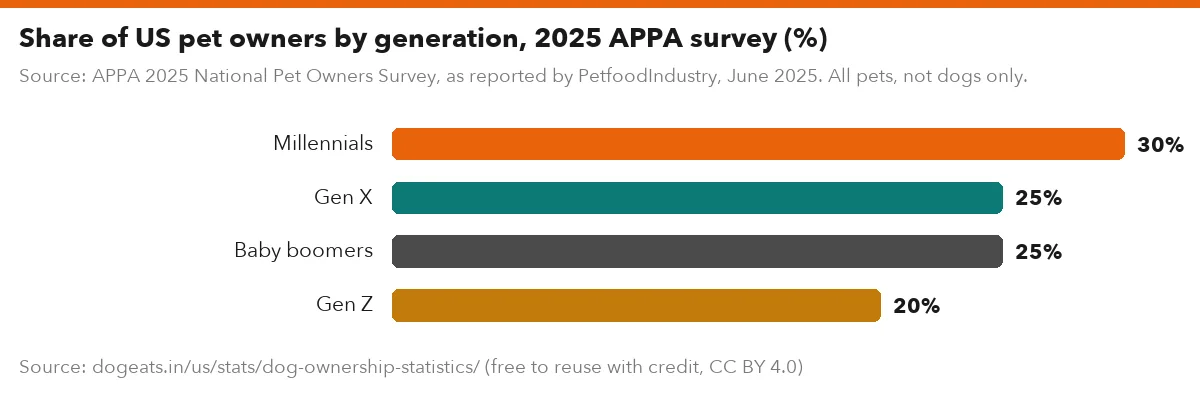
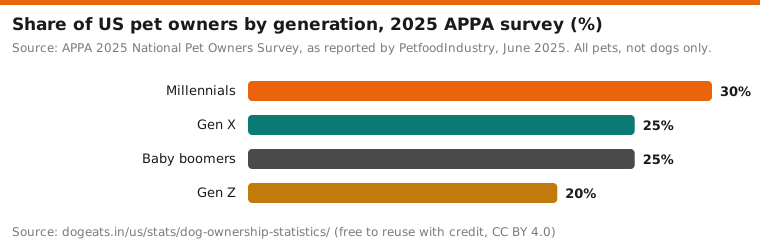
Millennials are the largest pet-owning generation, with 30% of pet owners in APPA's 2025 survey. Gen X and baby boomers held 25% each and Gen Z 20%. These shares cover owners of any pet, not just dogs.
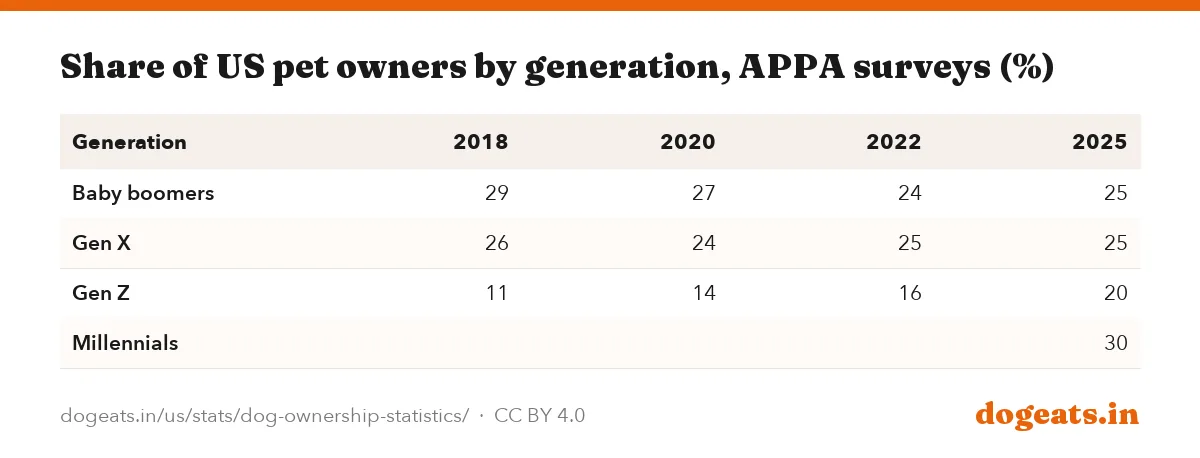
Boomers are a shrinking share. They were 29% of pet owners in 2018, 27% in 2020 and 24% in 2022. Gen Z grew from 11% to 16% over the same years.
Source: APPA 2025 National Pet Owners Survey, as reported by PetfoodIndustry, June 2025. All pets, not dogs only.
Show the numbers
| Label | % |
|---|---|
| Millennials | 30% |
| Gen X | 25% |
| Baby boomers | 25% |
| Gen Z | 20% |
Embed this chart
| Generation | 2018 | 2020 | 2022 | 2025 |
|---|---|---|---|---|
| Baby boomers | 29 | 27 | 24 | 25 |
| Gen X | 26 | 24 | 25 | 25 |
| Gen Z | 11 | 14 | 16 | 20 |
| Millennials | 30 |
Young men are a growing part of the picture. APPA's 2025 release said 58% of Gen Z dog owners and 63% of millennial dog owners are men. In 2025 data, Gen X dog ownership also rose 12% year over year.
Who owns dogs: homes, incomes and vet habits
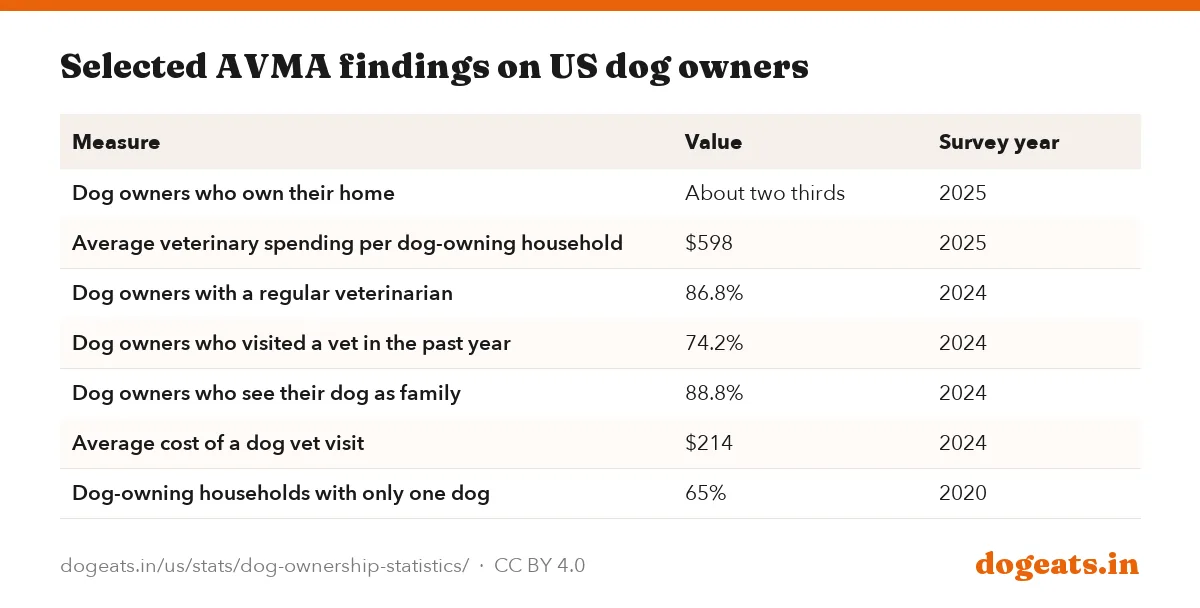
About two thirds of dog owners owned their homes in 2025, the AVMA reports. AVMA economists link dog numbers to home ownership, household income and remote work. When those rise, dog ownership tends to follow.
In AVMA's 2024 survey, the most common household income band among dog owners was $50,000 to $74,999. Among cat owners it was $30,000 or less.
Dog owners are heavy users of veterinary care. In 2024, 86.8% said they had a regular veterinarian and 74.2% had visited one in the past year. Most dog owners (88.8%) called their dog a member of the family.
| Measure | Value | Survey year |
|---|---|---|
| Dog owners who own their home | About two thirds | 2025 |
| Average veterinary spending per dog-owning household | $598 | 2025 |
| Dog owners with a regular veterinarian | 86.8% | 2024 |
| Dog owners who visited a vet in the past year | 74.2% | 2024 |
| Dog owners who see their dog as family | 88.8% | 2024 |
| Average cost of a dog vet visit | $214 | 2024 |
| Dog-owning households with only one dog | 65% | 2020 |
- Spending: dog owners spent more than $1,700 a year on their pets in 2023 and 2024, excluding purchase or adoption (AVMA).
- Household makeup: 86% of pet-owning households had two or more adults and 54% had children 17 or younger (AVMA 2025).
- Acquisition: people who worked remotely in 2020 were eight times as likely to acquire a pet, the AVMA found.
For what all those dogs cost to keep, see our cost of owning a dog report. For which breeds Americans register most, see the most popular dog breeds.
Using these numbers responsibly
A safe summary for 2025: roughly 87 million pet dogs, living in somewhere between 56 million and 71 million US homes. The lower figure is the AVMA's and the higher one is APPA's.
If you need a dog count, use the AVMA, since APPA's releases report households. If you need a trend, compare editions of the same survey, never one survey against the other.
More dogs at home also means more chances for kitchen accidents. Our US food safety statistics and holiday food dangers report cover the foods vets see most often around Thanksgiving, Halloween and Christmas.
Frequently asked questions
How many dogs are there in the US?
The AVMA estimates 87.3 million pet dogs in 2025. Its peak was 89.7 million in 2024. The figure was 52.9 million in 1996, so the population has grown about 65% since then.
What percentage of US households have a dog?
The AVMA says 42.6% of US households owned a dog in 2025, or 56.3 million homes. APPA's survey says 53%, or 71 million homes. The two surveys use different samples and methods, so their figures should not be mixed.
Why do AVMA and APPA numbers differ so much?
They are separate surveys run by different organizations. Sampling, question wording and weighting all differ. The AVMA weights its 7,519-person survey to Census household data; APPA's releases do not describe their sample. Their 2025 dog household estimates are 14.7 million apart.
How many dogs does the average dog owner have?
The AVMA reports an average of 1.6 dogs per dog-owning household in 2025, the same as in 1987. In 2020, 65% of dog-owning households had just one dog.
Which state has the most dog owners?
In the AVMA's last public state ranking, for 2011, Arkansas led with 47.9% of households owning a dog. New Mexico, Kentucky and Missouri followed. Illinois was lowest at 32.4%.
Is dog ownership going up or down?
Over the long run it is going up. The AVMA's dog-owning households grew from 31.3 million in 1996 to 56.3 million in 2025. The share dipped from 45.5% in 2024 to 42.6% in 2025, while APPA reported a rise to 53%.
Which generation owns the most dogs?
Millennials are the largest pet-owning generation, at 30% of pet owners in APPA's 2025 survey. Gen Z made up 20% of dog owners, up 18% from 2023.
How many dogs are there per person in the US?
Dividing the AVMA's 87.3 million dogs by the Census Bureau's 341.8 million residents gives about 25.5 dogs per 100 people. It works out to roughly one dog for every four Americans.
Methodology and limitations
We read AVMA News articles from October 2022 and October 2024, the AVMA's December 2025 chart of the month and its U.S. pet ownership statistics page, all in October 2026. Dog population values for each year are read from the AVMA's published 2025 Sourcebook chart. Household counts for 1991 to 2024 are read from the AVMA chart in its October 2024 article.
APPA figures come from APPA press releases dated March 2025, May 2026 and July 2026, and from PetfoodIndustry coverage of the 2023 to 2024 survey. State figures come from trade and news reports of AVMA Sourcebooks, because the AVMA's own state tables sit in paid reports.
We calculated dogs per household by dividing AVMA dog counts by AVMA household counts, and dogs per 100 people with the Census Bureau's Vintage 2025 estimate of 341.8 million. Percent changes are our own arithmetic on the published figures.
Sources
- AVMA, U.S. pet ownership statistics (2025 Sourcebook), 2025 dog households, share, dogs per household, dog population, survey method
- AVMA News, Pet population continues to increase while pet spending declines (Oct 2024), 1996 to 2024 dog population and households, 45.5% share, owner profile
- APPA, 2026 Dog Report press release (July 2026), 71 million dog-owning households, 53% of households in 2025
- Also consulted: AVMA, Chart of the month: Pet population trends (Dec 2025), AVMA News, Pet ownership rate stabilizes as spending increases (Oct 2022), APPA, 2025 State of the Industry press release (Mar 2025), APPA, 2026 State of the Industry release via ACCESS Newswire (May 2026), PetfoodIndustry, AVMA 2025 report coverage (Oct 2025), PetfoodIndustry, APPA 2023 to 2024 survey coverage (Oct 2023), PetfoodIndustry, APPA 2025 survey coverage (Jun 2025), Talk Business and Politics, AVMA 2012 Sourcebook state ranking (Jan 2013), PetfoodIndustry, AVMA 2012 Sourcebook coverage (Jan 2013), PETS+, AVMA 2017 to 2018 Sourcebook state coverage, US Census Bureau, Vintage 2025 population estimates release, AVMA Pet Ownership and Demographics Sourcebook product pages, APPA Industry Trends and Stats page.
Cite, embed and download
This report, its data and its images are free to reuse under a Creative Commons Attribution 4.0 licence. Credit dogeats.in with a link to this page. Every chart has its own embed code, every table has a CSV and an image download, and the images below are ready for social posts, slides and articles.
Cite this report
Link to this report

Every chart and table as an image