Data report · Updated October 2026
Dogs vs Cats Statistics: Which Pet Is More Popular, Which Has More Brain Cells, and What India Actually Counts
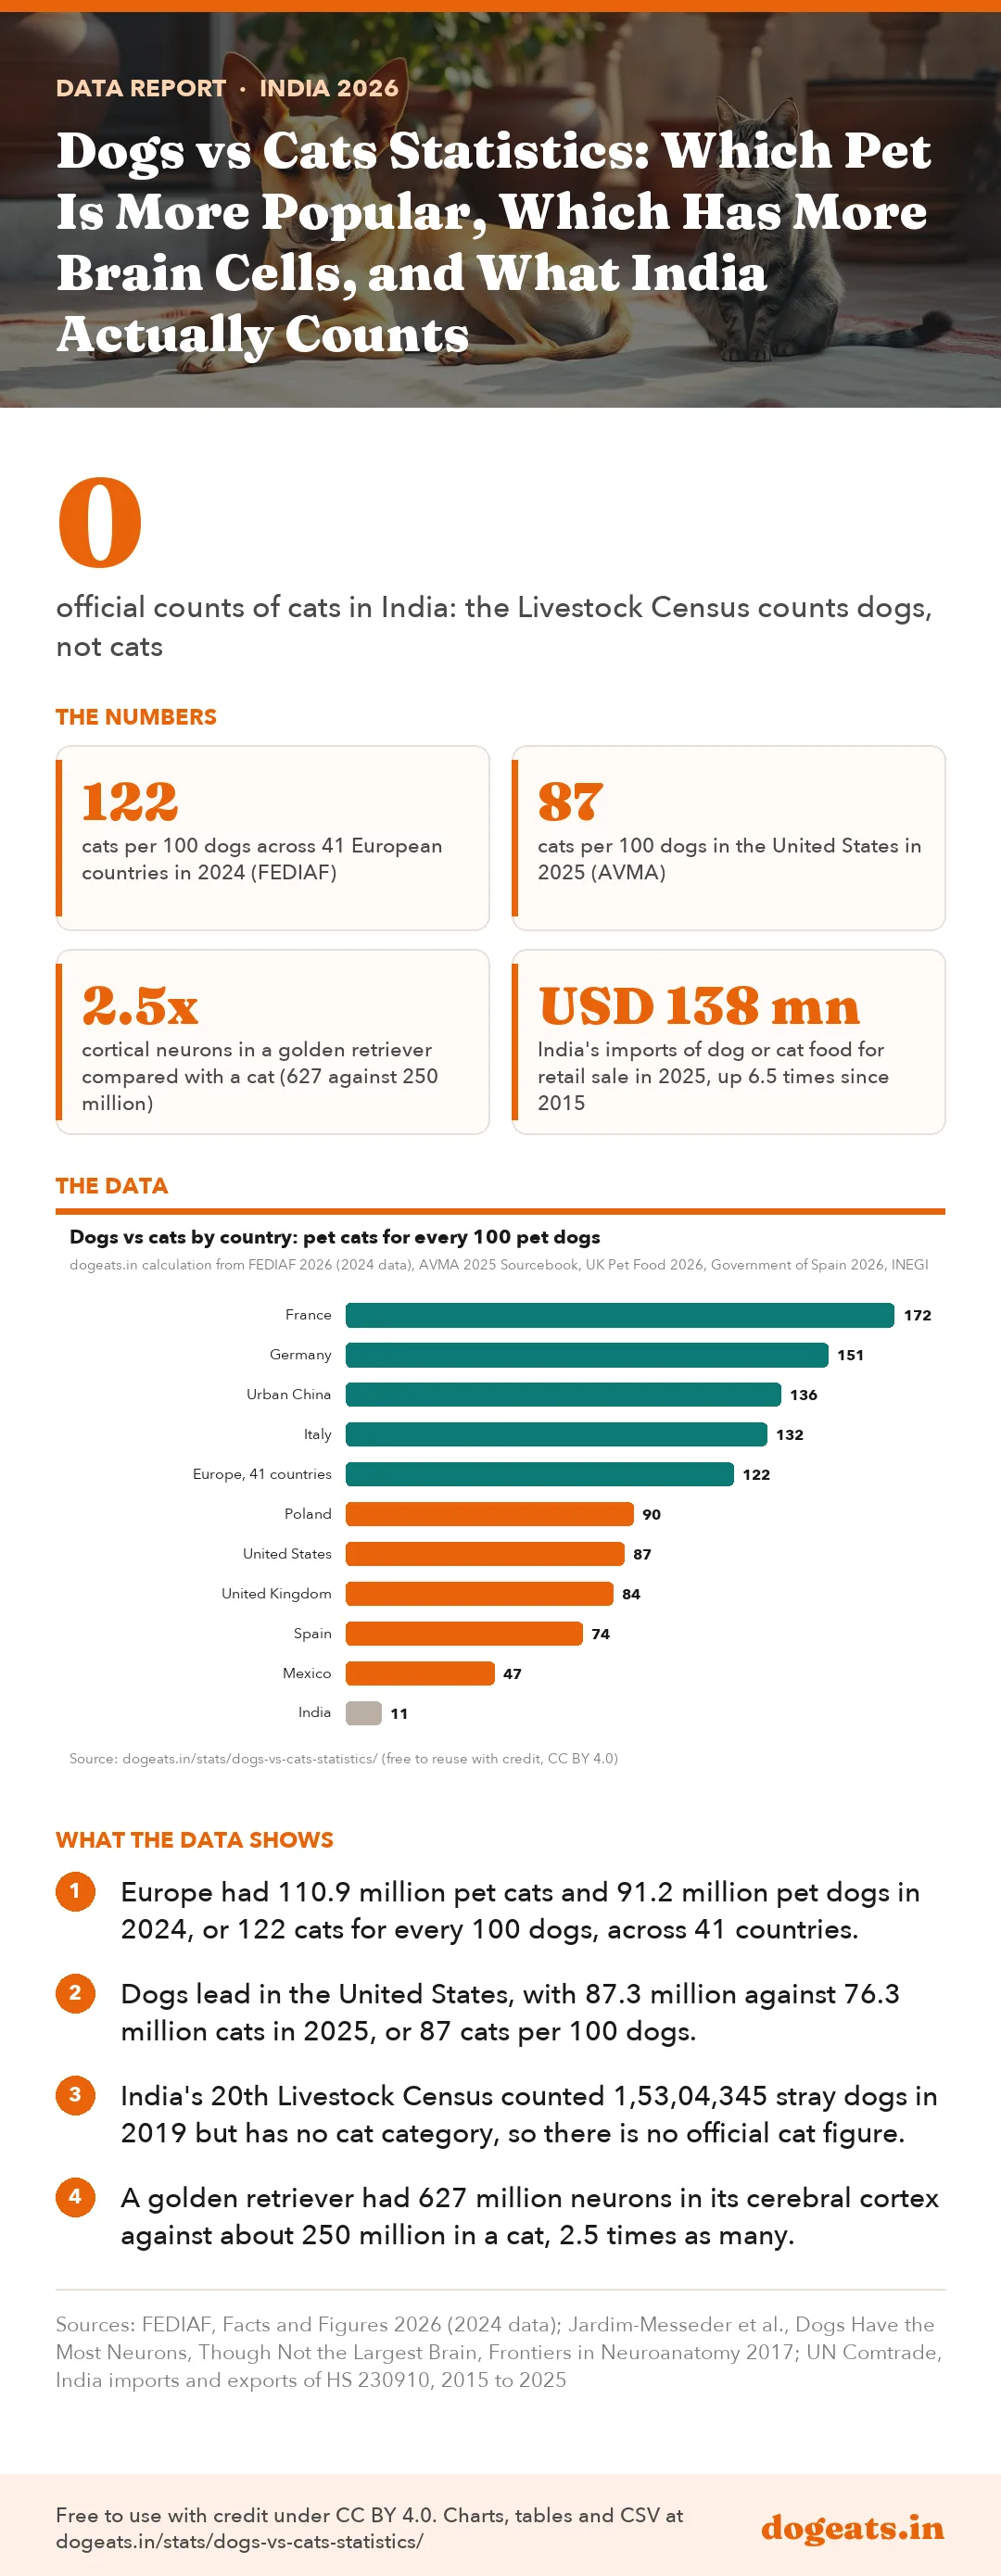
Cats outnumber dogs in Europe, 110.9 million to 91.2 million, and in urban China, while dogs lead in the US (87.3 million against 76.3 million) and Mexico. India has no official cat count at all. Industry estimates suggest about 11 cats for every 100 pet dogs, and a dog's cerebral cortex holds roughly twice the neurons of a cat's.

Key findings
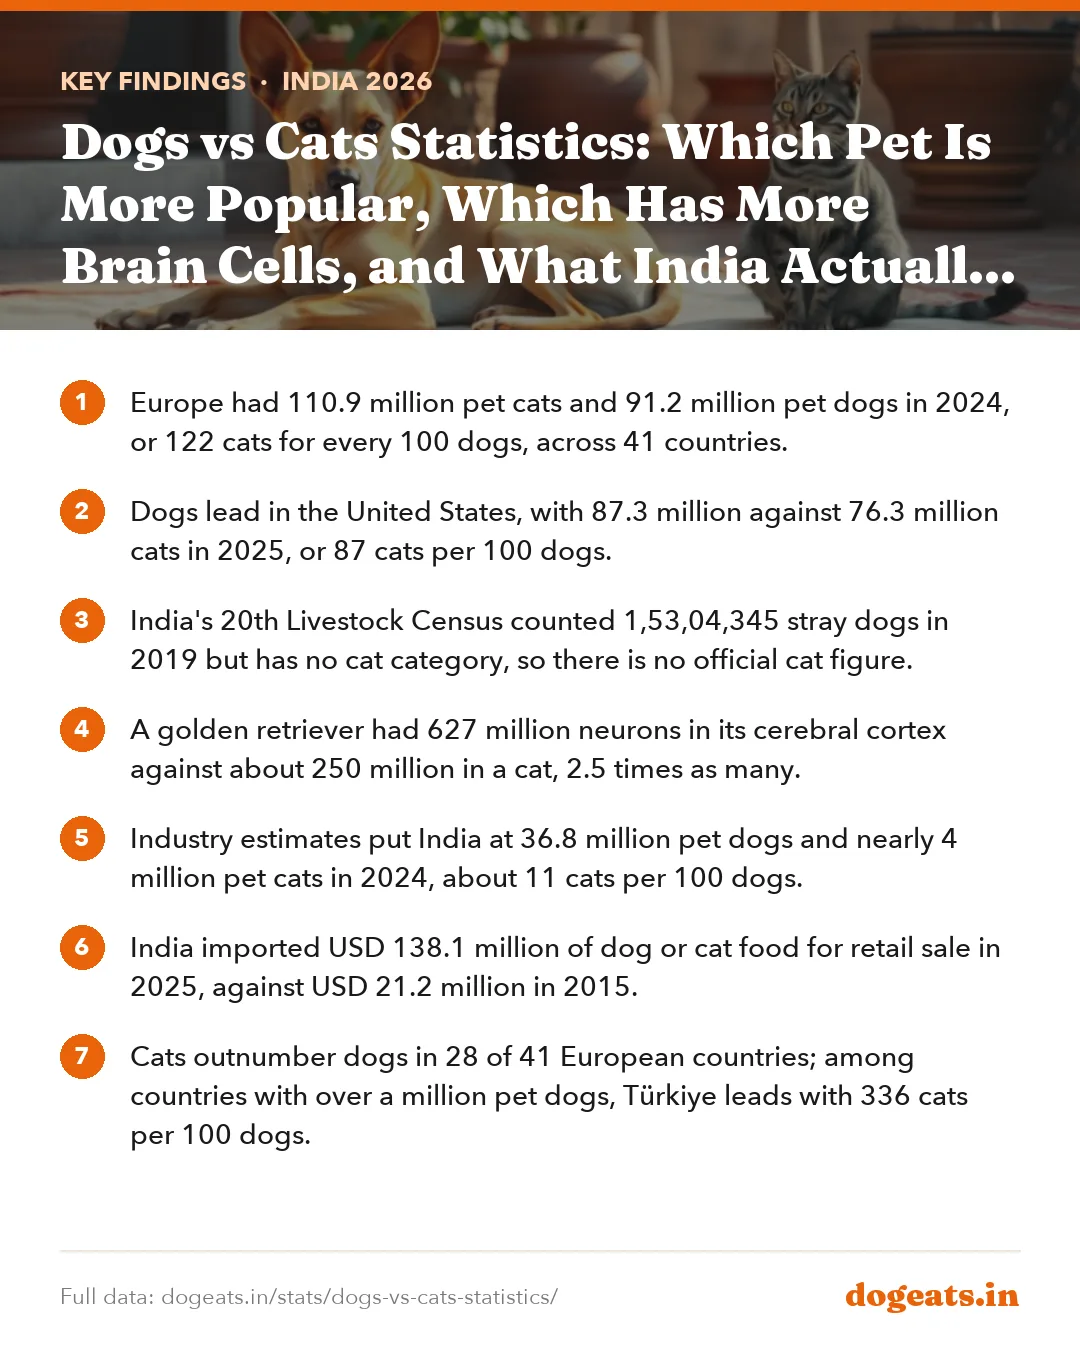
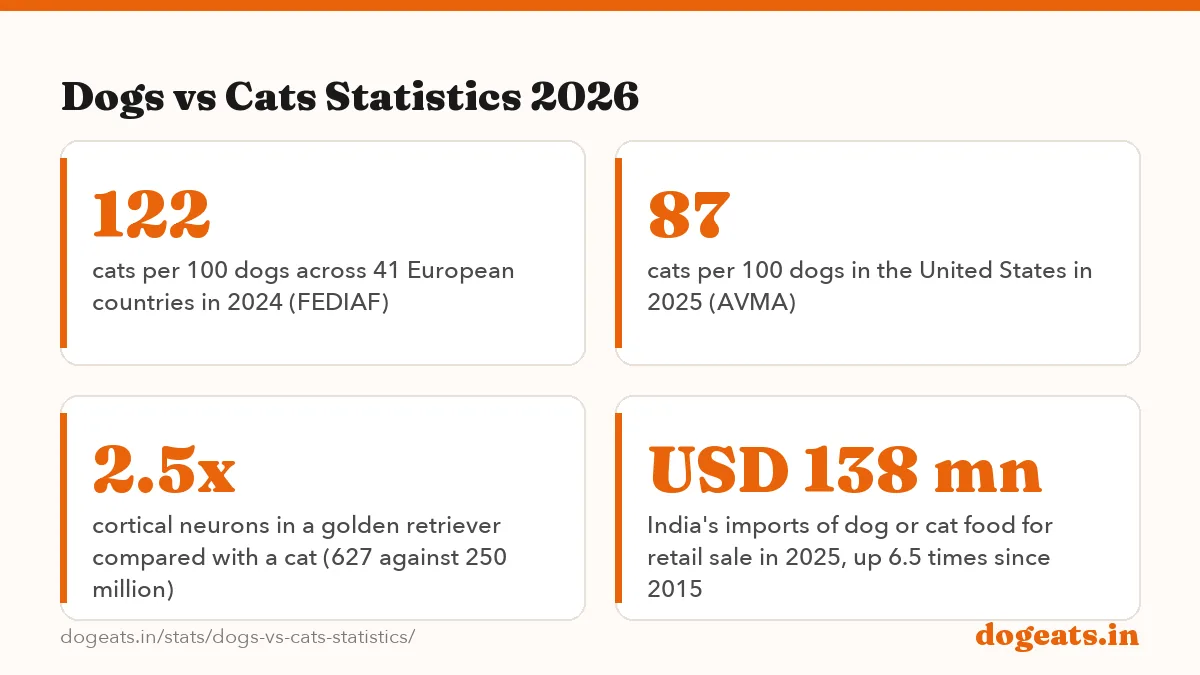
- Europe had 110.9 million pet cats and 91.2 million pet dogs in 2024, or 122 cats for every 100 dogs, across 41 countries.
- Dogs lead in the United States, with 87.3 million against 76.3 million cats in 2025, or 87 cats per 100 dogs.
- India's 20th Livestock Census counted 1,53,04,345 stray dogs in 2019 but has no cat category, so there is no official cat figure.
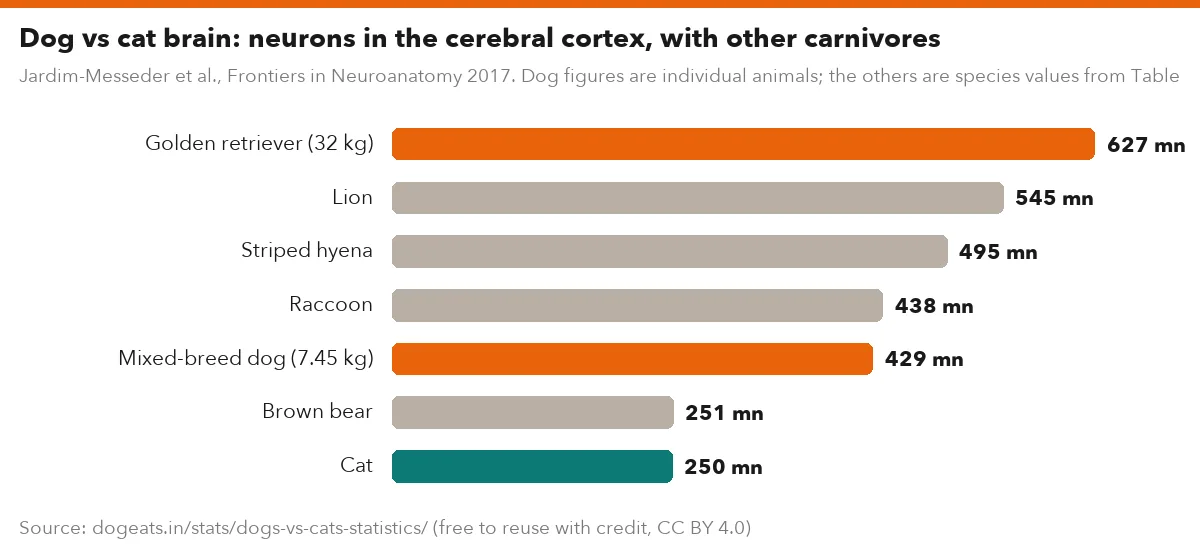
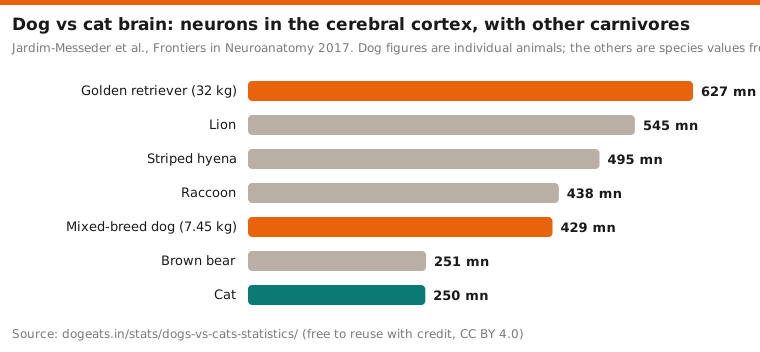
- A golden retriever had 627 million neurons in its cerebral cortex against about 250 million in a cat, 2.5 times as many.
- Industry estimates put India at 36.8 million pet dogs and nearly 4 million pet cats in 2024, about 11 cats per 100 dogs.
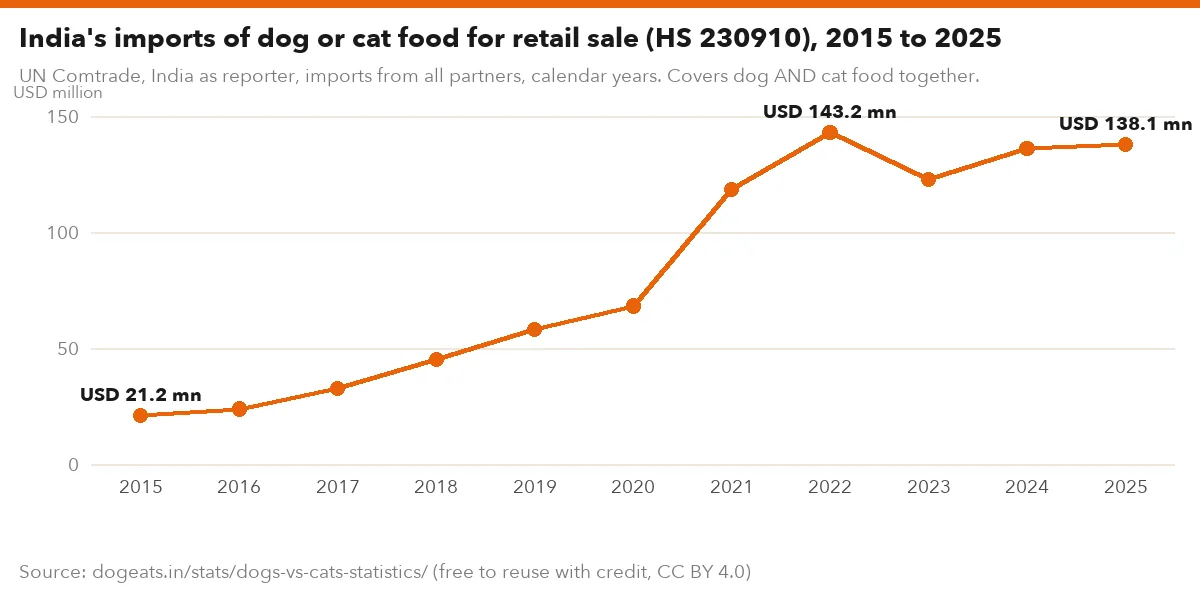
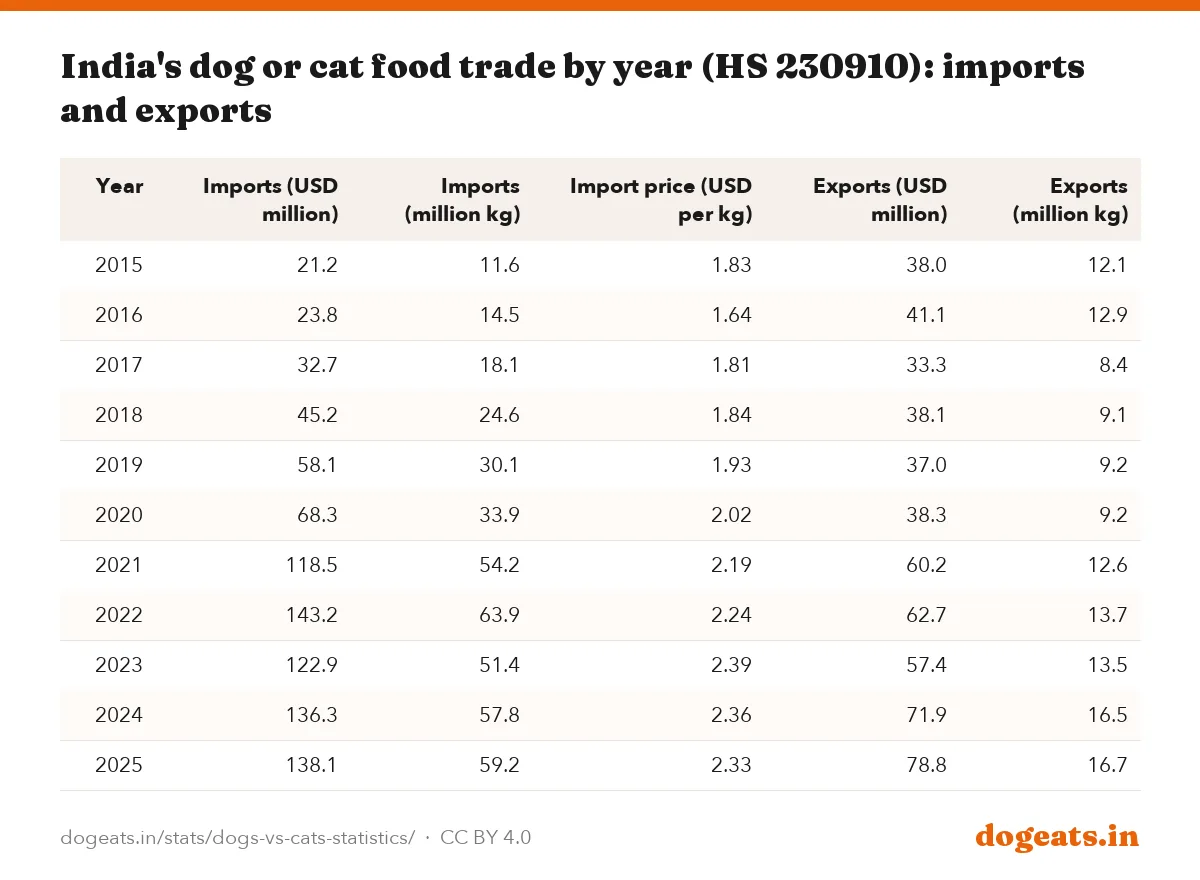
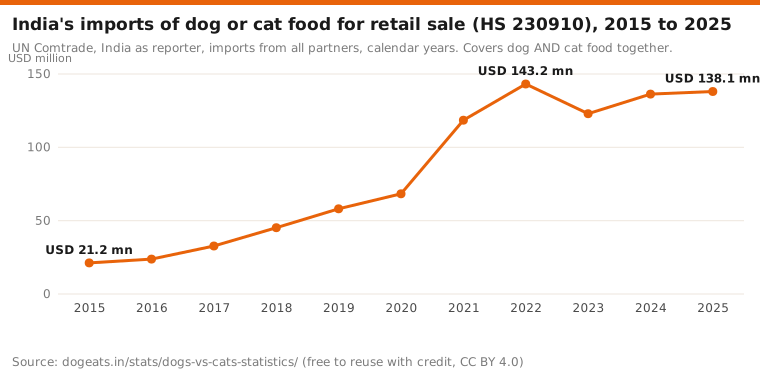
- India imported USD 138.1 million of dog or cat food for retail sale in 2025, against USD 21.2 million in 2015.
- Cats outnumber dogs in 28 of 41 European countries; among countries with over a million pet dogs, Türkiye leads with 336 cats per 100 dogs.
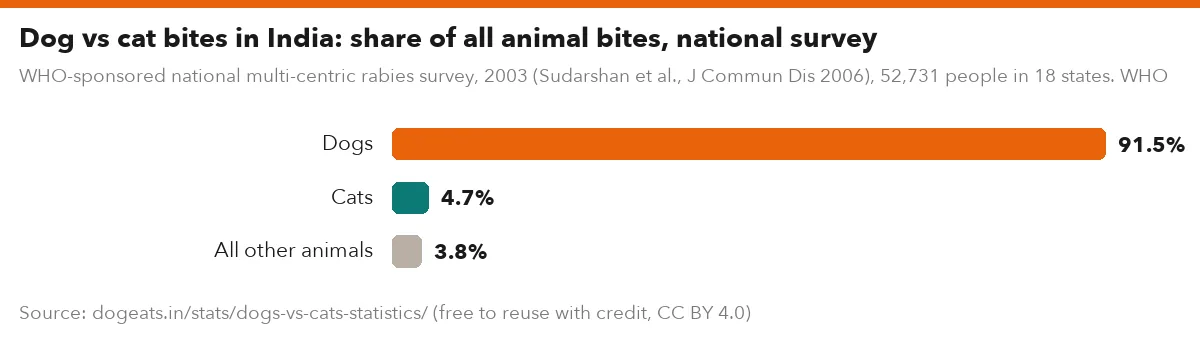
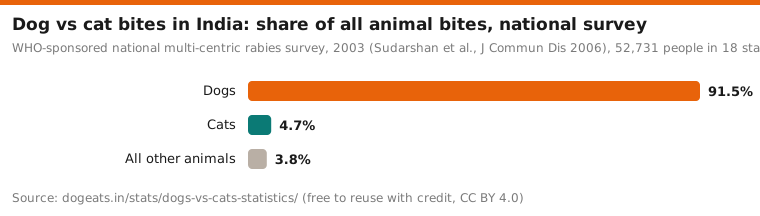
- In a 2003 national survey, dogs caused 91.5% of animal bites in India and cats 4.7%.
- Cats in English vet practices lived a median 14.0 years against 12.0 years for dogs.
Are cats or dogs more popular?
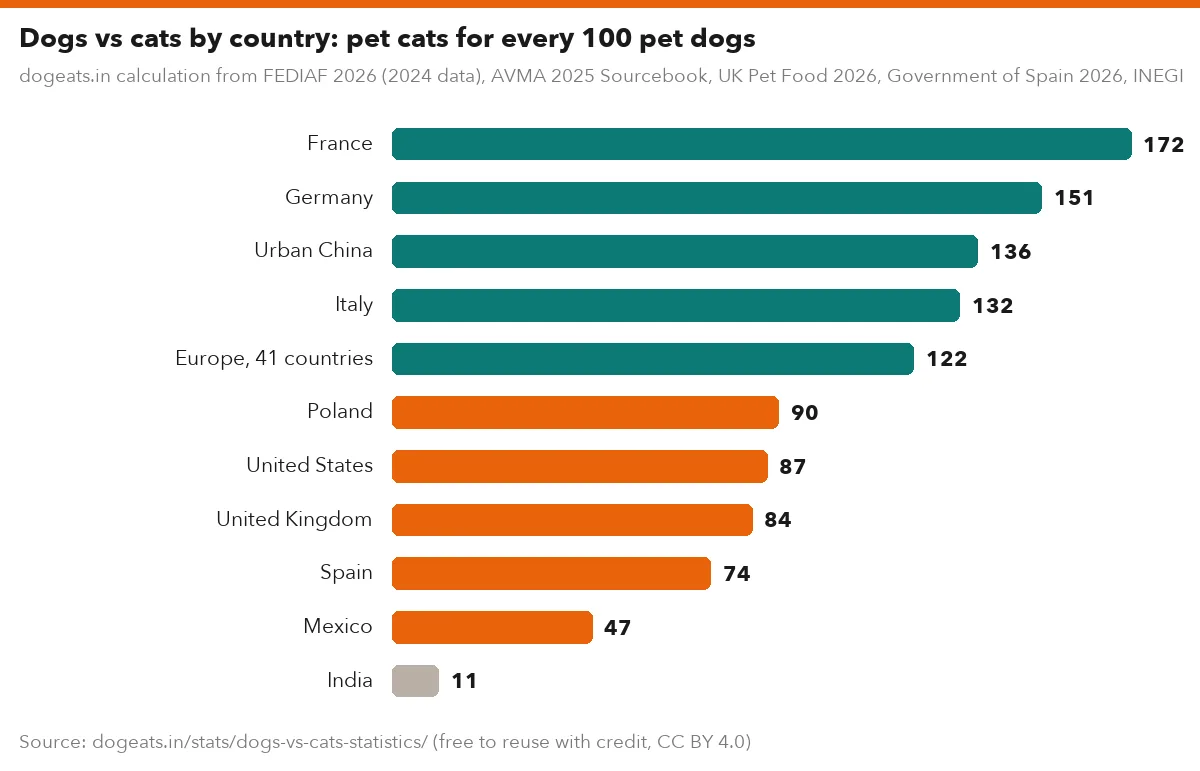
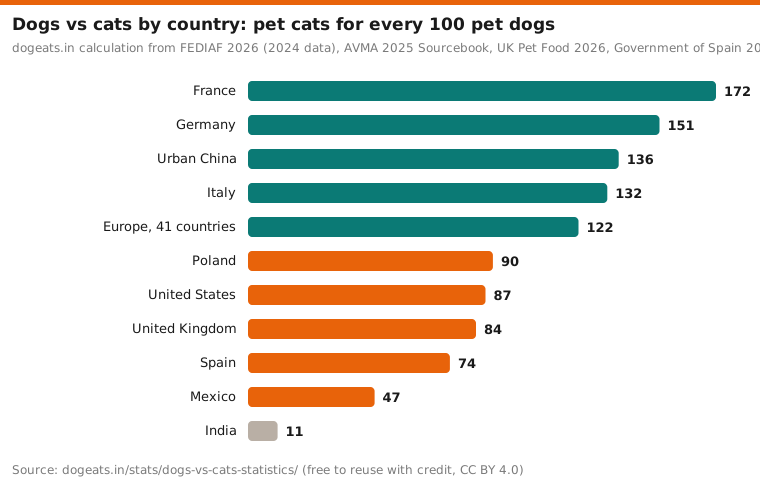
It depends on the country. Cats outnumber dogs across Europe and in urban China. Dogs lead in the United States, the United Kingdom, Spain, Mexico and, on industry estimates, India.
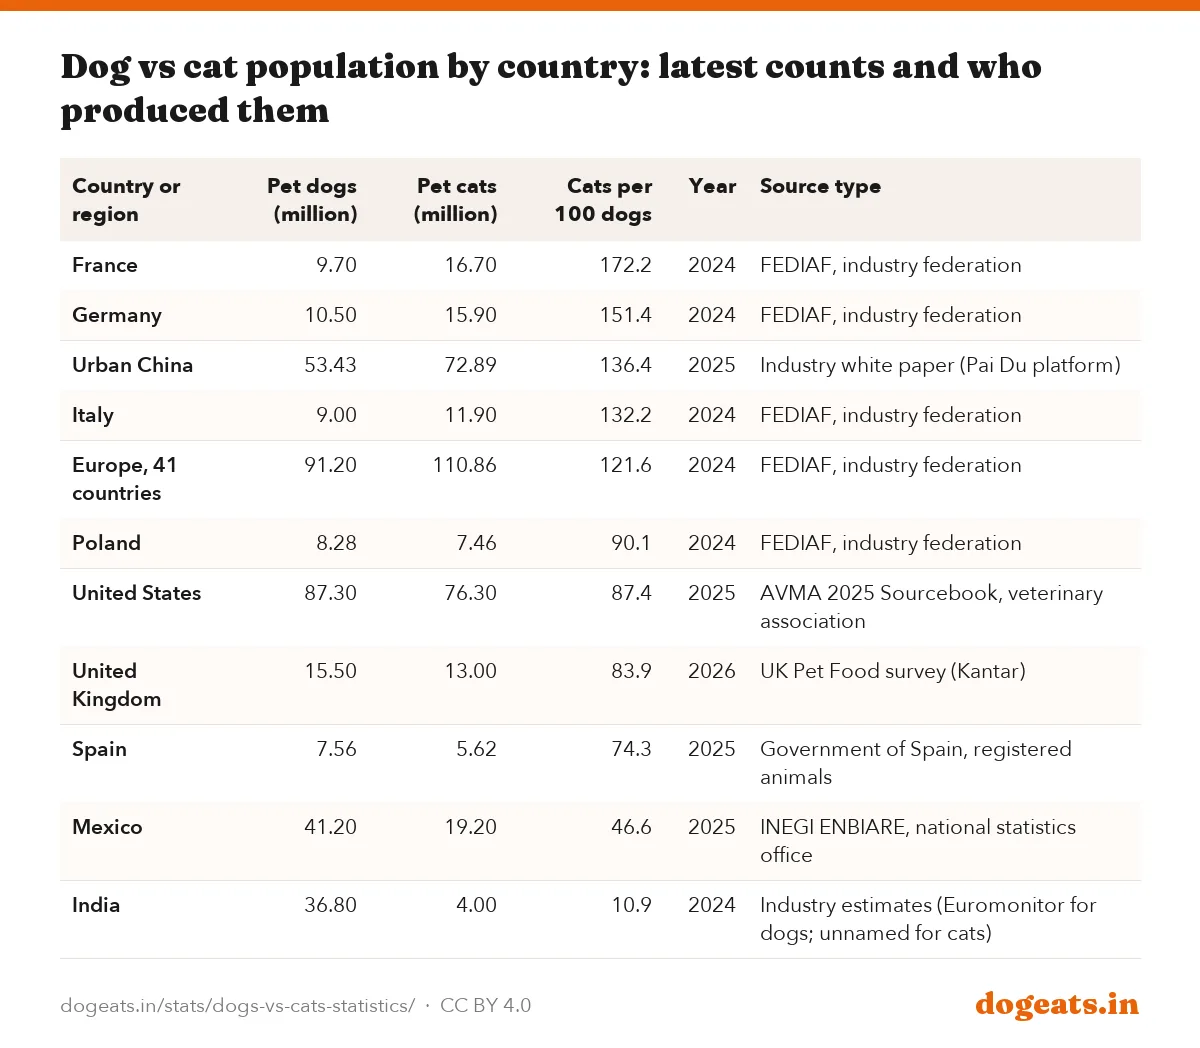
Europe's 41 countries had 110.9 million cats against 91.2 million dogs in 2024, according to FEDIAF. France had 172 cats for every 100 dogs. Urban China had 72.9 million cats and 53.4 million dogs in 2025.
The United States had 87.3 million dogs and 76.3 million cats in 2025, according to the AVMA's 2025 Sourcebook. Mexico's statistics office counted 41.2 million dogs and 19.2 million cats, fewer than half as many.
dogeats.in calculation from FEDIAF 2026 (2024 data), AVMA 2025 Sourcebook, UK Pet Food 2026, Government of Spain 2026, INEGI via adn40, Pai Du white paper via Guangming Online. India uses industry estimates, not an official count.
Show the numbers
| Label | cats per 100 dogs |
|---|---|
| France | 172 |
| Germany | 151 |
| Urban China | 136 |
| Italy | 132 |
| Europe, 41 countries | 122 |
| Poland | 90 |
| United States | 87 |
| United Kingdom | 84 |
| Spain | 74 |
| Mexico | 47 |
| India | 11 |
Embed this chart
| Country or region | Pet dogs (million) | Pet cats (million) | Cats per 100 dogs | Year | Source type |
|---|---|---|---|---|---|
| France | 9.70 | 16.70 | 172.2 | 2024 | FEDIAF, industry federation |
| Germany | 10.50 | 15.90 | 151.4 | 2024 | FEDIAF, industry federation |
| Urban China | 53.43 | 72.89 | 136.4 | 2025 | Industry white paper (Pai Du platform) |
| Italy | 9.00 | 11.90 | 132.2 | 2024 | FEDIAF, industry federation |
| Europe, 41 countries | 91.20 | 110.86 | 121.6 | 2024 | FEDIAF, industry federation |
| Poland | 8.28 | 7.46 | 90.1 | 2024 | FEDIAF, industry federation |
| United States | 87.30 | 76.30 | 87.4 | 2025 | AVMA 2025 Sourcebook, veterinary association |
| United Kingdom | 15.50 | 13.00 | 83.9 | 2026 | UK Pet Food survey (Kantar) |
| Spain | 7.56 | 5.62 | 74.3 | 2025 | Government of Spain, registered animals |
| Mexico | 41.20 | 19.20 | 46.6 | 2025 | INEGI ENBIARE, national statistics office |
| India | 36.80 | 4.00 | 10.9 | 2024 | Industry estimates (Euromonitor for dogs; unnamed for cats) |
| Measure | 1996 | 2024 | 2025 |
|---|---|---|---|
| Pet dogs (million) | 52.9 | Not given | 87.3 |
| Pet cats (million) | 59.8 | 73.8 | 76.3 |
| Cats per 100 dogs | 113 | Not given | 87 |
| Dogs per dog-owning household | Not given | Not given | 1.6 |
| Cats per cat-owning household | Not given | Not given | 1.8 |
Sources disagree, so the table names each one. For Spain, the government's register shows 7.6 million dogs and 5.6 million cats. FEDIAF's figures are lower, at 6.96 million and 4.94 million. For the UK, FEDIAF gives 13.4 million dogs and 12.3 million cats for 2024.
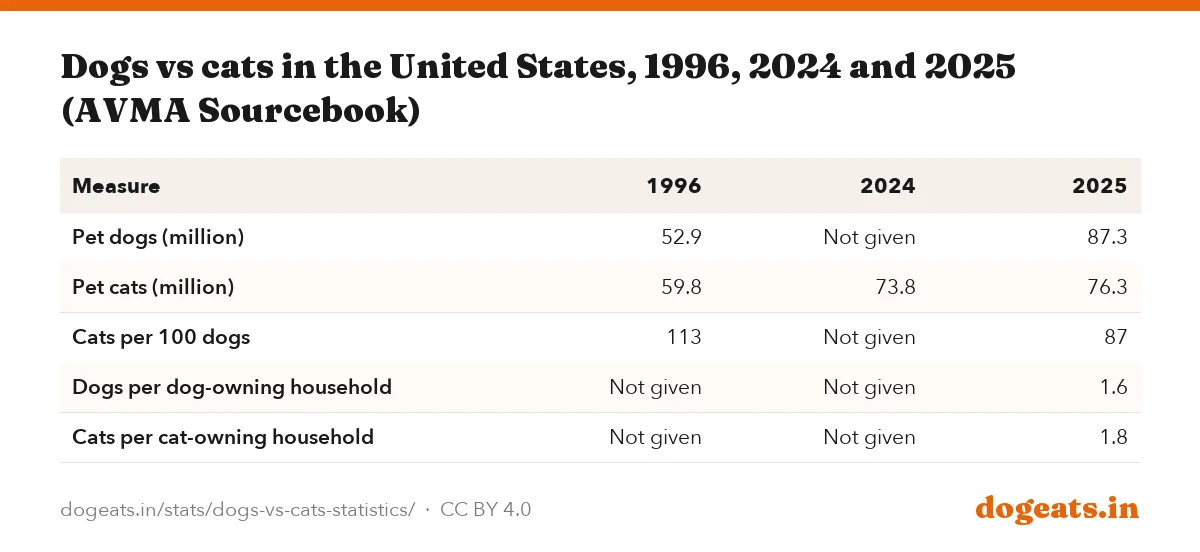
The US lead flipped within a generation. The AVMA put cats ahead in 1996, at 59.8 million against 52.9 million dogs. By 2025 dogs had risen 65% to 87.3 million. Dog owners kept an average 1.6 dogs and cat owners 1.8 cats.
Spain's register held 15,171,569 pets in 2025, of which 49.8% were dogs and 37.0% cats. Mexico's pet dogs fell 5.8% between 2021 and 2025, from 43,756,372 to 41,226,497.
Are cats or dogs more popular in India?
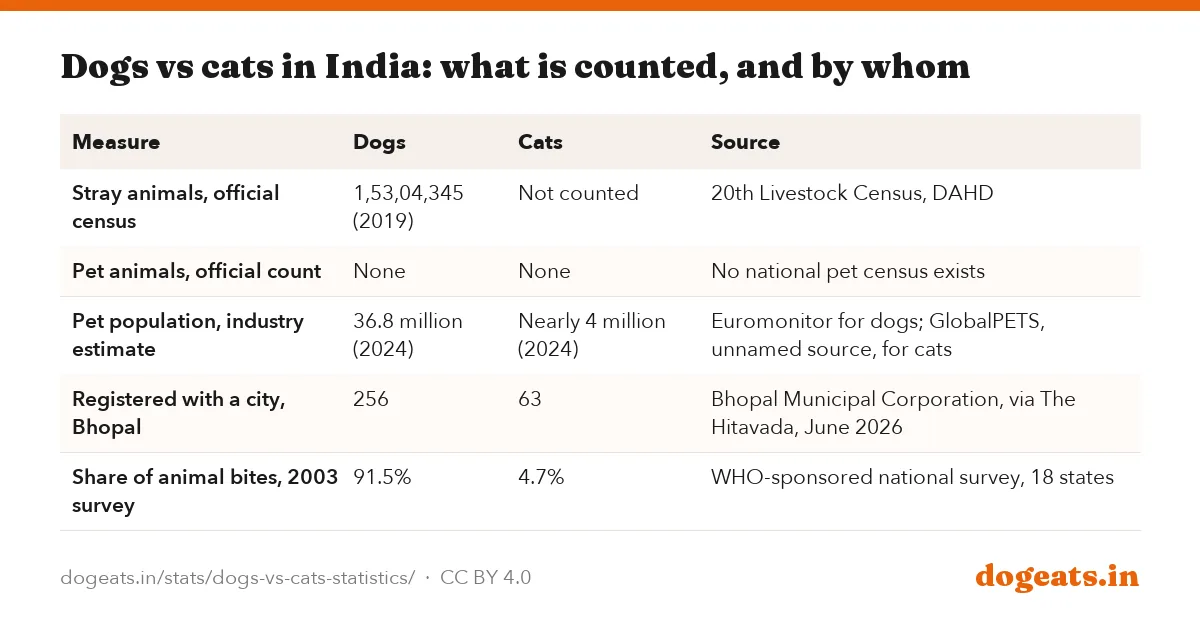
Dogs, on every estimate available, but India has never officially counted its cats. The 20th Livestock Census of 2019 listed 15 animal species, including dog, rabbit and elephant. Cat is not one of them.
That census counted 1,53,04,345 stray dogs. It gives no figure for pet cats or stray cats. Results of the 21st Livestock Census, enumerated from October 2024, had not been published by October 2026. Pet dog numbers come only from industry estimates, such as Euromonitor's 36.8 million for 2024.
A GlobalPETS report in April 2025 put Indian pet cats at nearly 4 million in 2024, without naming a source. On those numbers India has about 11 cats for every 100 pet dogs, far fewer than any other country in this report.

| Measure | Dogs | Cats | Source |
|---|---|---|---|
| Stray animals, official census | 1,53,04,345 (2019) | Not counted | 20th Livestock Census, DAHD |
| Pet animals, official count | None | None | No national pet census exists |
| Pet population, industry estimate | 36.8 million (2024) | Nearly 4 million (2024) | Euromonitor for dogs; GlobalPETS, unnamed source, for cats |
| Registered with a city, Bhopal | 256 | 63 | Bhopal Municipal Corporation, via The Hitavada, June 2026 |
| Share of animal bites, 2003 survey | 91.5% | 4.7% | WHO-sponsored national survey, 18 states |
WHO-sponsored national multi-centric rabies survey, 2003 (Sudarshan et al., J Commun Dis 2006), 52,731 people in 18 states. WHO says dogs cause up to 99% of human rabies cases worldwide.
Show the numbers
| Label | % |
|---|---|
| Dogs | 91.5% |
| Cats | 4.7% |
| All other animals | 3.8% |
Embed this chart
City registers are no better. Bhopal had 256 dogs and 63 cats registered in June 2026, about 25 cats per 100 dogs, a tiny fraction of the city's pets. Our pet ownership and pet food market report covers every Indian pet estimate we could trace.
Dog IQ vs cat IQ: who has more brain cells?
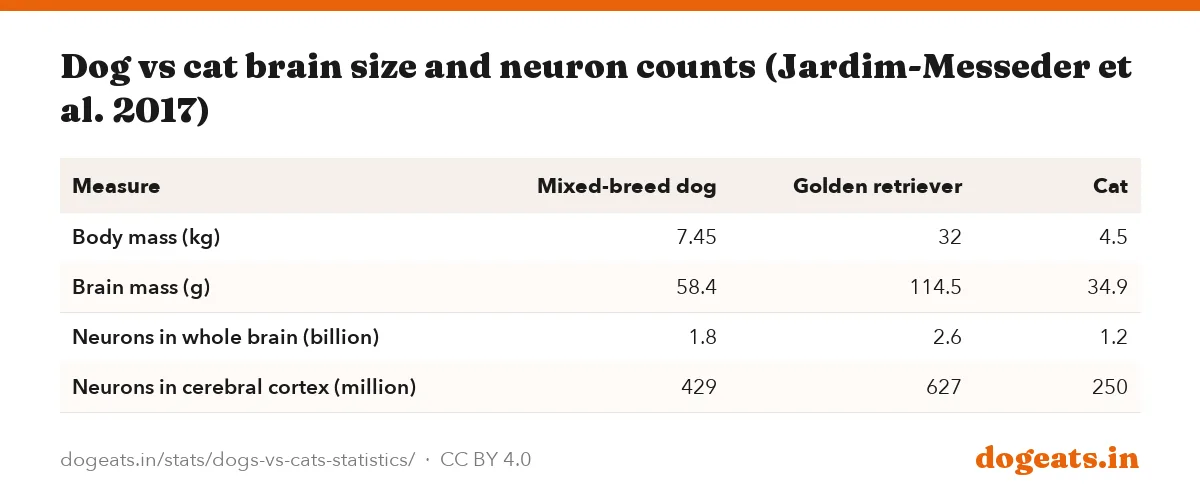
Dogs, by a wide margin. A 2017 study in Frontiers in Neuroanatomy counted neurons in the cerebral cortex, the part of the brain linked to thinking and planning. A 32 kg golden retriever had 627 million cortical neurons, against about 250 million in a cat.
A 7.45 kg mixed-breed dog had 429 million. The two dogs averaged 528 million, or 2.1 times the cat. The golden retriever had the most cortical neurons of any animal in the study, more than a lion, a striped hyena or a brown bear.
The whole dog brain held 1.8 billion and 2.6 billion neurons in the two dogs, against 1.2 billion in the cat. Neuron counts are not an IQ test. They measure capacity, and the study looked at only two dogs and one cat.
Jardim-Messeder et al., Frontiers in Neuroanatomy 2017. Dog figures are individual animals; the others are species values from Table 1.
Show the numbers
| Label | million neurons |
|---|---|
| Golden retriever (32 kg) | 627 mn |
| Lion | 545 mn |
| Striped hyena | 495 mn |
| Raccoon | 438 mn |
| Mixed-breed dog (7.45 kg) | 429 mn |
| Brown bear | 251 mn |
| Cat | 250 mn |
Embed this chart
| Measure | Mixed-breed dog | Golden retriever | Cat |
|---|---|---|---|
| Body mass (kg) | 7.45 | 32 | 4.5 |
| Brain mass (g) | 58.4 | 114.5 | 34.9 |
| Neurons in whole brain (billion) | 1.8 | 2.6 | 1.2 |
| Neurons in cerebral cortex (million) | 429 | 627 | 250 |
The authors also found that domestication did not change the neuron make-up of carnivore brains. For how dog breeds compare with each other, see our smartest dog breeds ranking.
How much dog and cat food does India import?
India imported USD 138.1 million of dog or cat food for retail sale in 2025, under customs code HS 230910. That was 6.5 times the USD 21.2 million of 2015, a rise of about 21% a year.
The trade code does not separate dog food from cat food. Every figure here covers both. Weight rose 5.1 times, from 11.6 million kg to 59.2 million kg.
Imports peaked at USD 143.2 million in 2022, dipped in 2023 and have partly recovered since. The average import price rose from USD 1.83 a kg in 2015 to USD 2.33 in 2025.
UN Comtrade, India as reporter, imports from all partners, calendar years. Covers dog AND cat food together.
Show the numbers
| Label | USD million |
|---|---|
| 2015 | USD 21.2 mn |
| 2016 | USD 23.8 mn |
| 2017 | USD 32.7 mn |
| 2018 | USD 45.2 mn |
| 2019 | USD 58.1 mn |
| 2020 | USD 68.3 mn |
| 2021 | USD 118.5 mn |
| 2022 | USD 143.2 mn |
| 2023 | USD 122.9 mn |
| 2024 | USD 136.3 mn |
| 2025 | USD 138.1 mn |
Embed this chart
| Year | Imports (USD million) | Imports (million kg) | Import price (USD per kg) | Exports (USD million) | Exports (million kg) |
|---|---|---|---|---|---|
| 2015 | 21.2 | 11.6 | 1.83 | 38.0 | 12.1 |
| 2016 | 23.8 | 14.5 | 1.64 | 41.1 | 12.9 |
| 2017 | 32.7 | 18.1 | 1.81 | 33.3 | 8.4 |
| 2018 | 45.2 | 24.6 | 1.84 | 38.1 | 9.1 |
| 2019 | 58.1 | 30.1 | 1.93 | 37.0 | 9.2 |
| 2020 | 68.3 | 33.9 | 2.02 | 38.3 | 9.2 |
| 2021 | 118.5 | 54.2 | 2.19 | 60.2 | 12.6 |
| 2022 | 143.2 | 63.9 | 2.24 | 62.7 | 13.7 |
| 2023 | 122.9 | 51.4 | 2.39 | 57.4 | 13.5 |
| 2024 | 136.3 | 57.8 | 2.36 | 71.9 | 16.5 |
| 2025 | 138.1 | 59.2 | 2.33 | 78.8 | 16.7 |
India also exports this food, USD 78.8 million in 2025. Exports sell at a higher average price, USD 4.71 a kg. On the Ministry of Commerce's TradeStat data in rupees, imports reached Rs 1,244 crore in 2025-26, as our pet food market report shows.
Do cat owners or dog owners spend more on food?
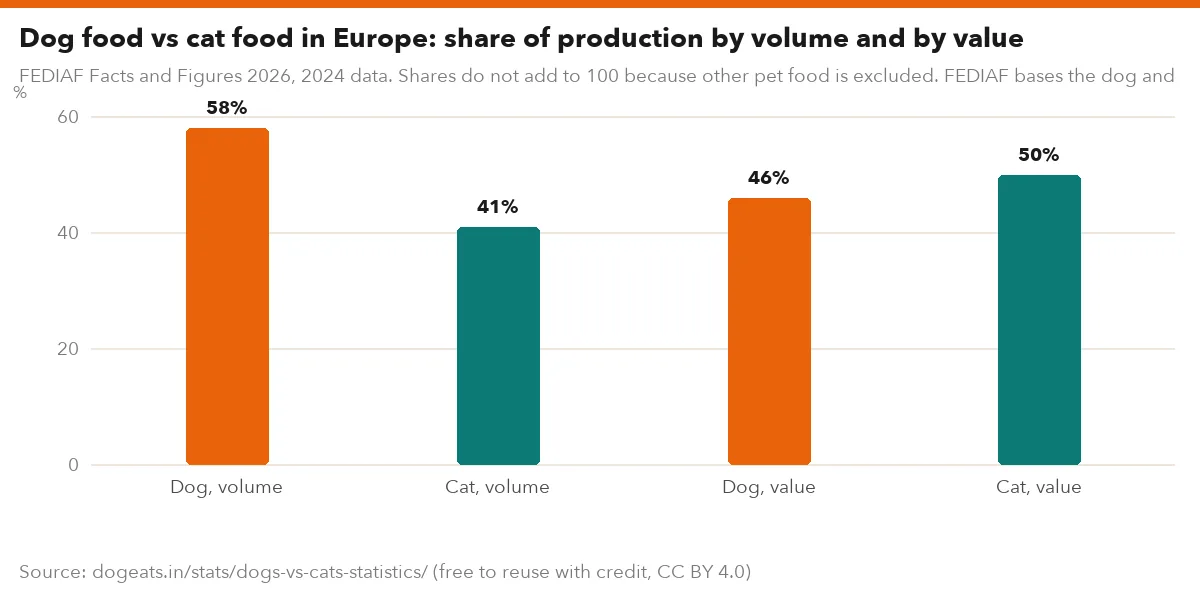
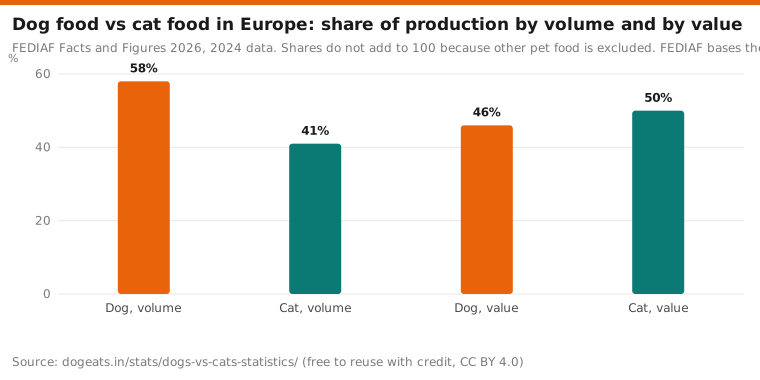
In Europe, dogs eat more pet food but cats eat the pricier kind. Dog food made up 58% of the pet food Europe produced by volume, and cat food 41%. By value the split flips, 46% dog and 50% cat.
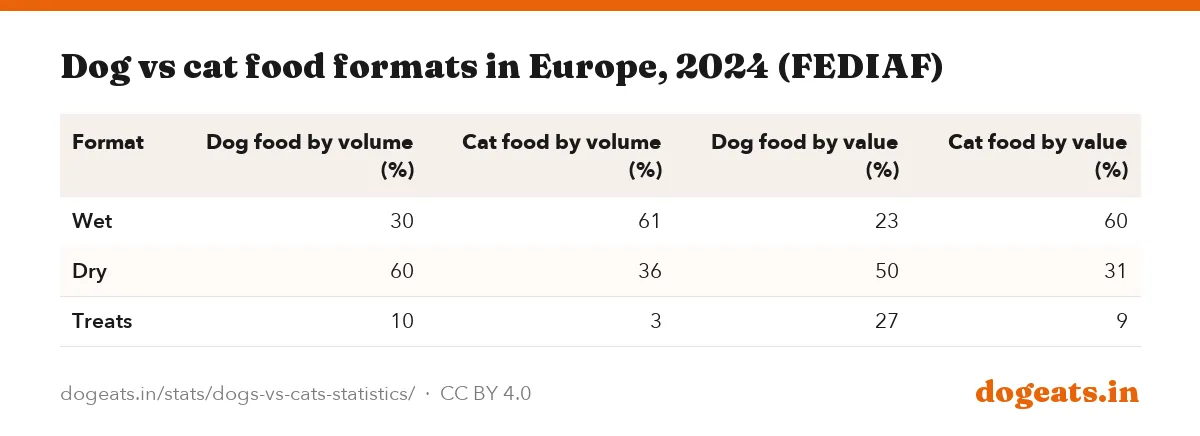
Cat food leans on wet food, 61% of cat food volume against 30% for dogs. In Australia, dog-owning households spent about AUD 2,520 a year on their dogs and cat owners about AUD 1,656 on their cats, across all costs.
Urban China shows the same pattern. The 2026 industry white paper put average yearly spending at 3,006 yuan per dog and 2,085 yuan per cat in 2025.
FEDIAF Facts and Figures 2026, 2024 data. Shares do not add to 100 because other pet food is excluded. FEDIAF bases the dog and cat split on 11 national markets that supplied 91% of the volume.
Show the numbers
| Label | % |
|---|---|
| Dog, volume | 58% |
| Cat, volume | 41% |
| Dog, value | 46% |
| Cat, value | 50% |
Embed this chart
| Format | Dog food by volume (%) | Cat food by volume (%) | Dog food by value (%) | Cat food by value (%) |
|---|---|---|---|---|
| Wet | 30 | 61 | 23 | 60 |
| Dry | 60 | 36 | 50 | 31 |
| Treats | 10 | 3 | 27 | 9 |
India has no published split between dog food and cat food sales from an official source. For dog food prices, see our dog food price per kg data.
Do more homes have a dog or a cat?
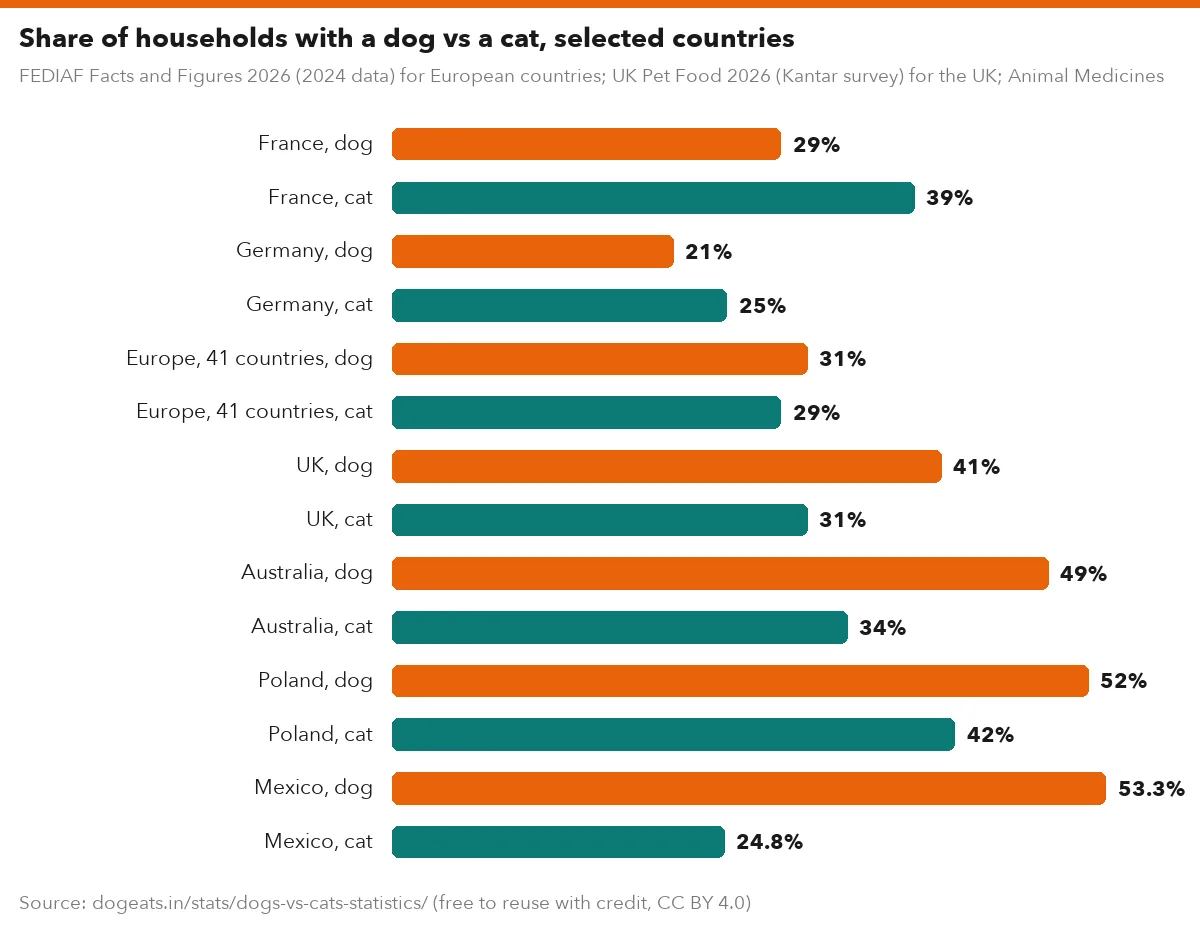
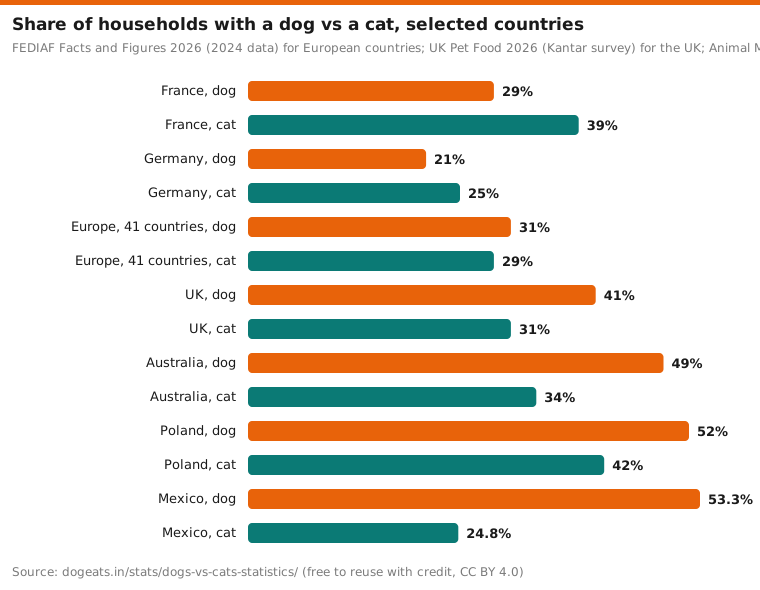
Across Europe as a whole, 31% of households had a dog and 29% a cat in 2024. Country by country the split is close: more homes keep a cat in 22 of 41 countries and a dog in 19.
The UK's 2026 survey found 41% of households with a dog and 31% with a cat. In Australia's 2025 survey, 49% of households had a dog and 34% a cat. France and Germany are among the 22 countries where more homes keep a cat. In Mexico, 53.3% of homes had a dog and 24.8% a cat in 2025.

FEDIAF Facts and Figures 2026 (2024 data) for European countries; UK Pet Food 2026 (Kantar survey) for the UK; Animal Medicines Australia 2025. Mexico: INEGI ENBIARE 2025, as reported by Por Esto.
Show the numbers
| Label | % of households |
|---|---|
| France, dog | 29% |
| France, cat | 39% |
| Germany, dog | 21% |
| Germany, cat | 25% |
| Europe, 41 countries, dog | 31% |
| Europe, 41 countries, cat | 29% |
| UK, dog | 41% |
| UK, cat | 31% |
| Australia, dog | 49% |
| Australia, cat | 34% |
| Poland, dog | 52% |
| Poland, cat | 42% |
| Mexico, dog | 53.3% |
| Mexico, cat | 24.8% |
Embed this chart
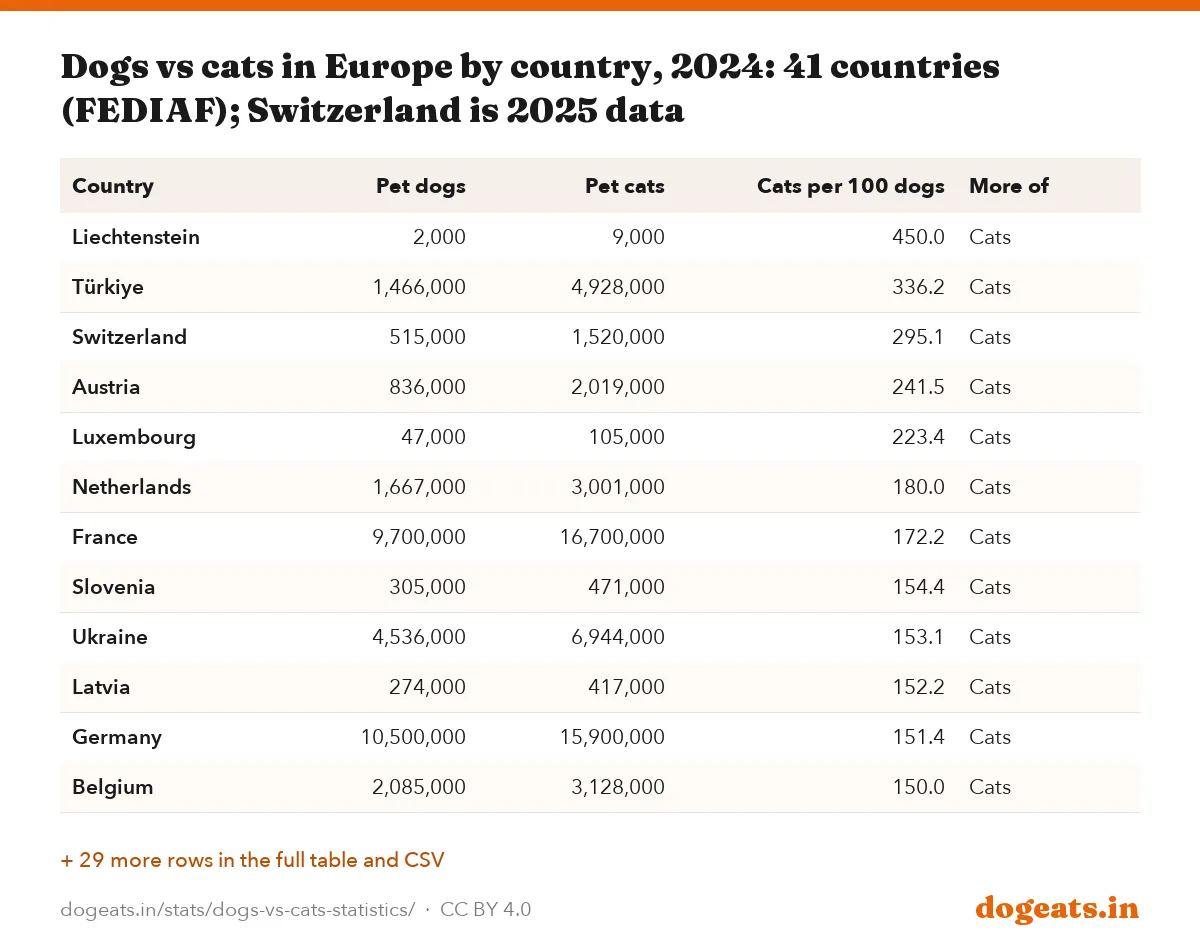
| Country | Pet dogs | Pet cats | Cats per 100 dogs | More of |
|---|---|---|---|---|
| Liechtenstein | 2,000 | 9,000 | 450.0 | Cats |
| Türkiye | 1,466,000 | 4,928,000 | 336.2 | Cats |
| Switzerland | 515,000 | 1,520,000 | 295.1 | Cats |
| Austria | 836,000 | 2,019,000 | 241.5 | Cats |
| Luxembourg | 47,000 | 105,000 | 223.4 | Cats |
| Netherlands | 1,667,000 | 3,001,000 | 180.0 | Cats |
| France | 9,700,000 | 16,700,000 | 172.2 | Cats |
| Slovenia | 305,000 | 471,000 | 154.4 | Cats |
| Ukraine | 4,536,000 | 6,944,000 | 153.1 | Cats |
| Latvia | 274,000 | 417,000 | 152.2 | Cats |
| Germany | 10,500,000 | 15,900,000 | 151.4 | Cats |
| Belgium | 2,085,000 | 3,128,000 | 150.0 | Cats |
| Sweden | 1,155,000 | 1,723,000 | 149.2 | Cats |
| Iceland | 28,000 | 40,000 | 142.9 | Cats |
| Norway | 553,000 | 787,000 | 142.3 | Cats |
| Italy | 9,000,000 | 11,900,000 | 132.2 | Cats |
| Finland | 798,000 | 1,003,000 | 125.7 | Cats |
| Estonia | 254,000 | 313,000 | 123.2 | Cats |
| Kosovo | 48,000 | 53,000 | 110.4 | Cats |
| Albania | 90,000 | 98,000 | 108.9 | Cats |
| Rep. of Moldova | 170,000 | 185,000 | 108.8 | Cats |
| Bulgaria | 729,000 | 793,000 | 108.8 | Cats |
| Serbia | 513,000 | 558,000 | 108.8 | Cats |
| Denmark | 618,000 | 670,000 | 108.4 | Cats |
| North Macedonia | 98,000 | 106,000 | 108.2 | Cats |
| Bosnia & Herzegovina | 184,000 | 199,000 | 108.2 | Cats |
| Montenegro | 42,000 | 45,000 | 107.1 | Cats |
| Romania | 4,258,000 | 4,439,000 | 104.3 | Cats |
| Greece | 649,000 | 601,000 | 92.6 | Dogs |
| United Kingdom | 13,400,000 | 12,300,000 | 91.8 | Dogs |
| Poland | 8,282,000 | 7,463,000 | 90.1 | Dogs |
| Hungary | 2,773,000 | 2,357,000 | 85.0 | Dogs |
| Ireland | 563,000 | 404,000 | 71.8 | Dogs |
| Spain | 6,962,000 | 4,939,000 | 70.9 | Dogs |
| Portugal | 3,071,000 | 2,116,000 | 68.9 | Dogs |
| Czechia | 2,229,000 | 1,395,000 | 62.6 | Dogs |
| Croatia | 778,000 | 456,000 | 58.6 | Dogs |
| Lithuania | 312,000 | 163,000 | 52.2 | Dogs |
| Slovakia | 1,436,000 | 535,000 | 37.3 | Dogs |
| Cyprus | 179,000 | 55,000 | 30.7 | Dogs |
| Malta | 100,000 | 23,000 | 23.0 | Dogs |
Tiny Liechtenstein has the highest ratio, 450 cats per 100 dogs, but among countries with over a million pet dogs Türkiye leads at 336. Among countries with at least 2 million dogs, Czechia, Portugal and Spain lean most towards dogs, at 63, 69 and 71 cats per 100 dogs. FEDIAF puts dog ownership in Spain at 70% of households, the highest in Europe.
Do cats live longer than dogs?
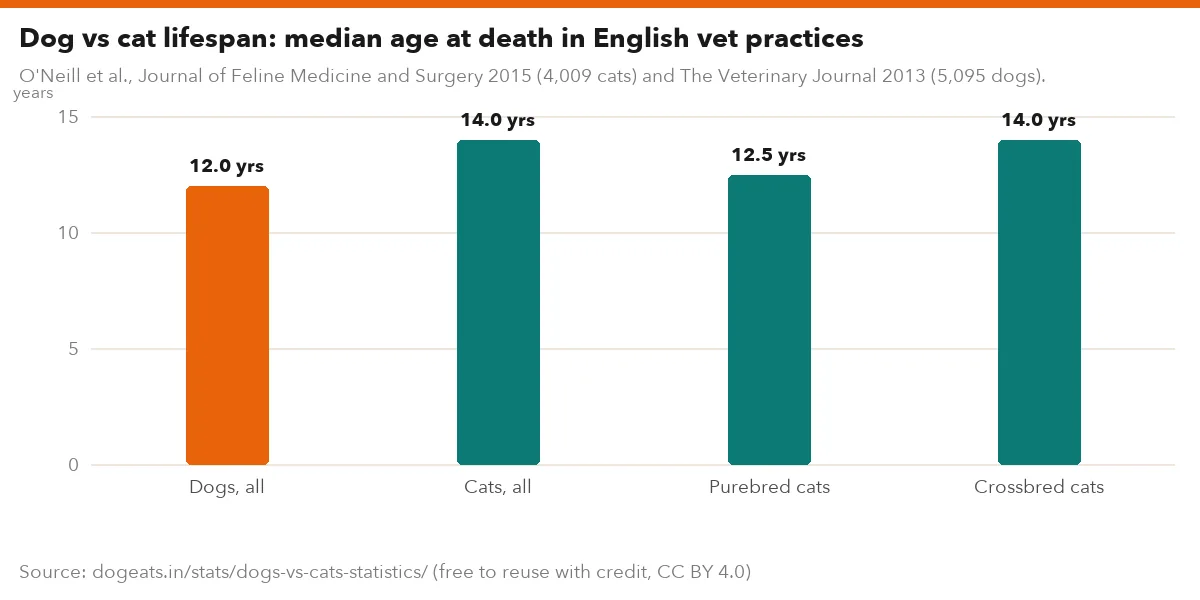
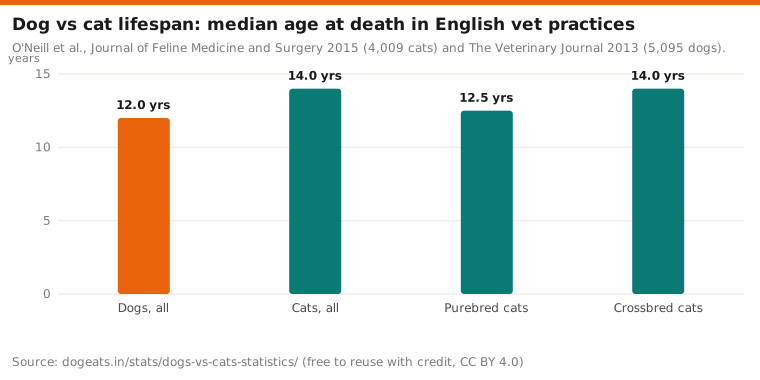
Yes, by about two years on the best data. A VetCompass study of 4,009 cat deaths at English vet practices found a median lifespan of 14.0 years. A matching study of 5,095 dog deaths found 12.0 years.
Mixed breeds lived longer in both species. Crossbred cats reached a median 14.0 years against 12.5 for purebred cats. Crossbred dogs outlived purebred dogs by 1.2 years.
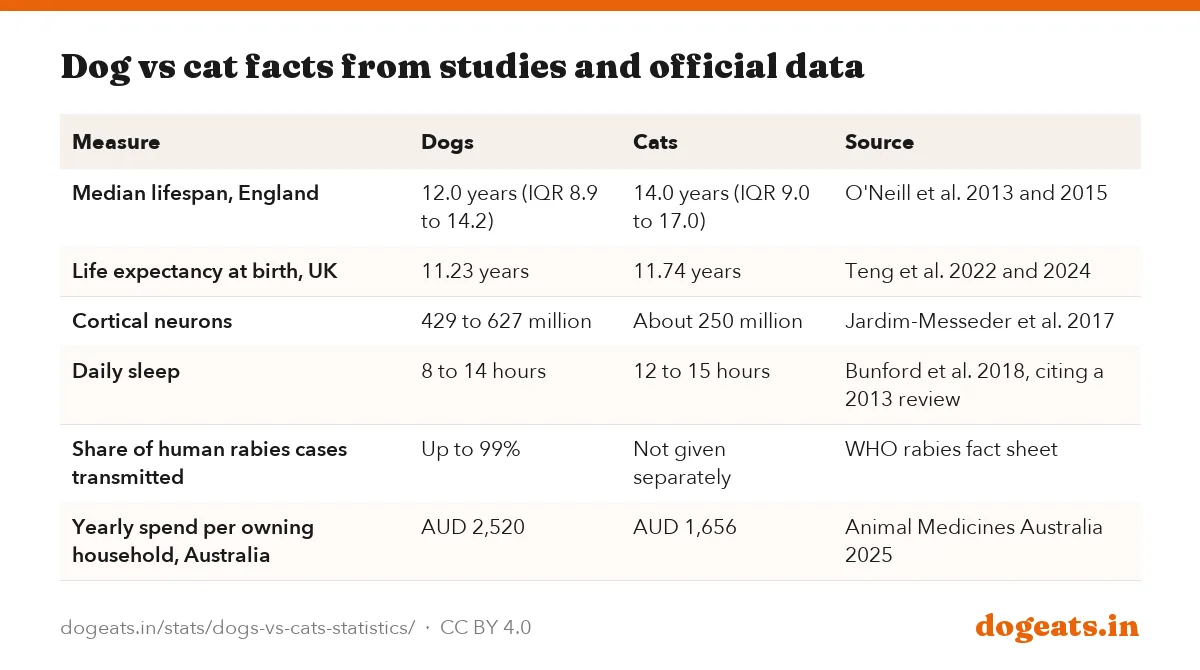
Newer VetCompass life tables narrow the gap. They put life expectancy at birth at 11.74 years for UK cats (7,936 deaths in 2019) and 11.23 years for UK dogs (30,563 deaths, 2016 to 2020).
O'Neill et al., Journal of Feline Medicine and Surgery 2015 (4,009 cats) and The Veterinary Journal 2013 (5,095 dogs).
Show the numbers
| Label | years |
|---|---|
| Dogs, all | 12.0 yrs |
| Cats, all | 14.0 yrs |
| Purebred cats | 12.5 yrs |
| Crossbred cats | 14.0 yrs |
Embed this chart
| Measure | Dogs | Cats | Source |
|---|---|---|---|
| Median lifespan, England | 12.0 years (IQR 8.9 to 14.2) | 14.0 years (IQR 9.0 to 17.0) | O'Neill et al. 2013 and 2015 |
| Life expectancy at birth, UK | 11.23 years | 11.74 years | Teng et al. 2022 and 2024 |
| Cortical neurons | 429 to 627 million | About 250 million | Jardim-Messeder et al. 2017 |
| Daily sleep | 8 to 14 hours | 12 to 15 hours | Bunford et al. 2018, citing a 2013 review |
| Share of human rabies cases transmitted | Up to 99% | Not given separately | WHO rabies fact sheet |
| Yearly spend per owning household, Australia | AUD 2,520 | AUD 1,656 | Animal Medicines Australia 2025 |
For dog lifespans by breed in India, see our dog breed lifespan report. For sleep, see how many hours dogs sleep.
Why do dog vs cat numbers disagree so much?
Few countries count pets officially. Most figures come from industry bodies or owner surveys, and they measure different things. Keep these points in mind when comparing.
- Official counts are rare. Of the countries in this report, only Spain's register and Mexico's INEGI survey come from government bodies.
- Industry figures dominate. FEDIAF, UK Pet Food, Animal Medicines Australia and China's white paper are funded by pet businesses.
- Years differ. FEDIAF's 2026 report uses 2024 data, while UK Pet Food's 2026 survey reflects 2026.
- Street animals are mostly left out. Pet surveys skip community dogs and cats, which matter a great deal in India.
- Trade codes merge species. HS 230910 covers dog and cat food together, so imports cannot show which pet is eating more.
- India's cat estimate has no named source. Treat the 4 million figure as a rough indication only.
India would need a pet census, or a cat line in the Livestock Census, to settle the question. Until then, any claim about Indian cat numbers is an estimate.
Frequently asked questions
Are cats or dogs more popular in India?
Dogs, on every estimate. Industry figures put India at 36.8 million pet dogs and nearly 4 million pet cats in 2024. India has no official count of cats.
Are there more cats or dogs in the world?
No global count exists. Cats outnumber dogs in Europe (110.9 million against 91.2 million) and urban China, while dogs lead in the US and Mexico.
Are cats or dogs more popular in the US?
Dogs. The AVMA counted 87.3 million dogs and 76.3 million cats in 2025.
Which is smarter, a dog or a cat?
Dogs have more brain cells. A golden retriever had 627 million cortical neurons against about 250 million in a cat, 2.5 times as many. Neuron counts are not an IQ score.
Does India count cats in the Livestock Census?
No. The 20th Livestock Census of 2019 counted 15 species, including dogs, rabbits and elephants, but not cats.
Do cats live longer than dogs?
Usually. English vet records show a median lifespan of 14.0 years for cats and 12.0 years for dogs.
How much pet food does India import?
India imported USD 138.1 million of dog or cat food for retail sale in 2025, under HS 230910. The code covers both species together.
Do dogs or cats bite more people in India?
Dogs. In a 2003 national survey, dogs caused 91.5% of animal bites and cats 4.7%.
Which country has the most cats compared with dogs?
In FEDIAF's 2024 data, tiny Liechtenstein has 450 cats per 100 dogs. Among countries with over a million pet dogs, Türkiye leads with 336, then the Netherlands with 180 and France with 172.
Methodology and limitations
Cats per 100 dogs is a dogeats.in calculation: pet cats divided by pet dogs, times 100, from each source's published counts. European figures are FEDIAF's country tables for 2024, published in Facts and Figures 2026. Household shares come from the same report.
US figures come from the AVMA's 2025 Pet Ownership and Demographics Sourcebook. The AVMA stated the dog count in December 2025; PetfoodIndustry reported the cat count on 17 October 2025. Mexico's are INEGI ENBIARE 2025 figures as reported by adn40 on 16 July 2026. Urban China's come from the 2026 China Pet Industry White Paper as reported by Guangming Online.
Trade data is from UN Comtrade, with India as reporter, for HS code 230910: dog or cat food, put up for retail sale. We used all partners and calendar years 2015 to 2025, downloaded on 16 October 2026. Prices per kg divide trade value by net weight. Growth rates use exact values and are rounded once.
India's census position comes from the species list in the 20th Livestock Census key results. Neuron counts are from the text and Table 1 of Jardim-Messeder et al. (2017). Lifespans are from the O'Neill et al. and Teng et al. abstracts.
Sources
- FEDIAF, Facts and Figures 2026 (2024 data), Dogs and cats in 41 European countries, household shares, food splits
- Jardim-Messeder et al., Dogs Have the Most Neurons, Though Not the Largest Brain, Frontiers in Neuroanatomy 2017, Cortical neuron counts for dogs, cats and other carnivores
- UN Comtrade, India imports and exports of HS 230910, 2015 to 2025, Dog or cat food trade values and weights
- Also consulted: DAHD, 20th Livestock Census 2019, Key Results (PIB copy), DAHD, district-wise stray dogs, 20th Livestock Census 2019, AVMA, Chart of the month: pet population trends, 17 December 2025 (2025 Sourcebook), PetfoodIndustry, 17 October 2025, on the AVMA 2025 Sourcebook, Government of Spain, Ministry of Social Rights, Consumption and Agenda 2030, June 2026, adn40, 16 July 2026, on INEGI ENBIARE 2025, Guangming Online, 5 January 2026, on the 2026 China Pet Industry White Paper, UK Pet Food, UK Pet Population 2026, Animal Medicines Australia, Pets in Australia 2025 release, GlobalPETS, The pet industry in India, 7 April 2025, O'Neill et al., Longevity and mortality of cats attending primary care veterinary practices in England, J Feline Med Surg 2015, O'Neill et al., Longevity and mortality of owned dogs in England, The Veterinary Journal 2013, Sudarshan et al., WHO-sponsored national multi-centric rabies survey, J Commun Dis 2006, WHO, Rabies fact sheet, The Hitavada, 28 June 2026, Por Esto, 22 July 2026, on INEGI ENBIARE 2025, Teng et al., Life tables of annual life expectancy and mortality for companion dogs in the United Kingdom, Scientific Reports 2022, Teng et al., Life tables of annual life expectancy and risk factors for mortality in cats in the UK, J Feline Med Surg 2024, Redseer Strategy Consultants, From Kibble to Care (October 2024): 3.2 crore pets in FY24, no species split, Ministry of Commerce TradeStat, HS 23091000, via the dogeats.in pet food market report.
Cite, embed and download
This report, its data and its images are free to reuse under a Creative Commons Attribution 4.0 licence. Credit dogeats.in with a link to this page. Every chart has its own embed code, every table has a CSV and an image download, and the images below are ready for social posts, slides and articles.
Cite this report
Link to this report
Every chart and table as an image