Data report · Updated October 2026
How many street dogs does India have? State-by-state counts from the Livestock Census, and what city surveys found
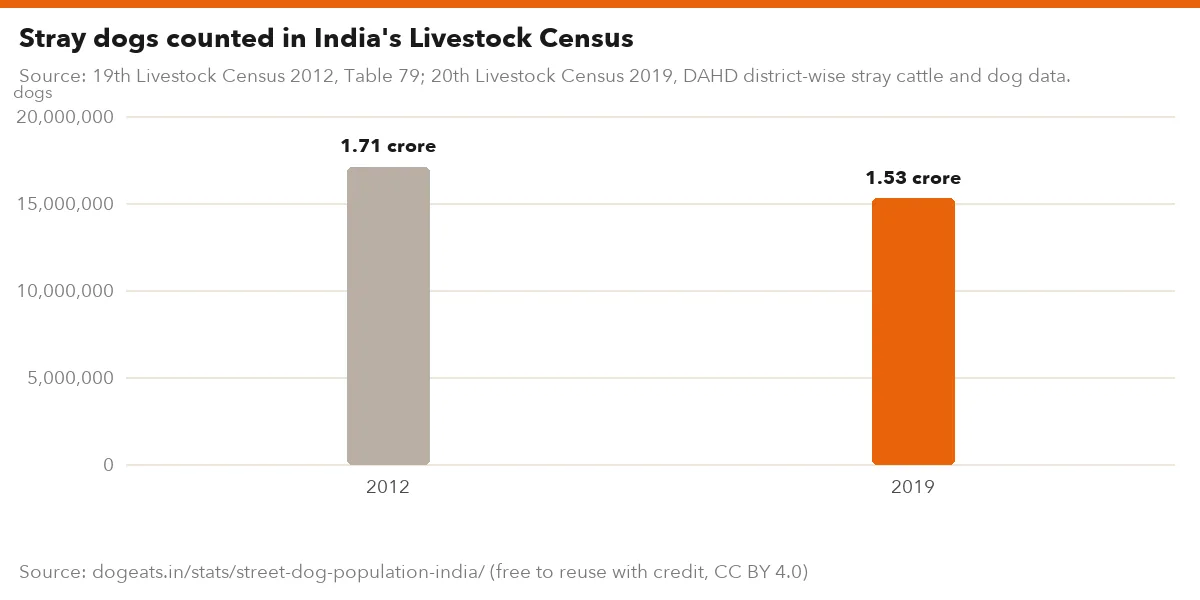
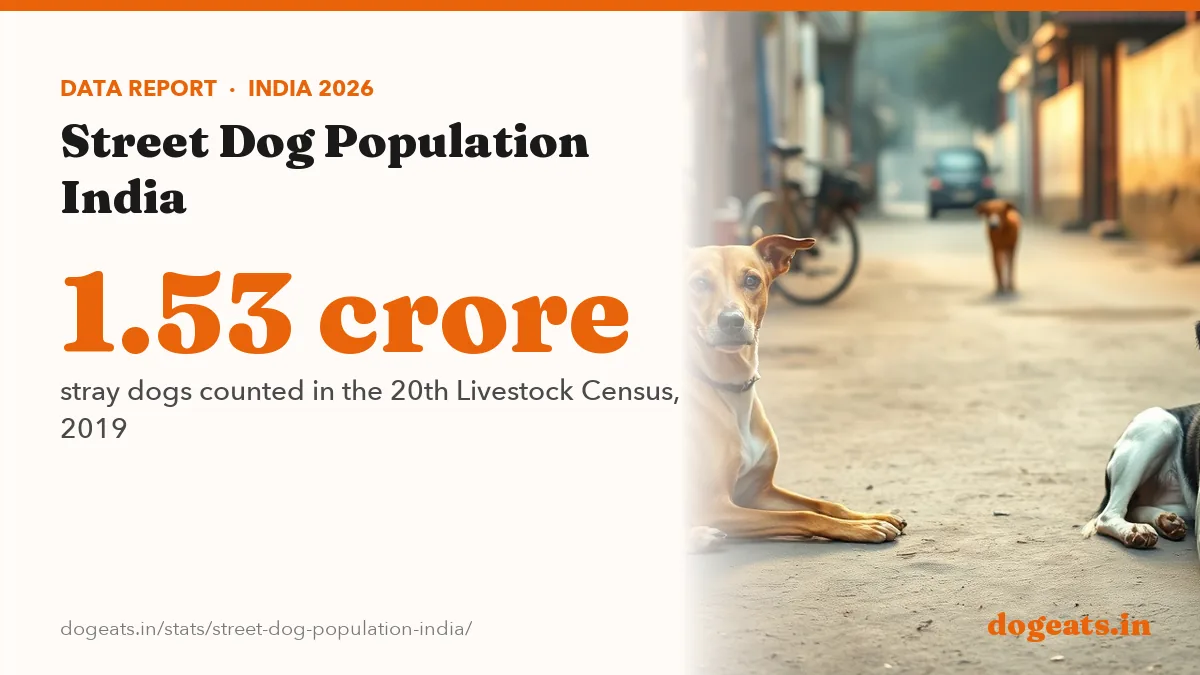
The 20th Livestock Census counted 1,53,04,345 stray dogs in India in 2019, down from 1,71,38,349 in 2012. The count works out to about 11.5 street dogs per 1,000 people. Uttar Pradesh has the most, but Odisha has the highest density, and city surveys suggest the census undercounts urban dogs.
Key findings
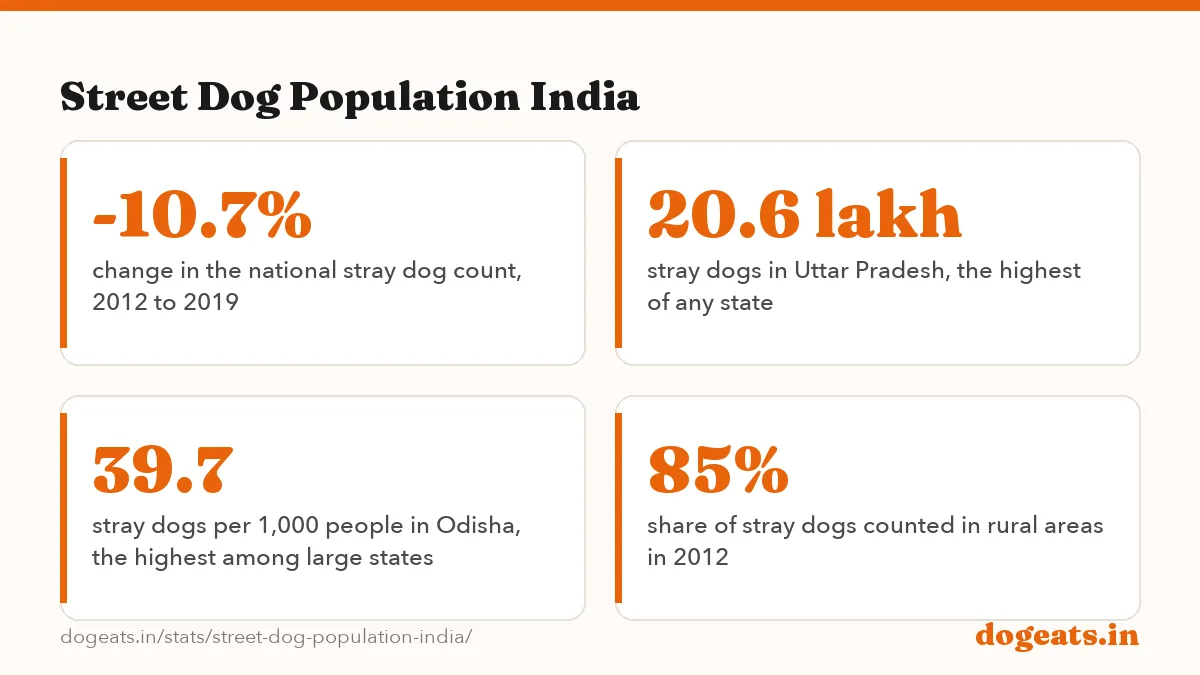
- The 20th Livestock Census counted 1,53,04,345 stray dogs in 2019, against 1,71,38,349 in the 19th census of 2012, a fall of 10.7%.
- Uttar Pradesh had the most stray dogs in 2019 at 20,59,261, but that was half its 2012 count of 41,79,245.
- Odisha's count doubled from 8,62,520 to 17,34,399, the largest increase of any state.
- India had about 11.5 street dogs per 1,000 people in 2019, down from about 14.0 in 2012, by our calculation.
- Among states with over one crore people, Odisha (39.7), Jammu & Kashmir with Ladakh (22.9) and Karnataka (17.3) had the most dogs per 1,000 people.
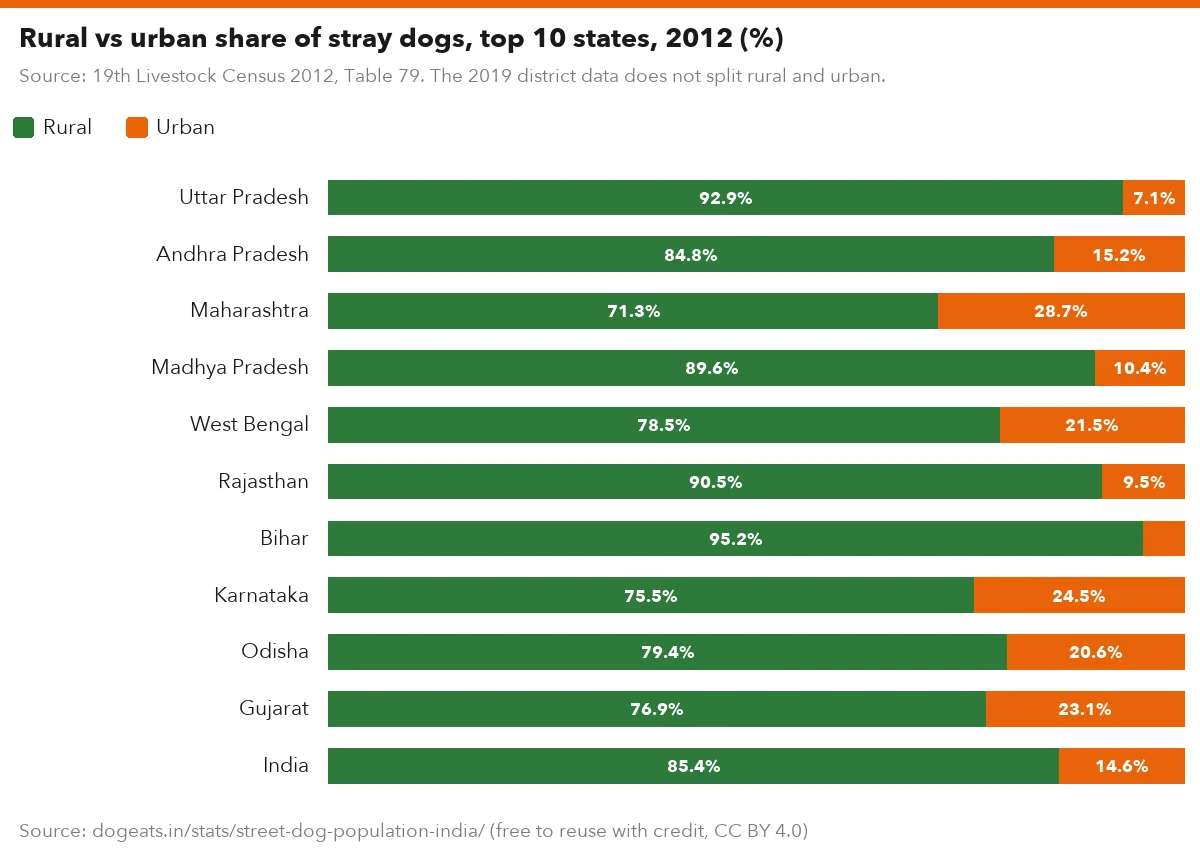
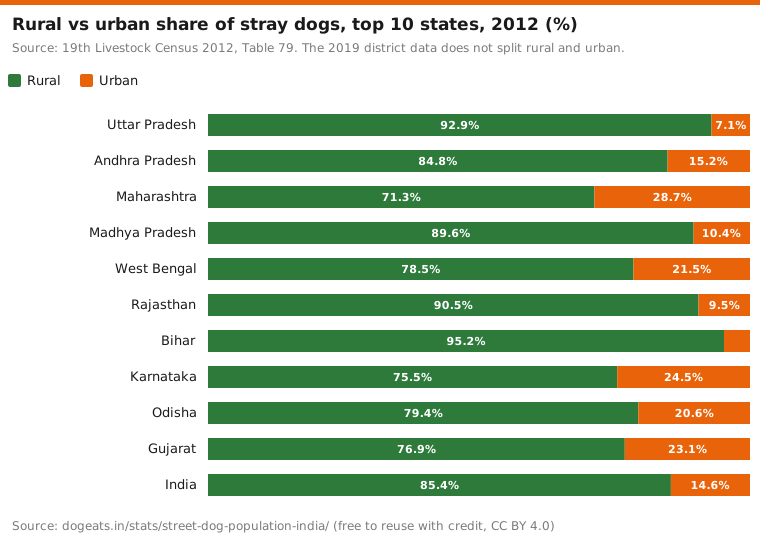
- In 2012, 85% of counted stray dogs were in rural areas, 1.46 crore against 25.1 lakh in towns and cities.
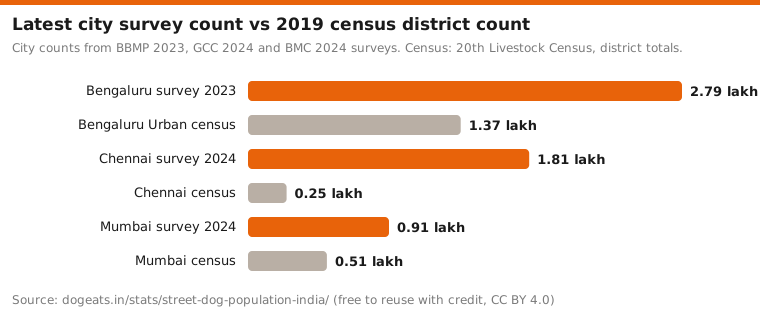
- City surveys count far more dogs than the census: BBMP's 2023 survey found 2,79,335 in Bengaluru, against 1,36,886 for Bengaluru Urban district in 2019.
- 21 states and UTs recorded more stray dogs in 2019 than in 2012, even as the national total fell.
How many street dogs are there in India?
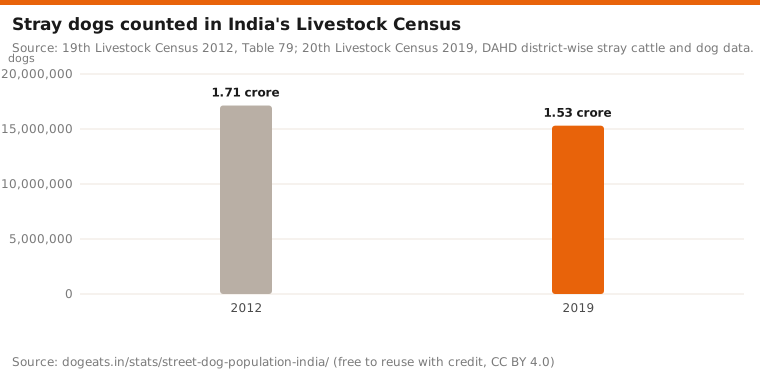
India had 1,53,04,345 stray dogs in 2019, according to the district-wise stray animal data from the 20th Livestock Census released by the Department of Animal Husbandry and Dairying. Rounded, the count is about 1.53 crore dogs.
The 19th Livestock Census in 2012 counted 1,71,38,349. It was the first census to count stray dogs at all. So the official count fell by 18.3 lakh, or 10.7%, in seven years.
Per person, the drop is larger. By our calculation, India had about 14.0 street dogs per 1,000 people in 2012 and about 11.5 in 2019.
Source: 19th Livestock Census 2012, Table 79; 20th Livestock Census 2019, DAHD district-wise stray cattle and dog data.
Show the numbers
| Label | dogs |
|---|---|
| 2012 | 1.71 crore |
| 2019 | 1.53 crore |
Embed this chart
The 21st Livestock Census, with enumeration from October 2024, also covers stray dogs. As of October 2026 we could not find published national results, so 2019 remains the latest official count.
Which state has the most street dogs?
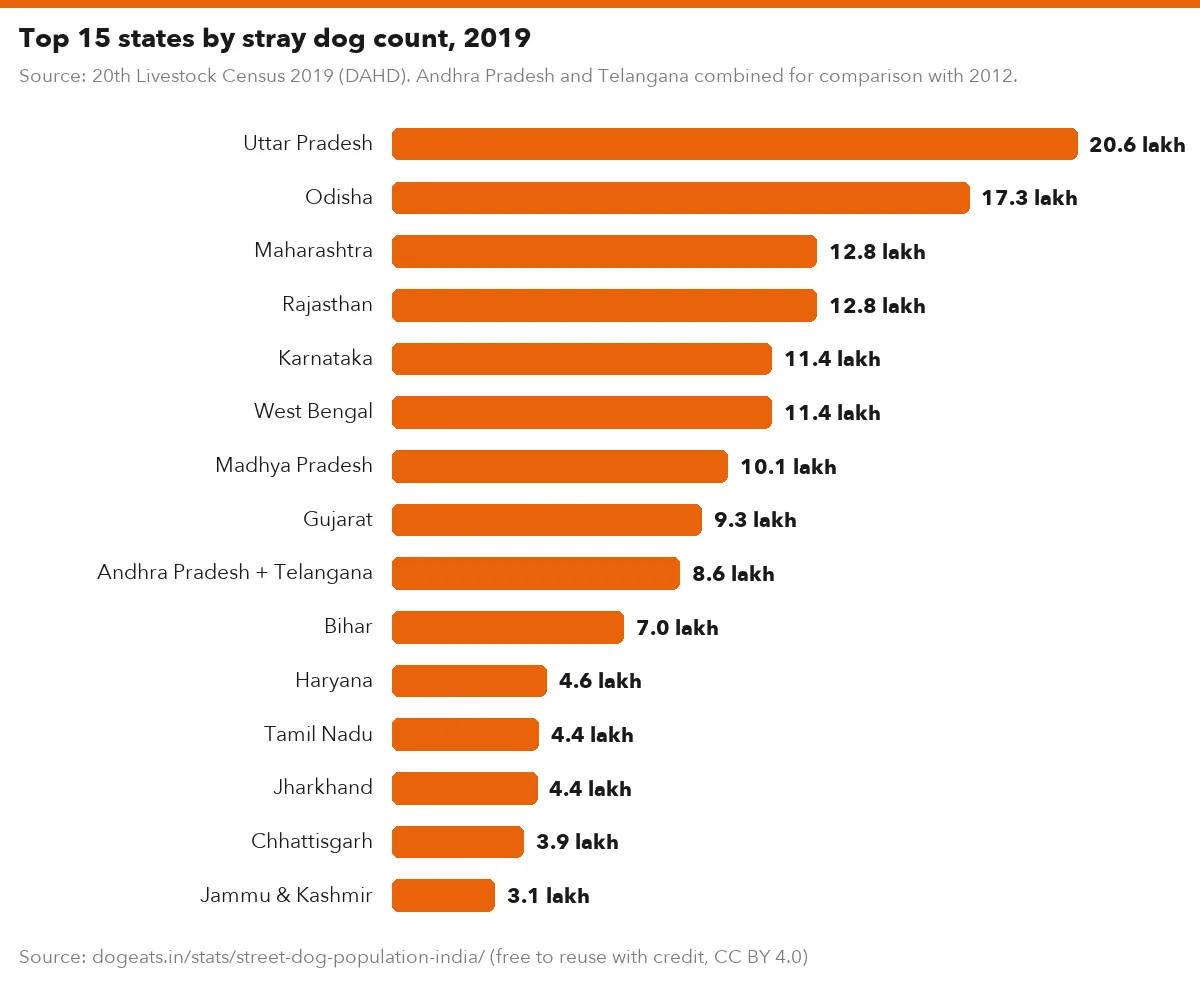
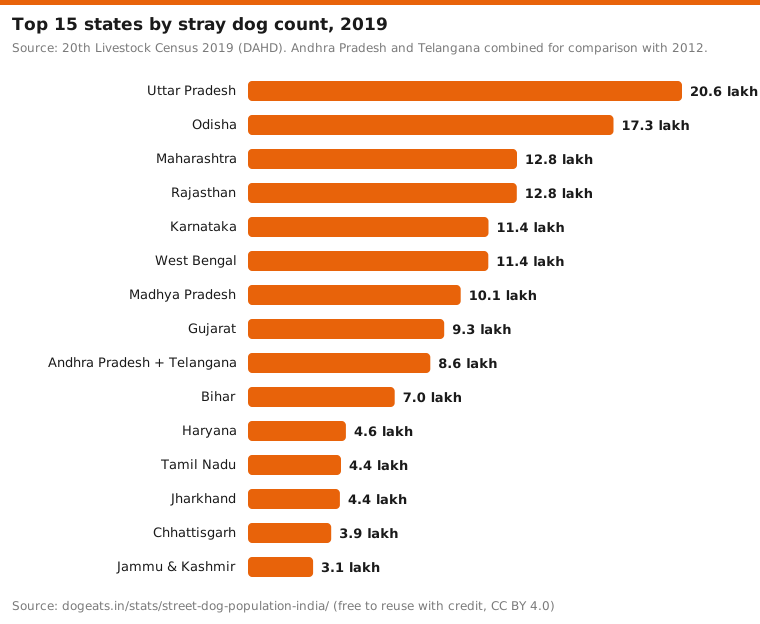
Uttar Pradesh had the most stray dogs in 2019, with 20,59,261. Odisha came second with 17,34,399, then Maharashtra (12,76,399) and Rajasthan (12,75,596).
Six states had more than 11 lakh street dogs each. Together they held 56% of India's count. The north-east had very few in the census: Mizoram recorded 69 and Manipur none.
Source: 20th Livestock Census 2019 (DAHD). Andhra Pradesh and Telangana combined for comparison with 2012.
Show the numbers
| Label | dogs |
|---|---|
| Uttar Pradesh | 20.6 lakh |
| Odisha | 17.3 lakh |
| Maharashtra | 12.8 lakh |
| Rajasthan | 12.8 lakh |
| Karnataka | 11.4 lakh |
| West Bengal | 11.4 lakh |
| Madhya Pradesh | 10.1 lakh |
| Gujarat | 9.3 lakh |
| Andhra Pradesh + Telangana | 8.6 lakh |
| Bihar | 7.0 lakh |
| Haryana | 4.6 lakh |
| Tamil Nadu | 4.4 lakh |
| Jharkhand | 4.4 lakh |
| Chhattisgarh | 3.9 lakh |
| Jammu & Kashmir | 3.1 lakh |
Embed this chart
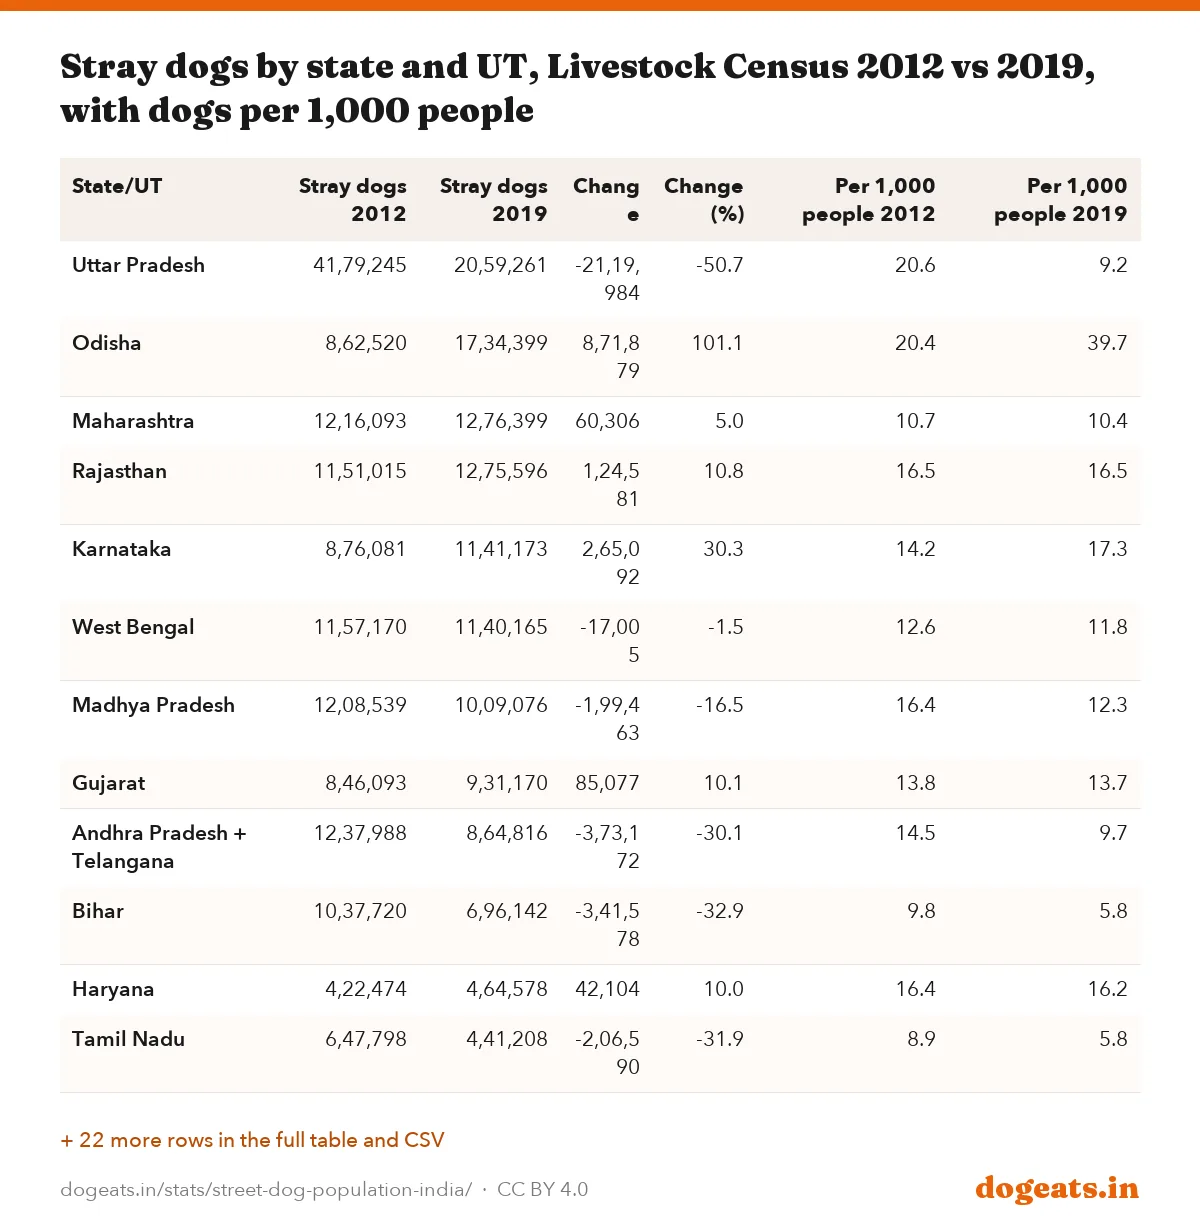
| State/UT | Stray dogs 2012 | Stray dogs 2019 | Change | Change (%) | Per 1,000 people 2012 | Per 1,000 people 2019 |
|---|---|---|---|---|---|---|
| Uttar Pradesh | 41,79,245 | 20,59,261 | -21,19,984 | -50.7 | 20.6 | 9.2 |
| Odisha | 8,62,520 | 17,34,399 | 8,71,879 | 101.1 | 20.4 | 39.7 |
| Maharashtra | 12,16,093 | 12,76,399 | 60,306 | 5.0 | 10.7 | 10.4 |
| Rajasthan | 11,51,015 | 12,75,596 | 1,24,581 | 10.8 | 16.5 | 16.5 |
| Karnataka | 8,76,081 | 11,41,173 | 2,65,092 | 30.3 | 14.2 | 17.3 |
| West Bengal | 11,57,170 | 11,40,165 | -17,005 | -1.5 | 12.6 | 11.8 |
| Madhya Pradesh | 12,08,539 | 10,09,076 | -1,99,463 | -16.5 | 16.4 | 12.3 |
| Gujarat | 8,46,093 | 9,31,170 | 85,077 | 10.1 | 13.8 | 13.7 |
| Andhra Pradesh + Telangana | 12,37,988 | 8,64,816 | -3,73,172 | -30.1 | 14.5 | 9.7 |
| Bihar | 10,37,720 | 6,96,142 | -3,41,578 | -32.9 | 9.8 | 5.8 |
| Haryana | 4,22,474 | 4,64,578 | 42,104 | 10.0 | 16.4 | 16.2 |
| Tamil Nadu | 6,47,798 | 4,41,208 | -2,06,590 | -31.9 | 8.9 | 5.8 |
| Jharkhand | 3,38,617 | 4,36,260 | 97,643 | 28.8 | 10.1 | 11.7 |
| Chhattisgarh | 3,43,622 | 3,94,686 | 51,064 | 14.9 | 13.2 | 13.7 |
| Jammu & Kashmir | 2,70,577 | 3,08,897 | 38,320 | 14.2 | 21.4 | 22.9 |
| Punjab | 3,05,482 | 2,90,624 | -14,858 | -4.9 | 10.9 | 9.7 |
| Kerala | 2,68,994 | 2,89,986 | 20,992 | 7.8 | 8.0 | 8.3 |
| Assam | 5,16,499 | 2,13,898 | -3,02,601 | -58.6 | 16.3 | 6.2 |
| Uttarakhand | 47,985 | 84,459 | 36,474 | 76.0 | 4.7 | 7.6 |
| Himachal Pradesh | 65,220 | 76,933 | 11,713 | 18.0 | 9.4 | 10.5 |
| Delhi | 60,472 | 55,462 | -5,010 | -8.3 | 3.5 | 2.8 |
| Goa | 16,325 | 27,864 | 11,539 | 70.7 | 11.1 | 18.1 |
| Puducherry | 17,676 | 19,687 | 2,011 | 11.4 | 13.8 | 13.1 |
| Tripura | 10,195 | 17,078 | 6,883 | 67.5 | 2.7 | 4.3 |
| Chandigarh | 7,928 | 12,922 | 4,994 | 63.0 | 7.4 | 11.0 |
| Arunachal Pradesh | 464 | 11,383 | 10,919 | 2353.2 | 0.3 | 7.6 |
| Sikkim | 8,703 | 10,695 | 1,992 | 22.9 | 14.1 | 16.1 |
| Meghalaya | 5,350 | 10,653 | 5,303 | 99.1 | 1.8 | 3.3 |
| Andaman & Nicobar | 8,167 | 5,300 | -2,867 | -35.1 | 21.3 | 13.4 |
| Daman & Diu | 1,134 | 3,164 | 2,030 | 179.0 | 4.4 | 7.7 |
| Nagaland | 7 | 342 | 335 | 4785.7 | 0.0 | 0.2 |
| Mizoram | 0 | 69 | 69 | n/a | 0.0 | 0.1 |
| Lakshadweep | 0 | 0 | 0 | n/a | 0.0 | 0.0 |
| Manipur | 23 | 0 | -23 | -100.0 | 0.0 | 0.0 |
Andhra Pradesh was one state in 2012, so we compare it with Andhra Pradesh plus Telangana in 2019. Jammu & Kashmir includes Ladakh in both years. Dadra and Nagar Haveli has no 2019 figure in the DAHD file and is left out.
Rises and falls between 2012 and 2019
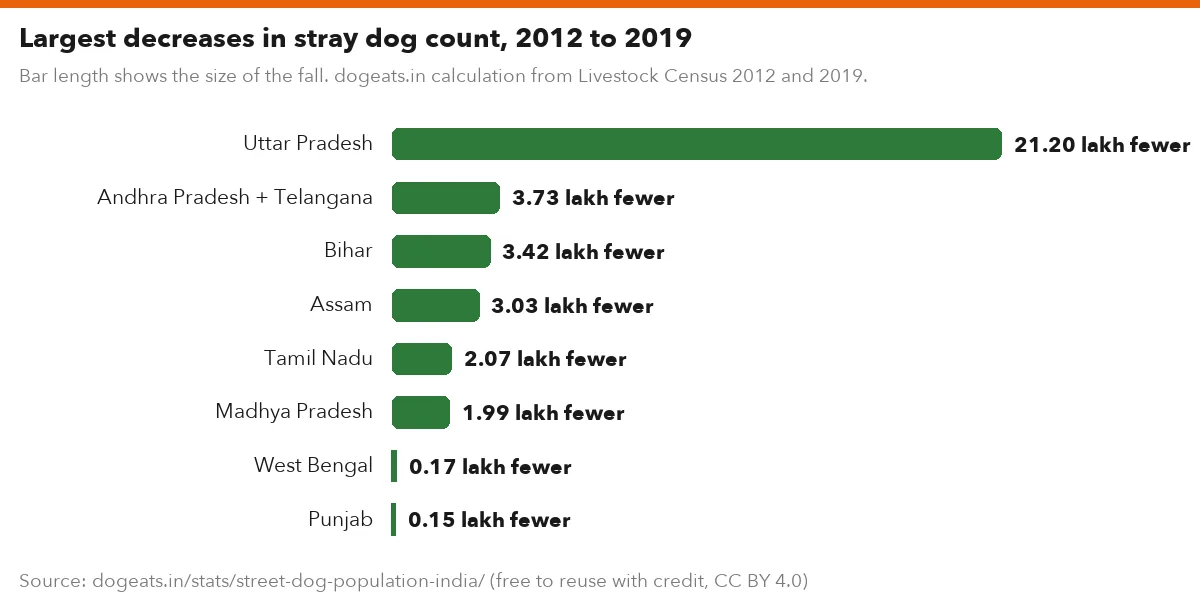
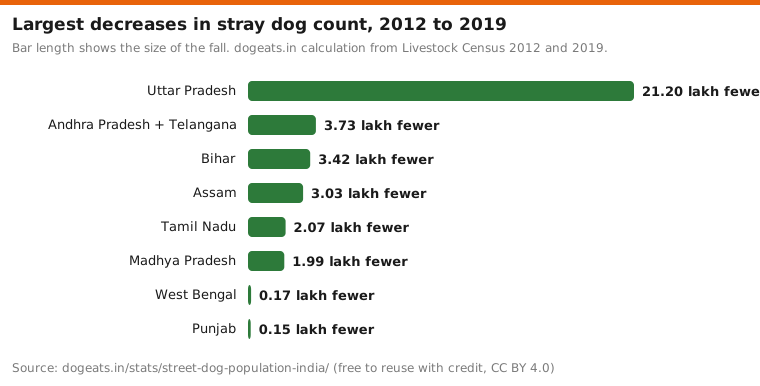
Uttar Pradesh drove most of the national fall. Its count dropped by 21.2 lakh, more than the 18.3 lakh fall for India as a whole. Andhra Pradesh with Telangana, Bihar and Assam also fell by over 3 lakh each.
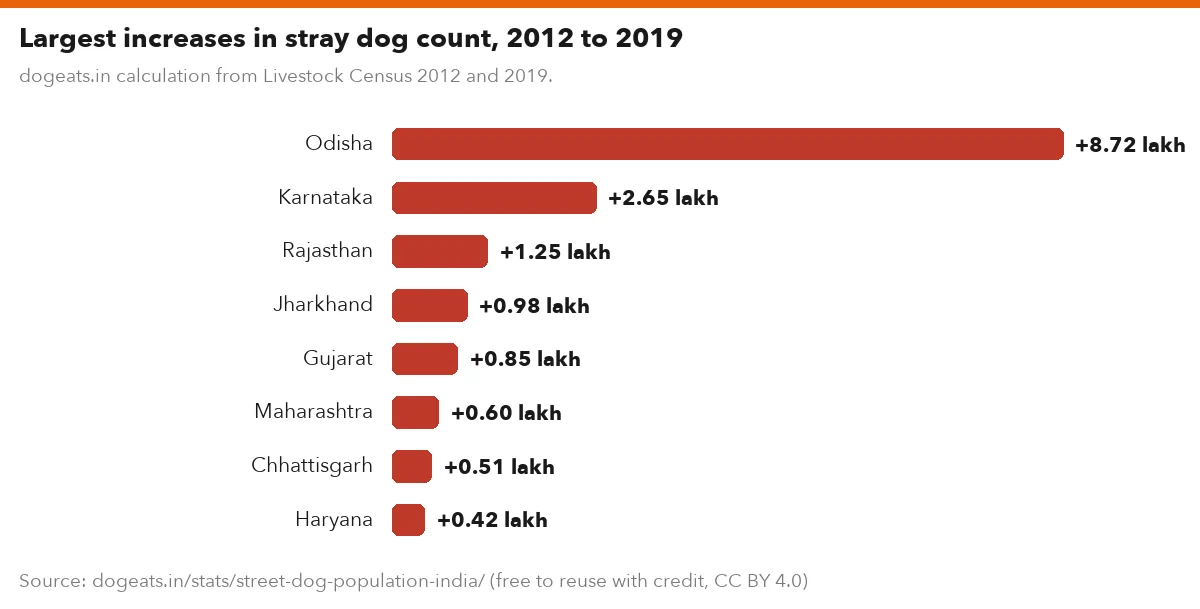
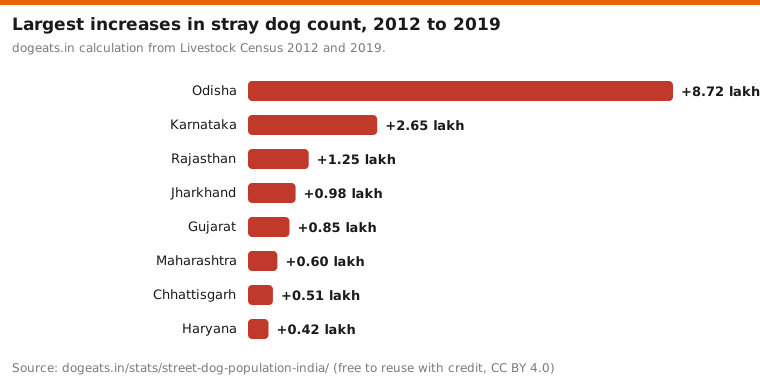
Odisha moved the other way, adding 8.7 lakh dogs. Karnataka added 2.7 lakh. In all, 21 states and UTs counted more stray dogs in 2019 than in 2012.
dogeats.in calculation from Livestock Census 2012 and 2019.
Show the numbers
| Label | dogs |
|---|---|
| Odisha | +8.72 lakh |
| Karnataka | +2.65 lakh |
| Rajasthan | +1.25 lakh |
| Jharkhand | +0.98 lakh |
| Gujarat | +0.85 lakh |
| Maharashtra | +0.60 lakh |
| Chhattisgarh | +0.51 lakh |
| Haryana | +0.42 lakh |
Embed this chart
Bar length shows the size of the fall. dogeats.in calculation from Livestock Census 2012 and 2019.
Show the numbers
| Label | dogs |
|---|---|
| Uttar Pradesh | 21.20 lakh fewer |
| Andhra Pradesh + Telangana | 3.73 lakh fewer |
| Bihar | 3.42 lakh fewer |
| Assam | 3.03 lakh fewer |
| Tamil Nadu | 2.07 lakh fewer |
| Madhya Pradesh | 1.99 lakh fewer |
| West Bengal | 0.17 lakh fewer |
| Punjab | 0.15 lakh fewer |
Embed this chart
Swings this large in seven years are hard to explain by births and deaths alone. The census asks one knowledgeable person per village or ward for an approximate number, so method changes can move state totals a lot.
Street dogs per person, by state
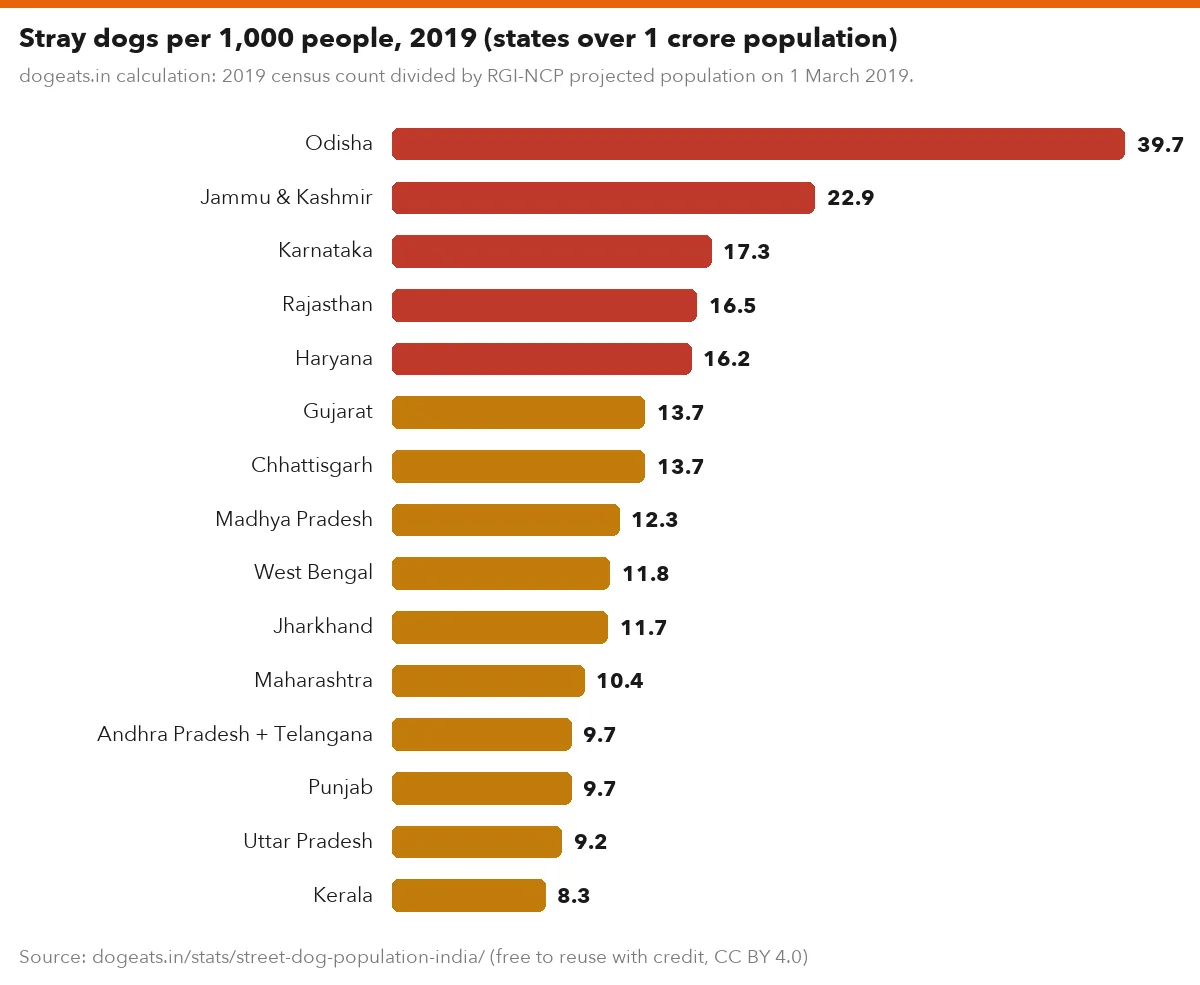
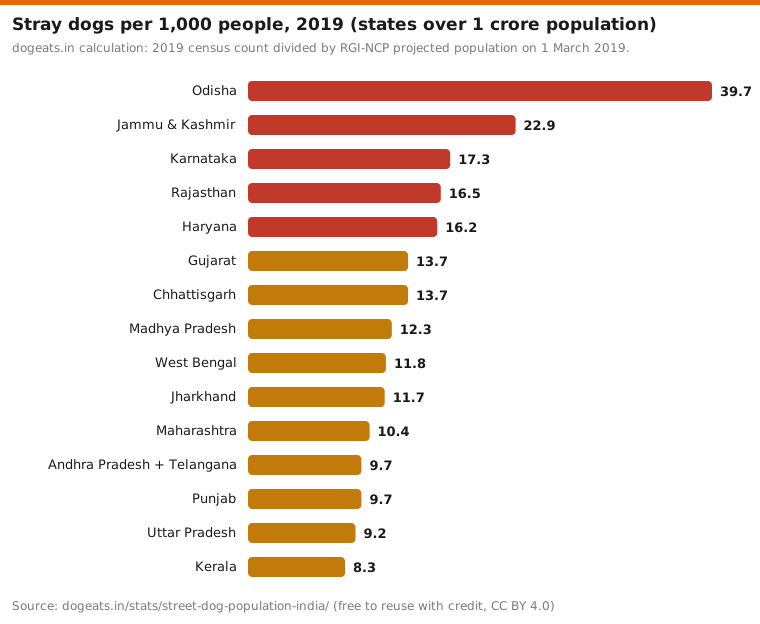
Odisha had about 39.7 stray dogs per 1,000 people in 2019, by far the highest among states with over one crore people. Jammu & Kashmir with Ladakh came next at 22.9, then Karnataka at 17.3.
Some of the states that report the most dog bites have modest dog densities. Tamil Nadu had 5.8 street dogs per 1,000 people in the census, yet the highest bite rate among large states in 2024.
dogeats.in calculation: 2019 census count divided by RGI-NCP projected population on 1 March 2019.
Show the numbers
| Label | per 1,000 |
|---|---|
| Odisha | 39.7 |
| Jammu & Kashmir | 22.9 |
| Karnataka | 17.3 |
| Rajasthan | 16.5 |
| Haryana | 16.2 |
| Gujarat | 13.7 |
| Chhattisgarh | 13.7 |
| Madhya Pradesh | 12.3 |
| West Bengal | 11.8 |
| Jharkhand | 11.7 |
| Maharashtra | 10.4 |
| Andhra Pradesh + Telangana | 9.7 |
| Punjab | 9.7 |
| Uttar Pradesh | 9.2 |
| Kerala | 8.3 |
Embed this chart
That mismatch between dog density and bite counts says more about reporting than about dogs. Our dog bite statistics report has the bite rate for every state.
Rural and urban dogs
Most of India's street dogs live in villages. The 2012 census, the last one with a published rural and urban split, counted 1,46,28,180 rural stray dogs and 25,10,169 urban ones. Rural areas held 85%.
Maharashtra and Delhi were the exceptions among big populations. Urban areas held 29% of Maharashtra's stray dogs and half of Delhi's.
Rural dogs matter for rabies. The ICMR burden study found a slightly higher dog bite rate in villages than in towns, 5.8 against 5.0 per 1,000 people, as reported by The South First.
City surveys in Delhi, Mumbai, Bengaluru and Chennai
City corporations run their own counts, usually with sight-resight surveys along mapped routes. These almost always find more dogs than the Livestock Census figure for the same district.
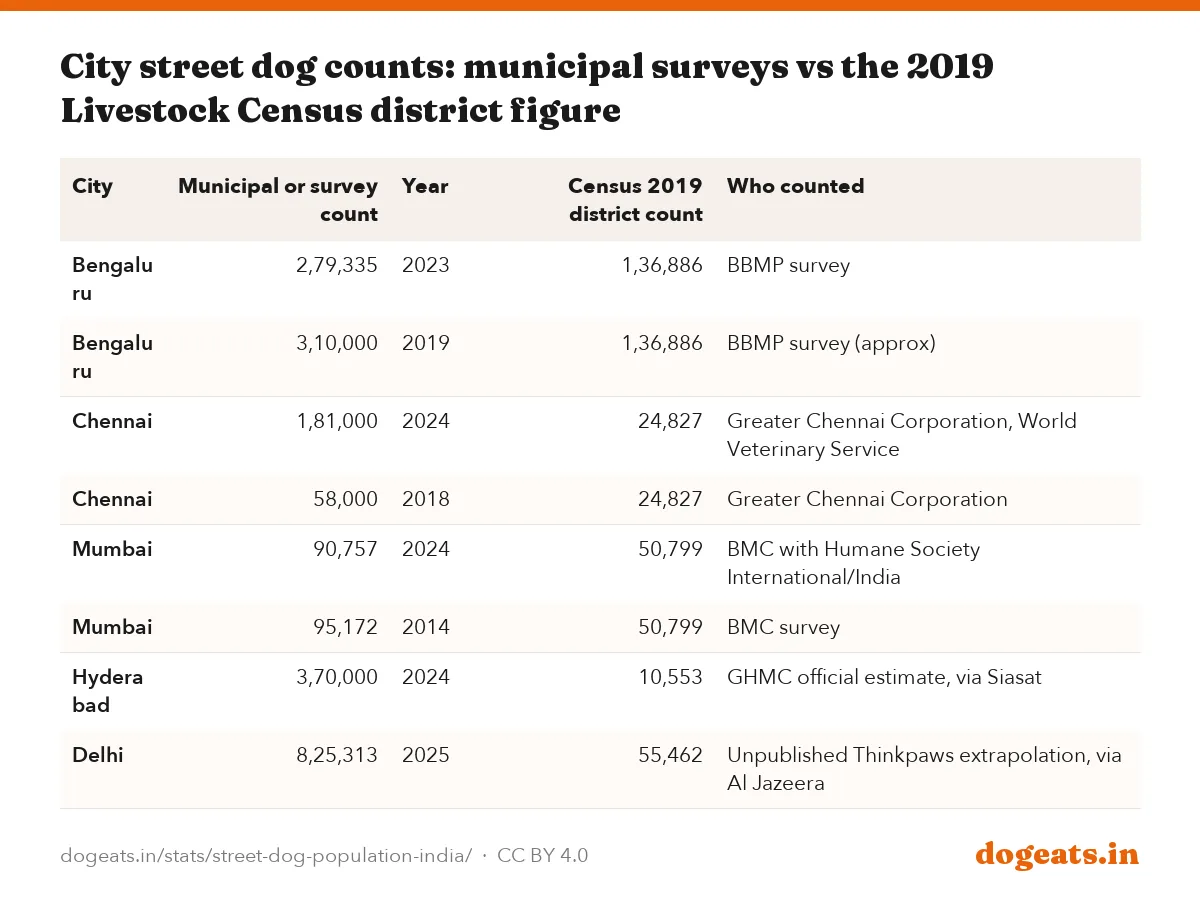
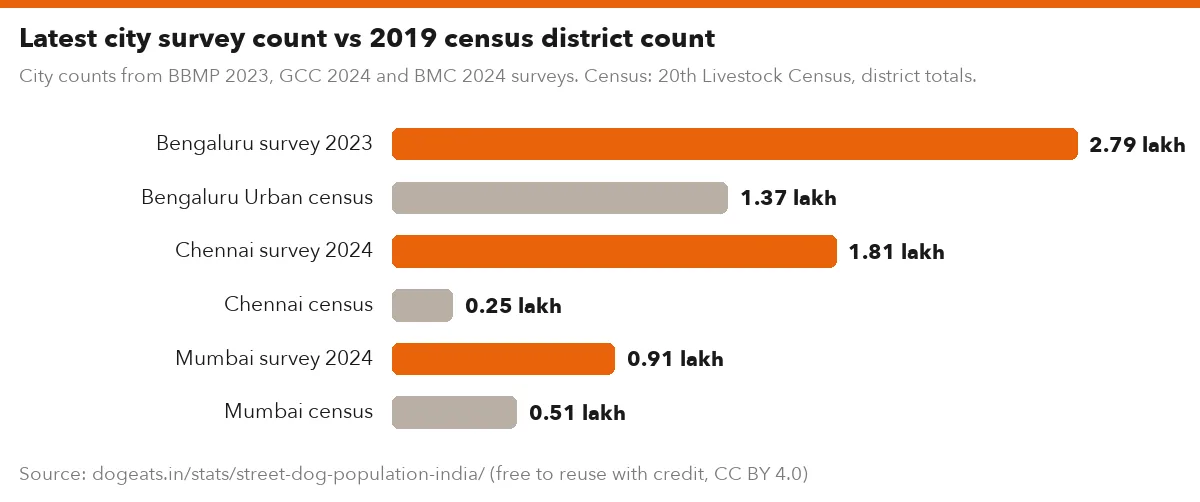
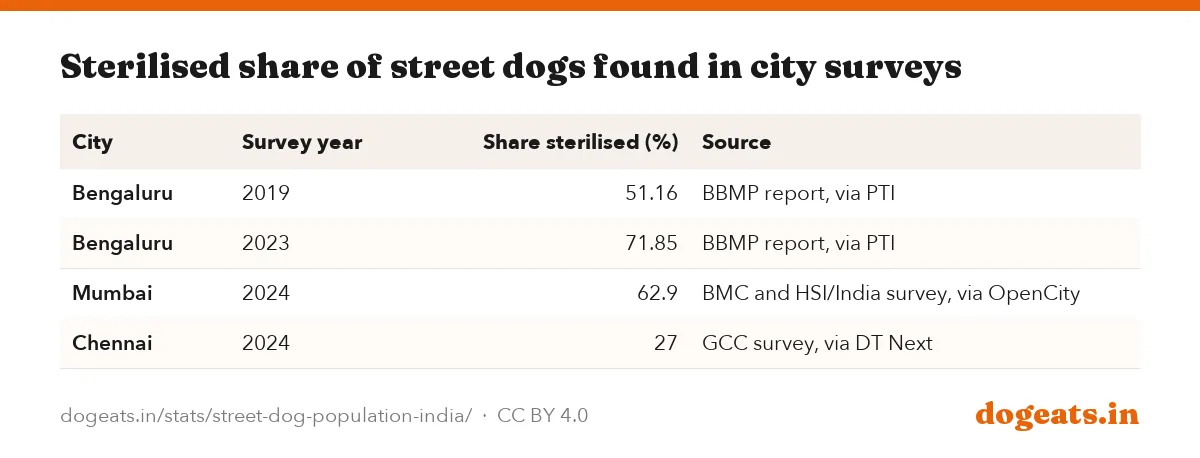
Bengaluru's BBMP counted 2,79,335 dogs in its 2023 survey, about 10% fewer than in 2019. The Lok Sabha was told in April 2025 that the neutered share rose by about 20 points over the same period. The 2019 census listed 1,36,886 for Bengaluru Urban district.
| City | Municipal or survey count | Year | Census 2019 district count | Who counted |
|---|---|---|---|---|
| Bengaluru | 2,79,335 | 2023 | 1,36,886 | BBMP survey |
| Bengaluru | 3,10,000 | 2019 | 1,36,886 | BBMP survey (approx) |
| Chennai | 1,81,000 | 2024 | 24,827 | Greater Chennai Corporation, World Veterinary Service |
| Chennai | 58,000 | 2018 | 24,827 | Greater Chennai Corporation |
| Mumbai | 90,757 | 2024 | 50,799 | BMC with Humane Society International/India |
| Mumbai | 95,172 | 2014 | 50,799 | BMC survey |
| Hyderabad | 3,70,000 | 2024 | 10,553 | GHMC official estimate, via Siasat |
| Delhi | 8,25,313 | 2025 | 55,462 | Unpublished Thinkpaws extrapolation, via Al Jazeera |
City counts from BBMP 2023, GCC 2024 and BMC 2024 surveys. Census: 20th Livestock Census, district totals.
Show the numbers
| Label | dogs |
|---|---|
| Bengaluru survey 2023 | 2.79 lakh |
| Bengaluru Urban census | 1.37 lakh |
| Chennai survey 2024 | 1.81 lakh |
| Chennai census | 0.25 lakh |
| Mumbai survey 2024 | 0.91 lakh |
| Mumbai census | 0.51 lakh |
Embed this chart
Mumbai's count fell 4.6% in ten years, from 95,172 in 2014 to 90,757 in 2024. The sterilised share was 62.9%, lower than 2014 in 18 of 24 wards, according to an OpenCity analysis. Chennai's count tripled from 2018, with only 27% sterilised.
Delhi has no full municipal census. The 2019 Livestock Census counted 55,462 stray dogs in Delhi. An unpublished density study cited by Al Jazeera extrapolated about 8.25 lakh, nearly 15 times higher.
Why counts differ so much
The Livestock Census was not designed to count street dogs precisely. The 2012 report says the number was collected from a single source in each village or ward, such as the sarpanch, patwari or a teacher.
Municipal surveys walk or ride fixed routes at dawn and count every dog seen, often more than once. Mumbai's 2024 survey covered 930 km of roads across 24 wards.
- Kerala's Animal Husbandry Department cites a 2019 to 2020 statewide animal census of about 7 lakh stray dogs. The DAHD district file shows 2,89,986 for Kerala.
- The department now estimates about 9 lakh street dogs in Kerala, as reported by Onmanorama in November 2025.
- GHMC officials put Hyderabad's street dog population at about 3.7 lakh in 2024, as reported by Siasat. The census found 10,553 in Hyderabad district.
For people who adopt a community dog, our Indian Pariah Dog guide covers care and diet. The indie dog feeding guide covers what to feed them.
Why the numbers matter for sterilisation and rabies
Every sterilisation target starts with a population number. The Centre's July 2025 advisory asked cities to sterilise at least 70% of stray dogs, and 70% of an unknown number is a guess.
The rabies plan has the same need. NAPRE wants at least 70% of dogs in an area vaccinated every year. Our ABC sterilisation coverage report compares city counts with sterilisation numbers.
Frequently asked questions
How many street dogs are there in India?
The 20th Livestock Census counted 1,53,04,345 stray dogs in India in 2019. That was 10.7% fewer than the 1,71,38,349 counted in 2012. The 21st census results were not yet published as of October 2026.
Which state has the most stray dogs in India?
Uttar Pradesh had the most in 2019, with 20,59,261 stray dogs. Odisha was second with 17,34,399. Maharashtra and Rajasthan had about 12.8 lakh each.
Which state has the most street dogs per person?
Odisha had about 39.7 stray dogs per 1,000 people in 2019, by our calculation using the census count and projected population. Odisha's rate is more than three times the national average of about 11.5.
How many stray dogs are in Delhi?
The 2019 Livestock Census counted 55,462 stray dogs in Delhi. Delhi has no full municipal census. An unpublished density study cited by Al Jazeera put the number near 8.25 lakh.
How many street dogs are in Bengaluru?
BBMP's 2023 survey counted 2,79,335 street dogs, about 10% fewer than in 2019. About 71.85% were neutered, up from 51.16% in 2019, according to the BBMP report as reported by PTI.
How many stray dogs are in Mumbai and Chennai?
BMC's 2024 survey estimated 90,757 street dogs in Mumbai, down from 95,172 in 2014. Chennai's 2024 survey counted about 1.81 lakh, up from about 58,000 in 2018.
Is India's street dog population increasing?
The official count fell 10.7% from 2012 to 2019, but 21 states and UTs recorded increases. City surveys show both rises and falls. No newer national count was published as of October 2026.
Why do different sources give different street dog numbers?
The Livestock Census asks one local informant per village or ward for an approximate count. City surveys count dogs seen along mapped routes. The methods differ, so numbers for the same place can differ several times over.
Methodology and limitations
State counts for 2012 come from Table 79 of the 19th Livestock Census report. State counts for 2019 are our totals of the district-wise stray dog file published by DAHD from the 20th Livestock Census. Both files are official DAHD publications.
Dogs per 1,000 people are dogeats.in calculations. We used projected population on 1 March 2012 and 1 March 2019 from the Report of the Technical Group on Population Projections 2011 to 2036 (National Commission on Population).
City counts come from municipal surveys as published or reported by named outlets. Where only a rounded number was reported, we show it as reported and label it approximate.
Sources
- DAHD, district-wise stray cattle and stray dogs, 20th Livestock Census 2019, 2019 stray dog counts by district and state
- DAHD, 19th Livestock Census 2012 All India Report, 2012 stray dogs by state, rural and urban; counting method
- Lok Sabha Unstarred Question 4870, DAHD, 1 April 2025, BBMP survey finding of a 10% fall and higher neutering
- Also consulted: DAHD, Animal Husbandry Statistics division, PTI via Deccan Herald, 4 October 2023, PTI via The South First, 7 October 2023, Citizen Matters, OpenCity, 3 February 2026, DT Next, September 2024, Al Jazeera, 30 August 2025, Siasat Daily, May 2024, Onmanorama, 9 November 2025, Report of the Technical Group on Population Projections 2011 to 2036, National Commission on Population (copy), Supreme Court of India, judgment of 19 May 2026, PIB, Lok Sabha reply on menace of stray dogs, 19 August 2025, Business Today and DD News coverage of the 21st Livestock Census, The South First report on the ICMR rabies burden study.
Cite, embed and download
This report, its data and its images are free to reuse under a Creative Commons Attribution 4.0 licence. Credit dogeats.in with a link to this page. Every chart has its own embed code, every table has a CSV and an image download, and the images below are ready for social posts, slides and articles.
Cite this report
Link to this report
Every chart and table as an image