Data report · Updated October 2026
Dog bite statistics in the United States: insurance claims, ER visits and deaths
US homeowners insurers paid $1.86 billion on 28,450 dog bite and dog injury claims in 2025, an average of $65,450 per claim, Triple-I and State Farm estimate. CDC-based data show about 350,000 emergency room visits for dog bites a year. Deaths are rare but rising, from 35 in 2018 to 81 in 2021.

Key findings
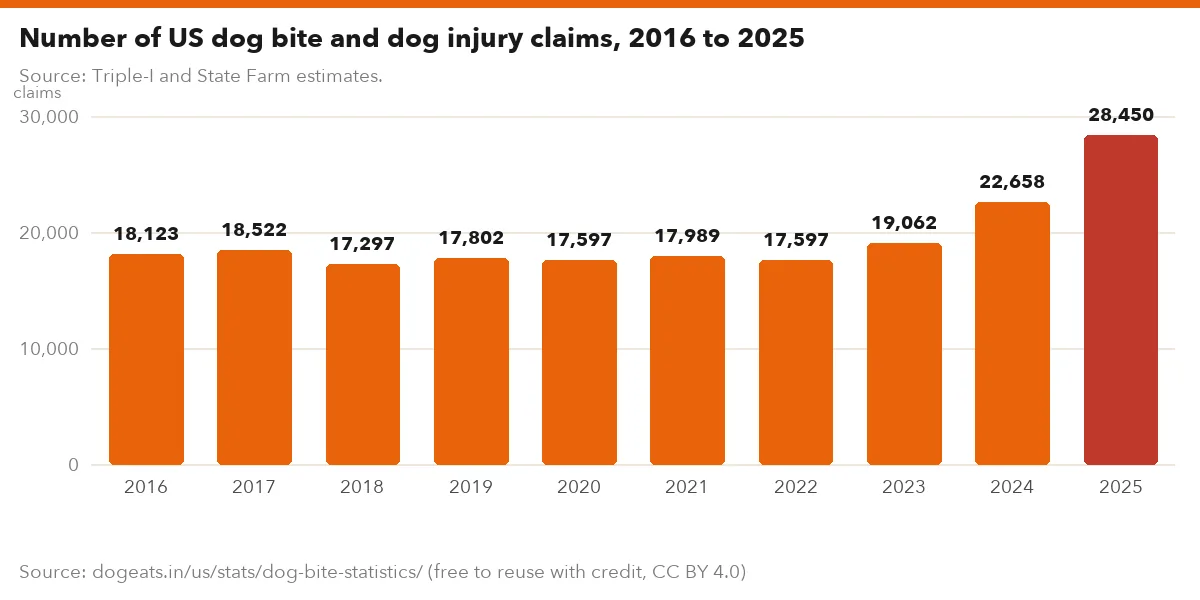
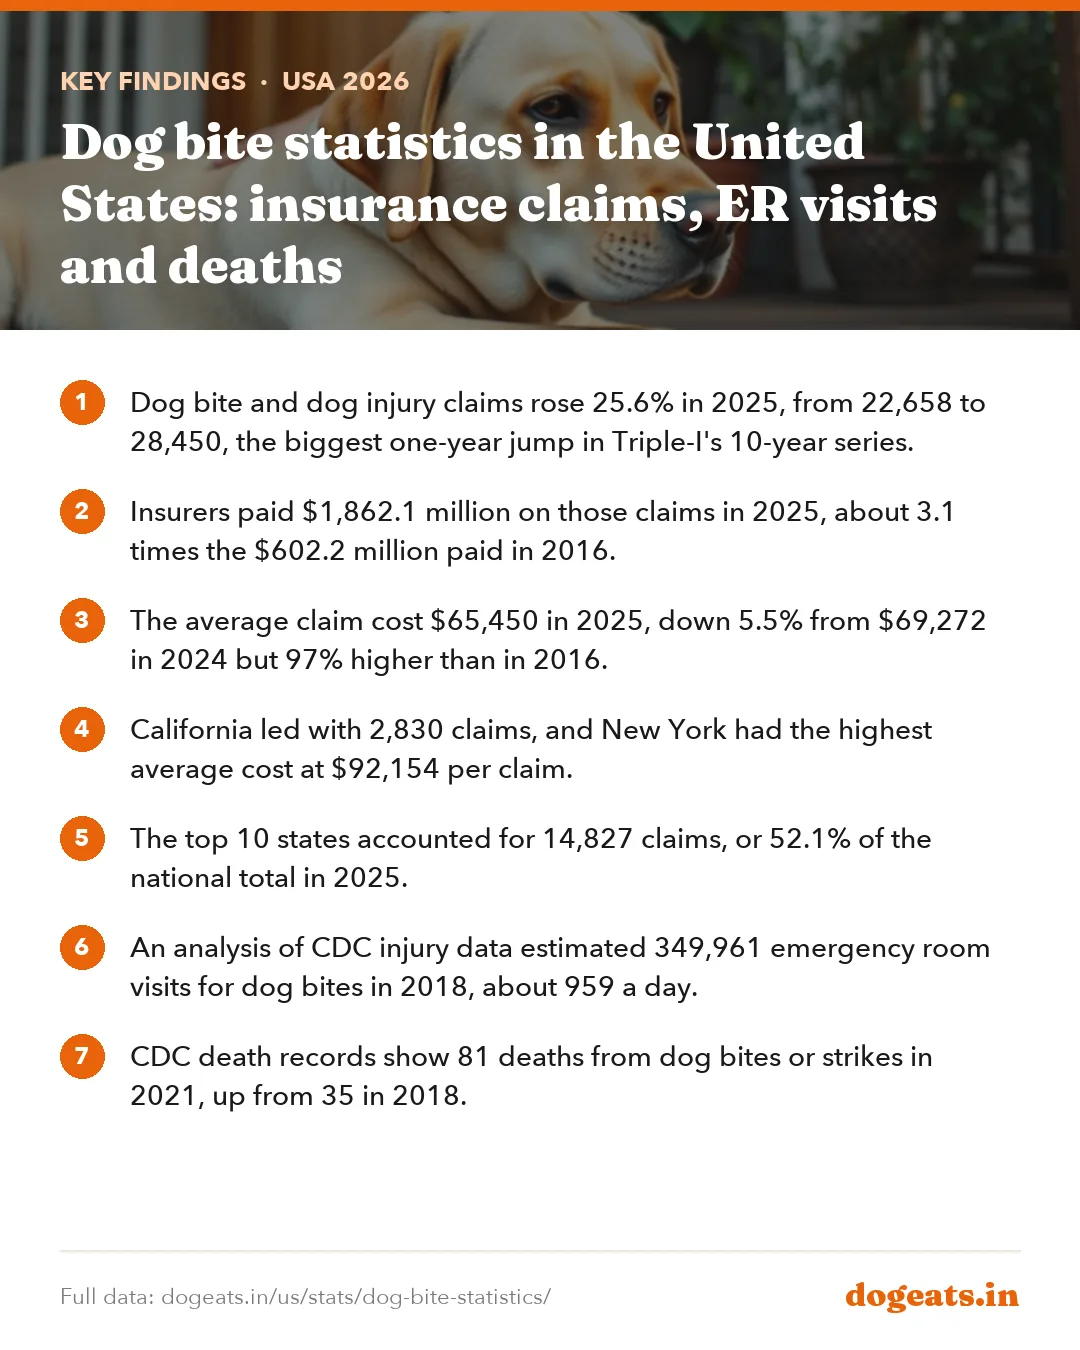
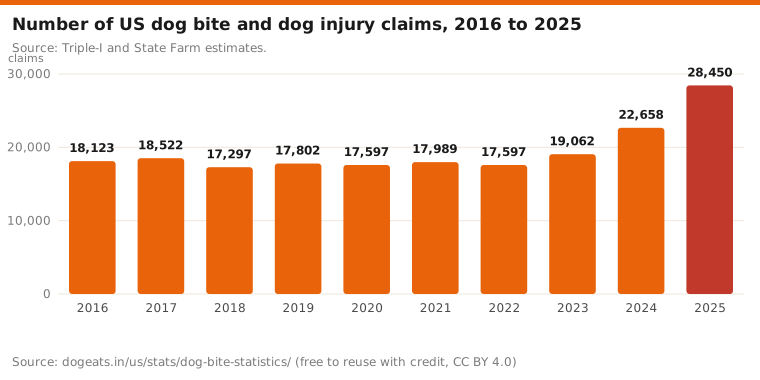
- Dog bite and dog injury claims rose 25.6% in 2025, from 22,658 to 28,450, the biggest one-year jump in Triple-I's 10-year series.
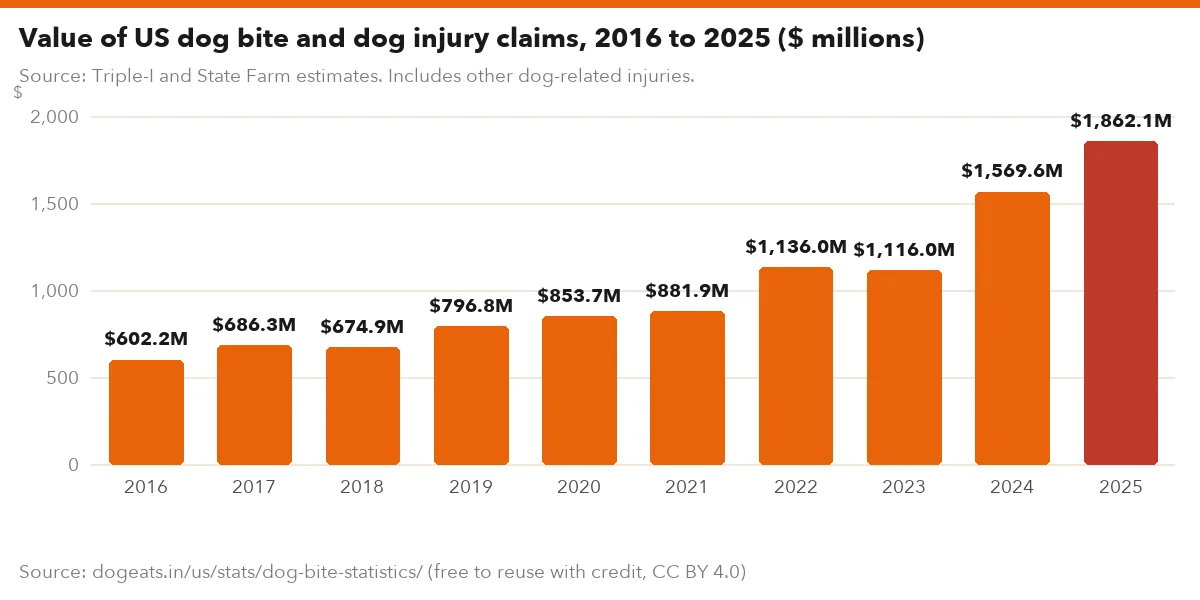
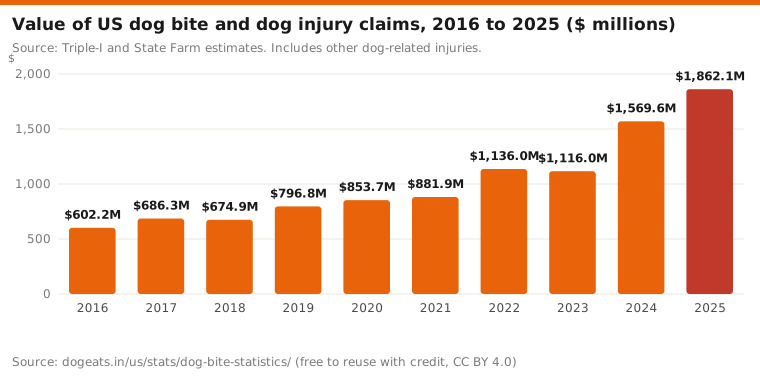
- Insurers paid $1,862.1 million on those claims in 2025, about 3.1 times the $602.2 million paid in 2016.
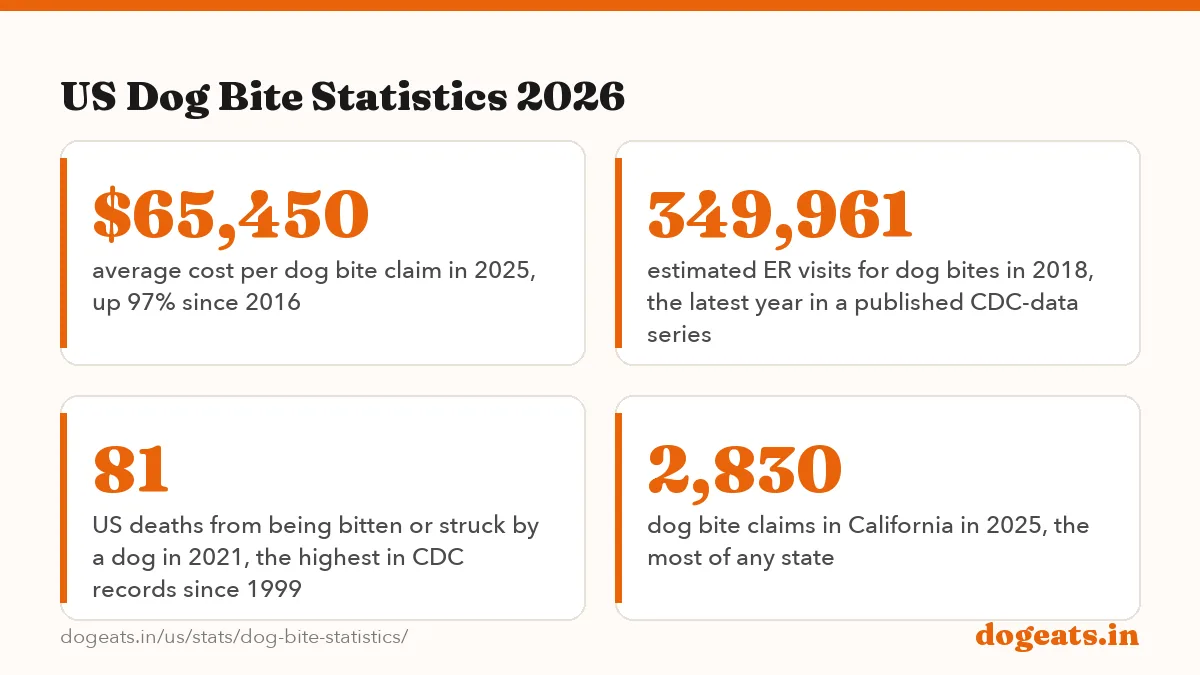
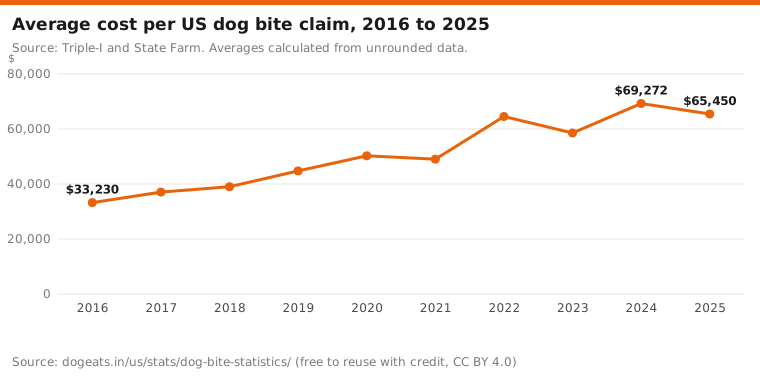
- The average claim cost $65,450 in 2025, down 5.5% from $69,272 in 2024 but 97% higher than in 2016.
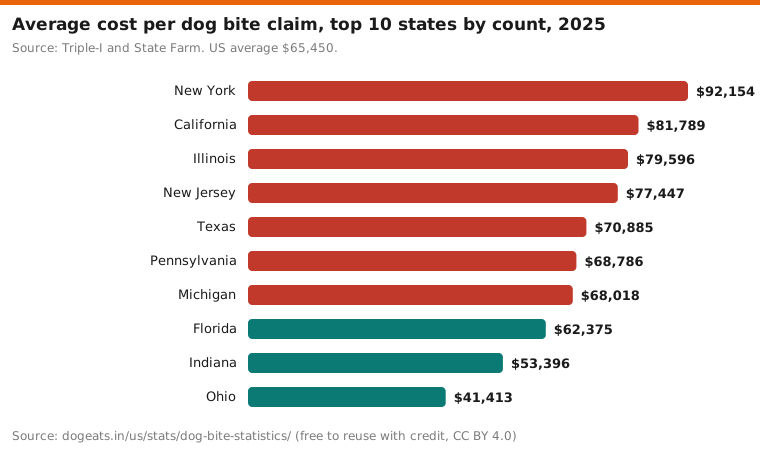
- California led with 2,830 claims, and New York had the highest average cost at $92,154 per claim.
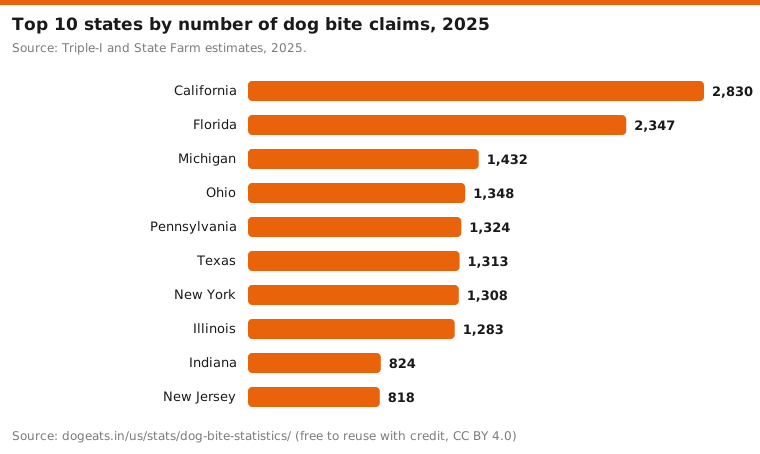
- The top 10 states accounted for 14,827 claims, or 52.1% of the national total in 2025.
- An analysis of CDC injury data estimated 349,961 emergency room visits for dog bites in 2018, about 959 a day.
- CDC death records show 81 deaths from dog bites or strikes in 2021, up from 35 in 2018.
- Children aged 5 to 9 have the highest ER visit rate for dog bites, at 202.9 per 100,000 people in 2005 to 2018.
- Adults 55 and older accounted for 52.2% of the 387 dog-related deaths recorded from 2011 to 2020, and children under 15 for 26.1%.
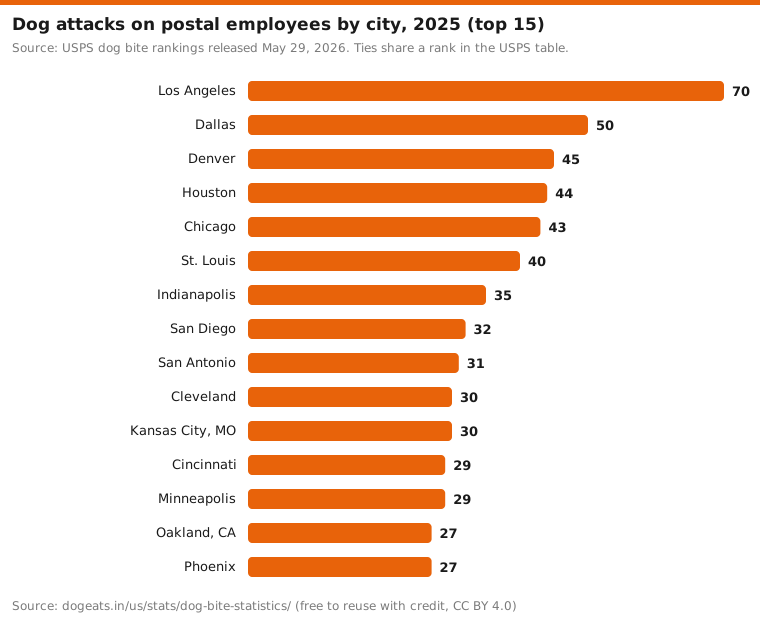
- Postal workers reported more than 5,200 dog attacks in 2025, down from more than 6,000 in 2024, with Los Angeles first at 70.
How many dog bites happen each year in the US?
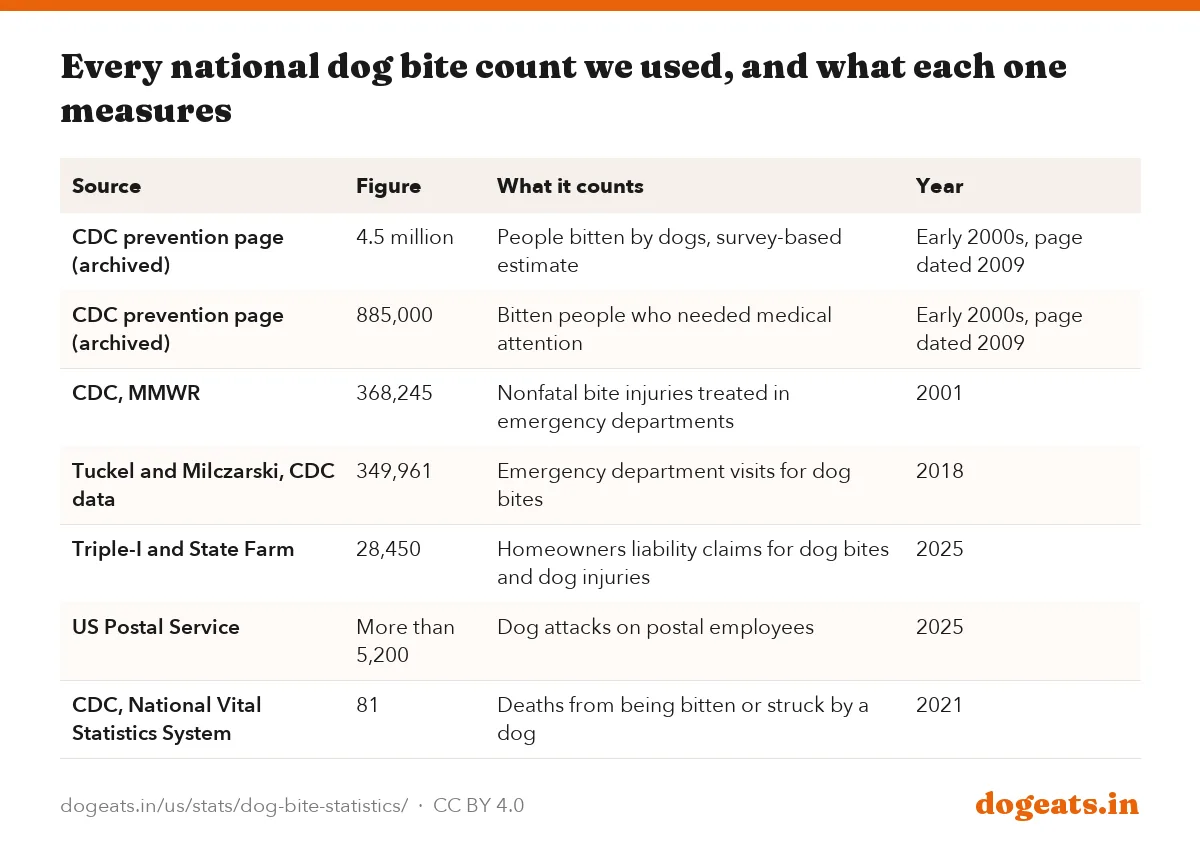
No single agency counts every dog bite in the United States. The numbers come from several systems, and each one sees a different slice of the problem.
The widest estimate is about 4.5 million people bitten a year, with 885,000 needing medical care. That figure appeared on a CDC prevention page last updated in 2009 and rests on phone surveys from the early 2000s.
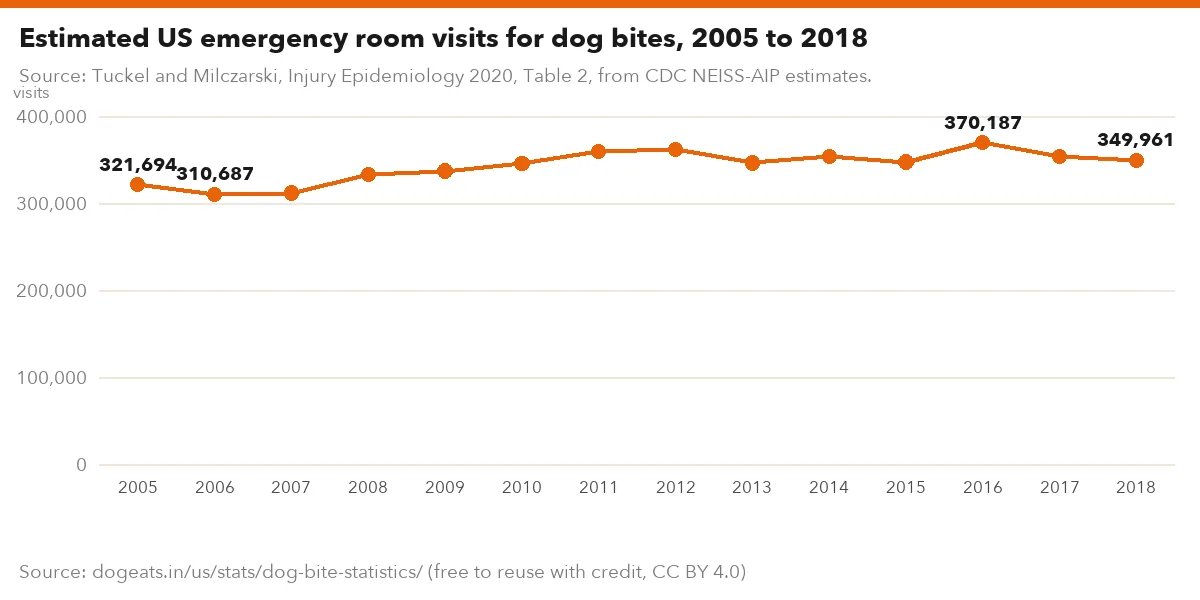
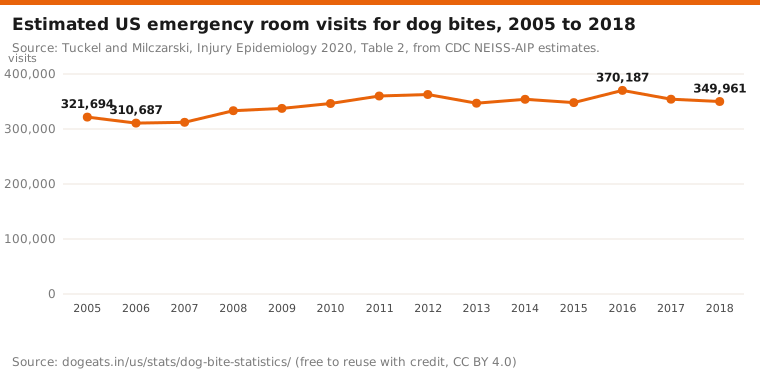
Hospital data are firmer. An analysis of CDC injury surveillance data by Tuckel and Milczarski estimated 349,961 emergency room visits for dog bites in 2018. The yearly average from 2005 to 2018 was about 343,400 visits.
| Source | Figure | What it counts | Year |
|---|---|---|---|
| CDC prevention page (archived) | 4.5 million | People bitten by dogs, survey-based estimate | Early 2000s, page dated 2009 |
| CDC prevention page (archived) | 885,000 | Bitten people who needed medical attention | Early 2000s, page dated 2009 |
| CDC, MMWR | 368,245 | Nonfatal bite injuries treated in emergency departments | 2001 |
| Tuckel and Milczarski, CDC data | 349,961 | Emergency department visits for dog bites | 2018 |
| Triple-I and State Farm | 28,450 | Homeowners liability claims for dog bites and dog injuries | 2025 |
| US Postal Service | More than 5,200 | Dog attacks on postal employees | 2025 |
| CDC, National Vital Statistics System | 81 | Deaths from being bitten or struck by a dog | 2021 |
Source: Tuckel and Milczarski, Injury Epidemiology 2020, Table 2, from CDC NEISS-AIP estimates.
Show the numbers
| Label | visits |
|---|---|
| 2005 | 321,694 |
| 2006 | 310,687 |
| 2007 | 312,231 |
| 2008 | 333,235 |
| 2009 | 337,526 |
| 2010 | 346,331 |
| 2011 | 359,972 |
| 2012 | 362,724 |
| 2013 | 346,925 |
| 2014 | 353,954 |
| 2015 | 347,952 |
| 2016 | 370,187 |
| 2017 | 354,154 |
| 2018 | 349,961 |
Embed this chart
The ER series peaked at 370,187 visits in 2016. The rate per 100,000 people rose until about 2012 and then eased, the authors found. The same paper's discussion gives 344,201 visits for 2018, which differs from its own table, so we show the table figure.
Most bites never reach any of these systems. A bite treated at home, at urgent care or by a family doctor is not in the ER count or the claims count.
Dog bite insurance claims reached $1.86 billion in 2025
Homeowners and renters insurers paid an estimated $1,862.1 million on dog-related liability claims in 2025. That covered 28,450 claims, according to the Insurance Information Institute (Triple-I) and State Farm.
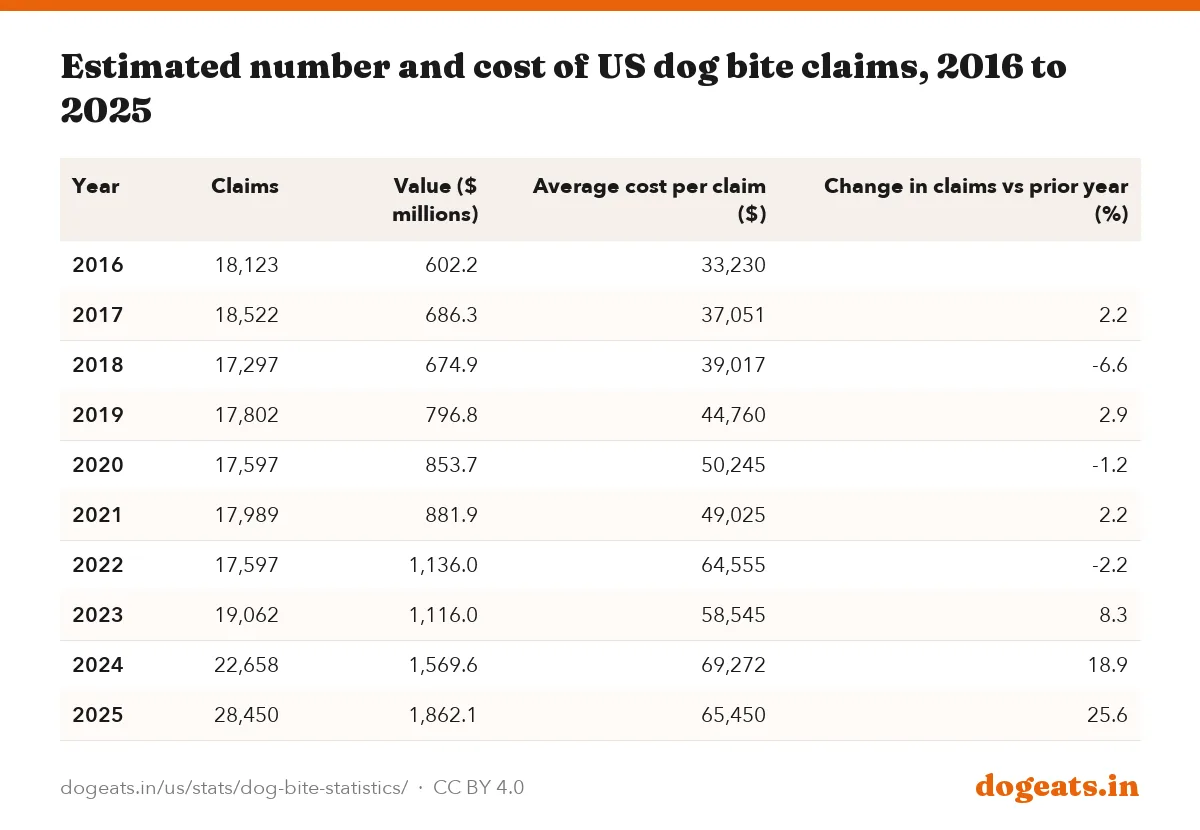
The claim count rose 25.6% in one year. Over the decade from 2016 it grew 57%, while the money paid more than tripled.
The series counts more than bites. Triple-I's note says it includes other dog-related injuries such as fractures and blunt force trauma, for example a person knocked over by a dog.
Source: Triple-I and State Farm estimates. Includes other dog-related injuries.
Show the numbers
| Label | $ |
|---|---|
| 2016 | $602.2M |
| 2017 | $686.3M |
| 2018 | $674.9M |
| 2019 | $796.8M |
| 2020 | $853.7M |
| 2021 | $881.9M |
| 2022 | $1,136.0M |
| 2023 | $1,116.0M |
| 2024 | $1,569.6M |
| 2025 | $1,862.1M |
Embed this chart
Source: Triple-I and State Farm estimates.
Show the numbers
| Label | claims |
|---|---|
| 2016 | 18,123 |
| 2017 | 18,522 |
| 2018 | 17,297 |
| 2019 | 17,802 |
| 2020 | 17,597 |
| 2021 | 17,989 |
| 2022 | 17,597 |
| 2023 | 19,062 |
| 2024 | 22,658 |
| 2025 | 28,450 |
Embed this chart
| Year | Claims | Value ($ millions) | Average cost per claim ($) | Change in claims vs prior year (%) |
|---|---|---|---|---|
| 2016 | 18,123 | 602.2 | 33,230 | |
| 2017 | 18,522 | 686.3 | 37,051 | 2.2 |
| 2018 | 17,297 | 674.9 | 39,017 | -6.6 |
| 2019 | 17,802 | 796.8 | 44,760 | 2.9 |
| 2020 | 17,597 | 853.7 | 50,245 | -1.2 |
| 2021 | 17,989 | 881.9 | 49,025 | 2.2 |
| 2022 | 17,597 | 1,136.0 | 64,555 | -2.2 |
| 2023 | 19,062 | 1,116.0 | 58,545 | 8.3 |
| 2024 | 22,658 | 1,569.6 | 69,272 | 18.9 |
| 2025 | 28,450 | 1,862.1 | 65,450 | 25.6 |
Claim counts were flat between 17,297 and 19,062 a year from 2016 to 2023. The rise since then is sharp: 18.9% in 2024 and 25.6% in 2025.
Triple-I does not break out why the count jumped. Pet ownership, claim reporting habits and the mix of insurers in the estimate can all move the number. Read the 2025 total as an industry estimate, not a census.
The average claim nearly doubled in a decade
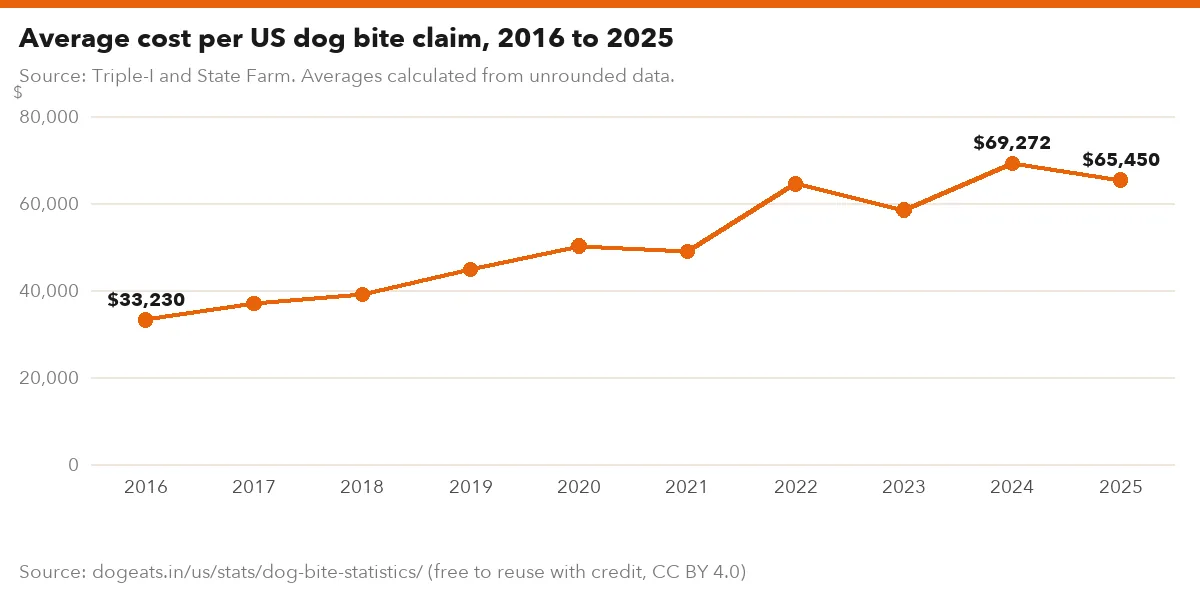
The average dog bite claim cost $65,450 in 2025. It was $33,230 in 2016, so the cost per claim rose 97% in nine years.
Triple-I links the rise to higher medical costs and larger settlements, judgments and jury awards. The average fell 5.5% in 2025 from a peak of $69,272 in 2024, but the trend line still points up.
Source: Triple-I and State Farm. Averages calculated from unrounded data.
Show the numbers
| Label | $ |
|---|---|
| 2016 | $33,230 |
| 2017 | $37,051 |
| 2018 | $39,017 |
| 2019 | $44,760 |
| 2020 | $50,245 |
| 2021 | $49,025 |
| 2022 | $64,555 |
| 2023 | $58,545 |
| 2024 | $69,272 |
| 2025 | $65,450 |
Embed this chart
State law shapes who pays. Triple-I describes three types: dog bite statutes that make owners liable without proof of fault, the one-bite rule, and plain negligence. Owners should check what their own homeowners or renters policy covers.
Insurance for the dog itself is a separate product. Our pet insurance statistics report covers vet bill policies, which do not pay for injuries a dog causes to people.
California and Florida file the most dog bite claims
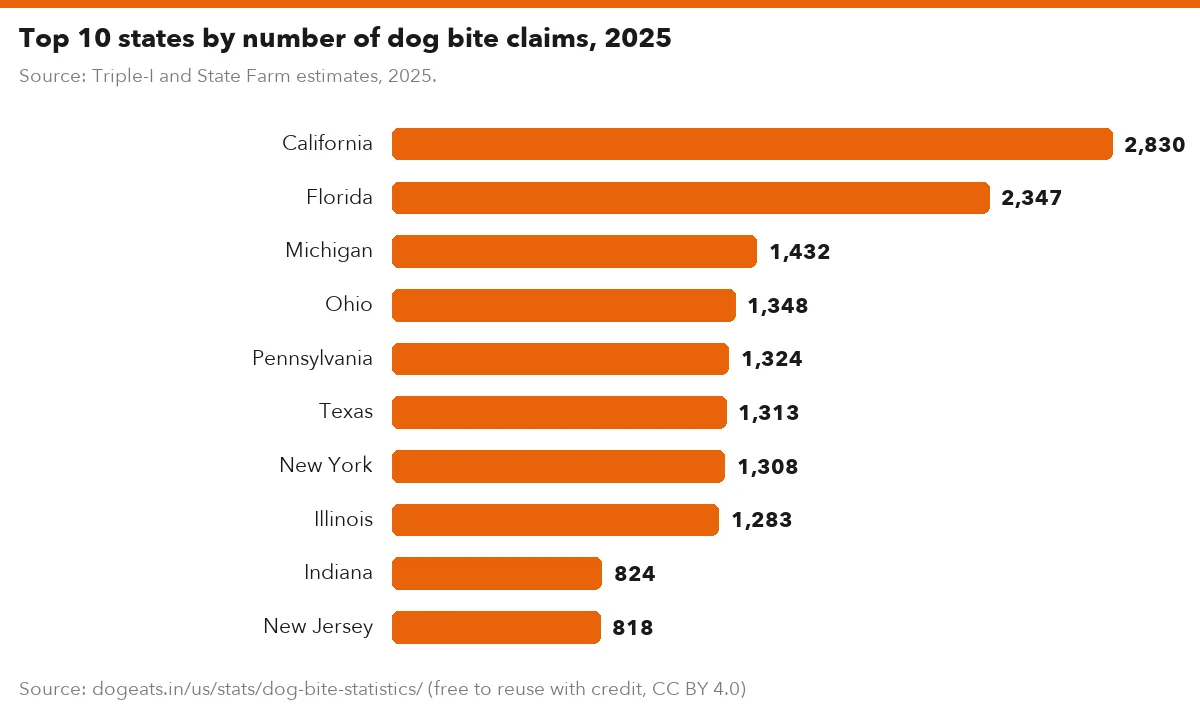
California had 2,830 dog bite claims in 2025, or 9.9% of the national total. Florida was second with 2,347, and Michigan third with 1,432.
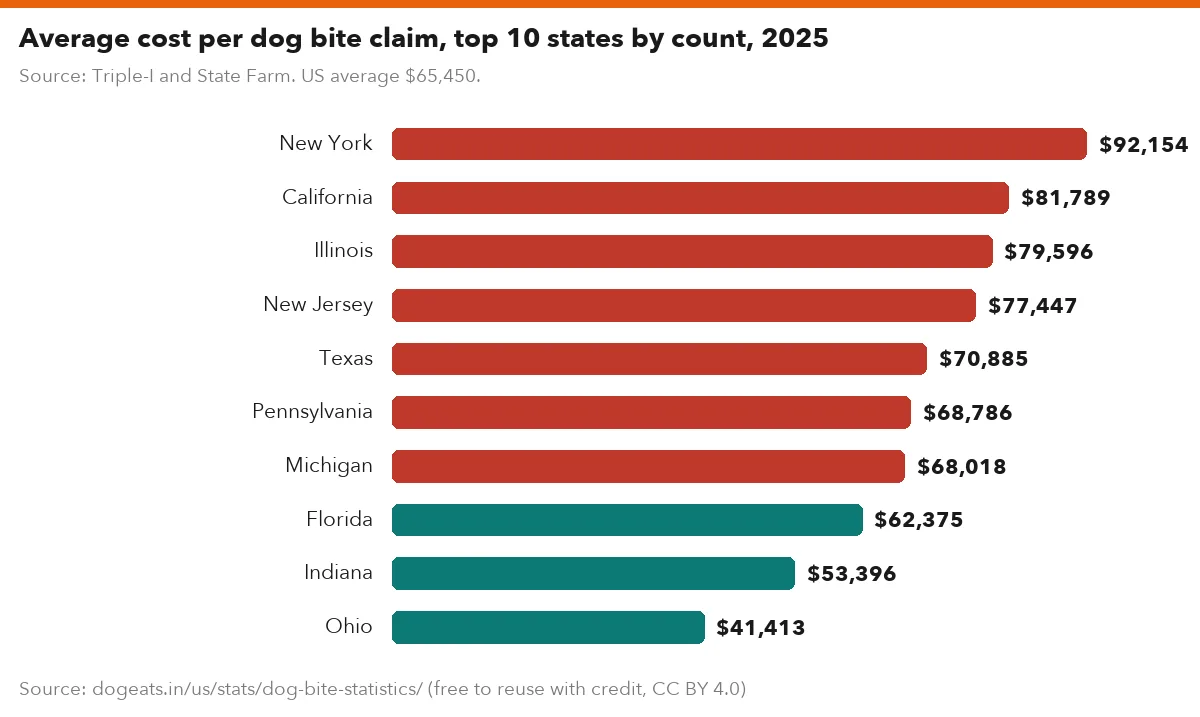
Costs vary more than counts. New York claims averaged $92,154, about 2.2 times Ohio's $41,413. Triple-I also names Connecticut second for average cost at $87,751, though it is not in the top 10 by count.

Source: Triple-I and State Farm estimates, 2025.
Show the numbers
| Label | claims |
|---|---|
| California | 2,830 |
| Florida | 2,347 |
| Michigan | 1,432 |
| Ohio | 1,348 |
| Pennsylvania | 1,324 |
| Texas | 1,313 |
| New York | 1,308 |
| Illinois | 1,283 |
| Indiana | 824 |
| New Jersey | 818 |
Embed this chart
Source: Triple-I and State Farm. US average $65,450.
Show the numbers
| Label | $ |
|---|---|
| New York | $92,154 |
| California | $81,789 |
| Illinois | $79,596 |
| New Jersey | $77,447 |
| Texas | $70,885 |
| Pennsylvania | $68,786 |
| Michigan | $68,018 |
| Florida | $62,375 |
| Indiana | $53,396 |
| Ohio | $41,413 |
Embed this chart
| Rank | State | Claims | Average cost per claim ($) | Value of claims ($ millions) | Share of US claims (%) |
|---|---|---|---|---|---|
| 1 | California | 2,830 | 81,789 | 231.5 | 9.9 |
| 2 | Florida | 2,347 | 62,375 | 146.0 | 8.2 |
| 3 | Michigan | 1,432 | 68,018 | 97.0 | 5.0 |
| 4 | Ohio | 1,348 | 41,413 | 56.0 | 4.7 |
| 5 | Pennsylvania | 1,324 | 68,786 | 91.0 | 4.7 |
| 6 | Texas | 1,313 | 70,885 | 93.0 | 4.6 |
| 7 | New York | 1,308 | 92,154 | 121.0 | 4.6 |
| 8 | Illinois | 1,283 | 79,596 | 102.0 | 4.5 |
| 9 | Indiana | 824 | 53,396 | 44.0 | 2.9 |
| 10 | New Jersey | 818 | 77,447 | 63.0 | 2.9 |
| Top 10 total | 14,827 | 70,496 | 1,045.2 | 52.1 | |
| All other states | 13,623 | 59,959 | 816.8 | 47.9 | |
| United States | 28,450 | 65,450 | 1,862.1 | 100.0 |
Big states lead on counts partly because they have more people and more insured homes. Triple-I publishes only the top 10, so a per-capita ranking of all 50 states is not possible from this source.
How many people die from dog attacks in the US?
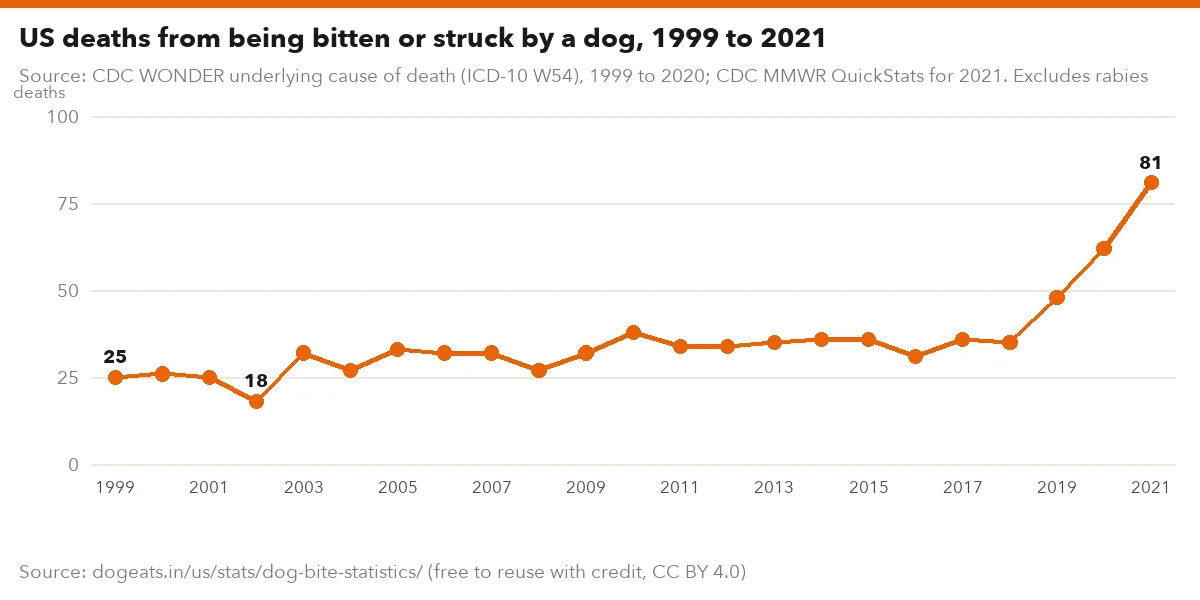
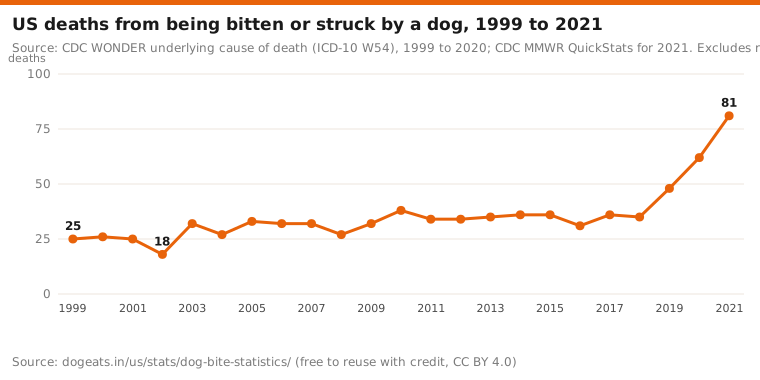
Deaths are rare but have risen. CDC death certificate data record 81 deaths in 2021 where being bitten or struck by a dog was the underlying cause. That was the highest yearly total since at least 1999.
From 1999 to 2018 the count ranged from 18 to 38 deaths a year, averaging 31.2. It then rose to 48 in 2019, 62 in 2020 and 81 in 2021. CDC counted 468 such deaths from 2011 to 2021, an average of 43 a year.
Source: CDC WONDER underlying cause of death (ICD-10 W54), 1999 to 2020; CDC MMWR QuickStats for 2021. Excludes rabies deaths.
Show the numbers
| Label | deaths |
|---|---|
| 1999 | 25 |
| 2000 | 26 |
| 2001 | 25 |
| 2002 | 18 |
| 2003 | 32 |
| 2004 | 27 |
| 2005 | 33 |
| 2006 | 32 |
| 2007 | 32 |
| 2008 | 27 |
| 2009 | 32 |
| 2010 | 38 |
| 2011 | 34 |
| 2012 | 34 |
| 2013 | 35 |
| 2014 | 36 |
| 2015 | 36 |
| 2016 | 31 |
| 2017 | 36 |
| 2018 | 35 |
| 2019 | 48 |
| 2020 | 62 |
| 2021 | 81 |
Embed this chart
| Age group | Deaths | Share of deaths (%) | Deaths per 10 million people a year |
|---|---|---|---|
| Under 1 | 30 | 7.8 | 7.7 |
| 1 to 4 | 43 | 11.1 | 2.7 |
| 5 to 14 | 28 | 7.2 | 0.7 |
| 15 to 24 | Under 10 (suppressed) | ||
| 25 to 34 | 12 | 3.1 | 0.3 |
| 35 to 44 | 26 | 6.7 | 0.6 |
| 45 to 54 | 42 | 10.9 | 1.0 |
| 55 to 64 | 70 | 18.1 | 1.7 |
| 65 to 74 | 57 | 14.7 | 2.0 |
| 75 to 84 | 43 | 11.1 | 3.0 |
| 85 and over | 32 | 8.3 | 5.1 |
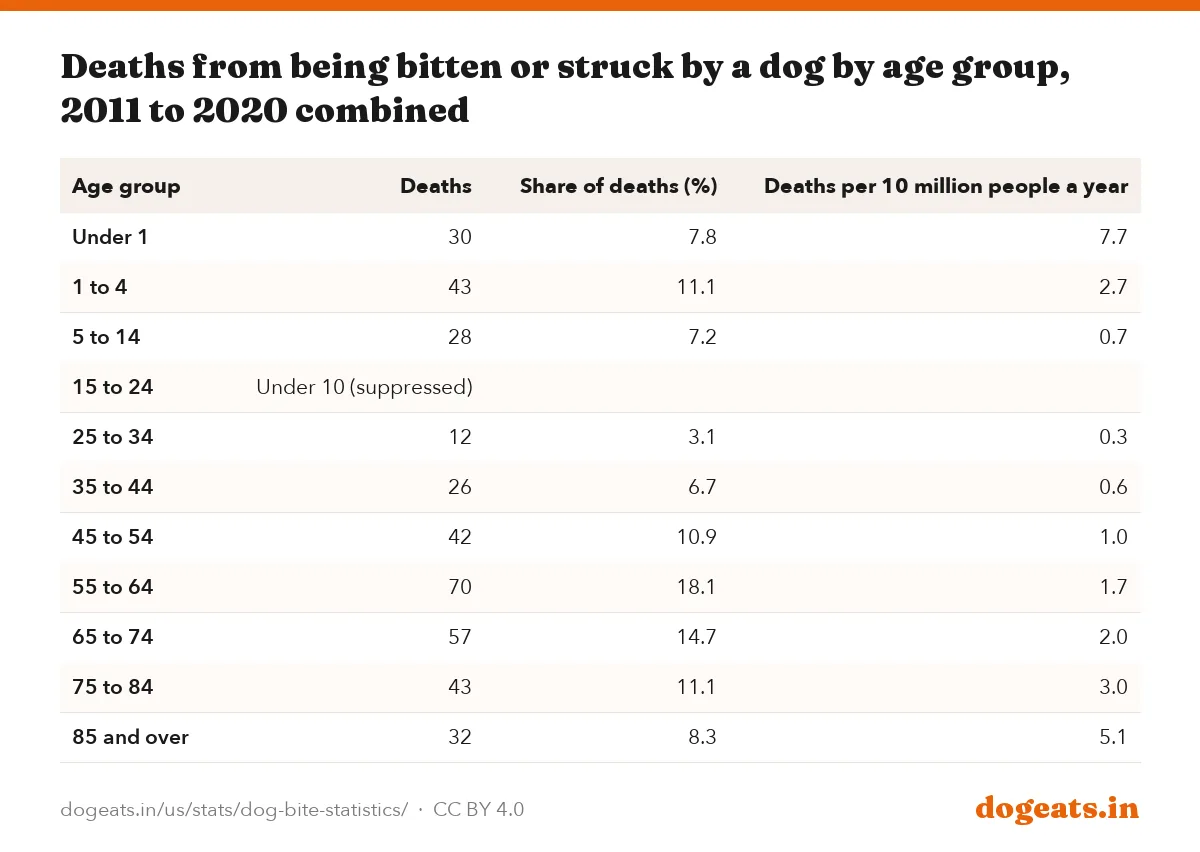
Older adults make up the largest share of deaths. People 55 and older accounted for 202 of the 387 deaths from 2011 to 2020, or 52.2%. Children under 15 accounted for 101, or 26.1%.
The highest risk per person is at the two ends of life. Babies under 1 had about 7.7 deaths per 10 million a year, and adults 85 and older about 5.1. CDC suppresses counts under 10, so the 15 to 24 group is not shown.
MMWR also noted a shift by sex. Males outnumbered females in most years to 2016, but more females died each year from 2017 to 2021.
Children aged 5 to 9 have the highest ER rate for dog bites
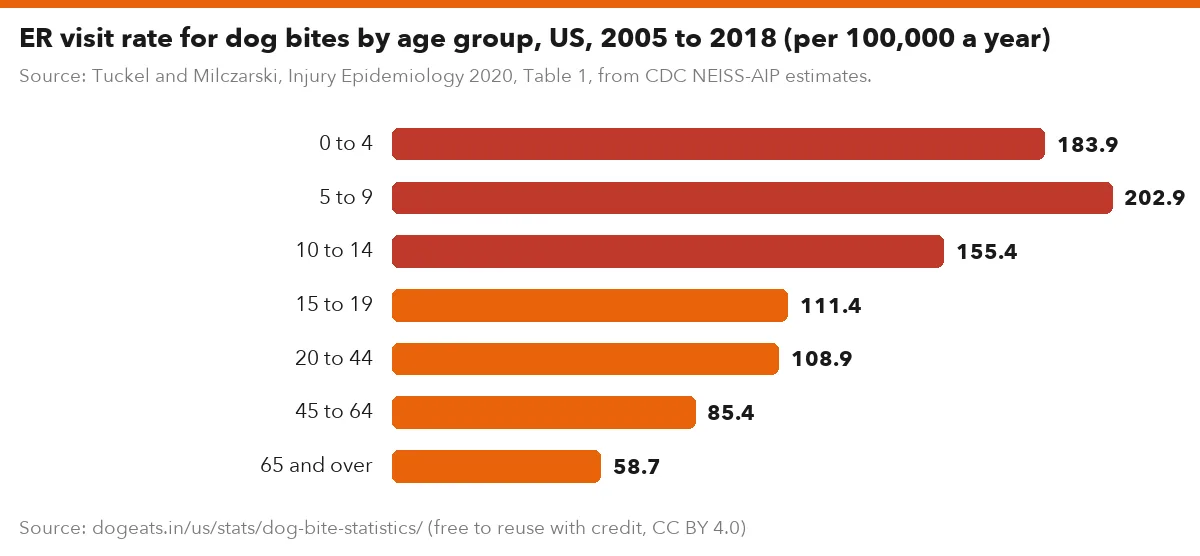
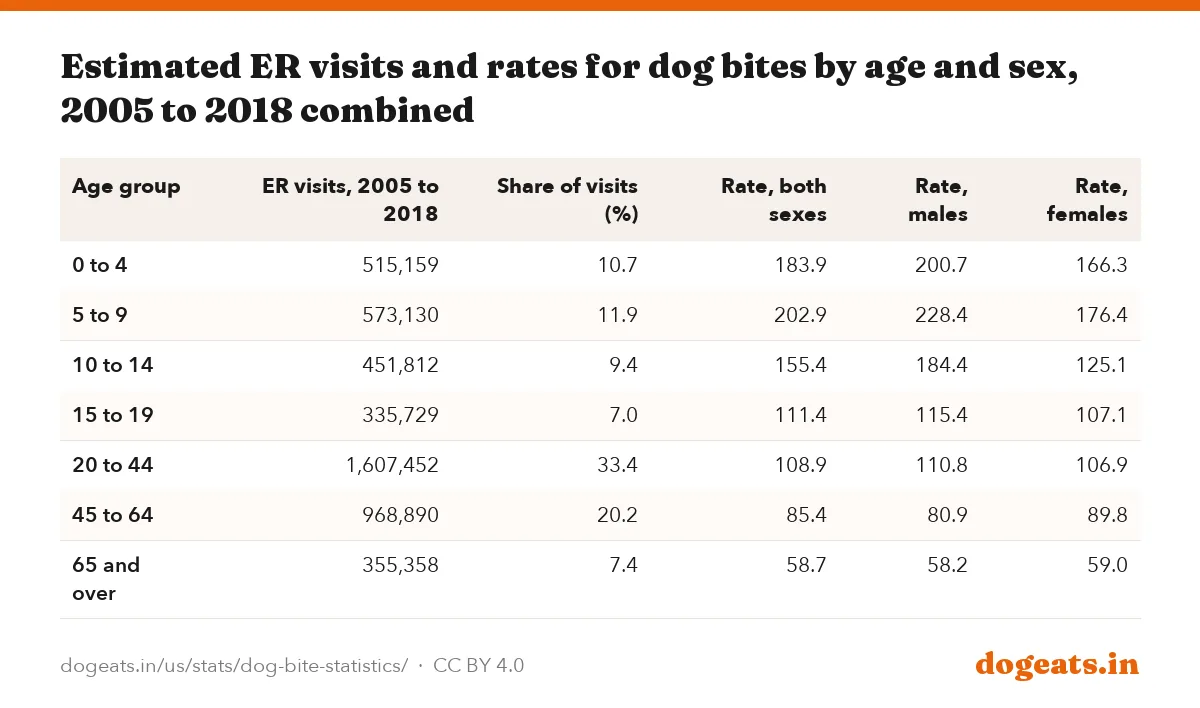
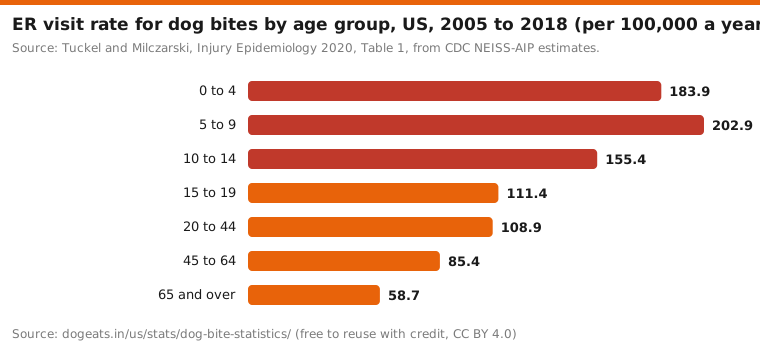
Bite injuries skew young. In CDC-based data for 2005 to 2018, children aged 5 to 9 had 202.9 ER visits for dog bites per 100,000 people a year. Adults 65 and older had 58.7.
Boys are bitten more often than girls through age 14. For ages 5 to 9 the rate was 228.4 for boys against 176.4 for girls. The gap closes in adulthood.

Source: Tuckel and Milczarski, Injury Epidemiology 2020, Table 1, from CDC NEISS-AIP estimates.
Show the numbers
| Label | per 100,000 |
|---|---|
| 0 to 4 | 183.9 |
| 5 to 9 | 202.9 |
| 10 to 14 | 155.4 |
| 15 to 19 | 111.4 |
| 20 to 44 | 108.9 |
| 45 to 64 | 85.4 |
| 65 and over | 58.7 |
Embed this chart
| Age group | ER visits, 2005 to 2018 | Share of visits (%) | Rate, both sexes | Rate, males | Rate, females |
|---|---|---|---|---|---|
| 0 to 4 | 515,159 | 10.7 | 183.9 | 200.7 | 166.3 |
| 5 to 9 | 573,130 | 11.9 | 202.9 | 228.4 | 176.4 |
| 10 to 14 | 451,812 | 9.4 | 155.4 | 184.4 | 125.1 |
| 15 to 19 | 335,729 | 7.0 | 111.4 | 115.4 | 107.1 |
| 20 to 44 | 1,607,452 | 33.4 | 108.9 | 110.8 | 106.9 |
| 45 to 64 | 968,890 | 20.2 | 85.4 | 80.9 | 89.8 |
| 65 and over | 355,358 | 7.4 | 58.7 | 58.2 | 59.0 |
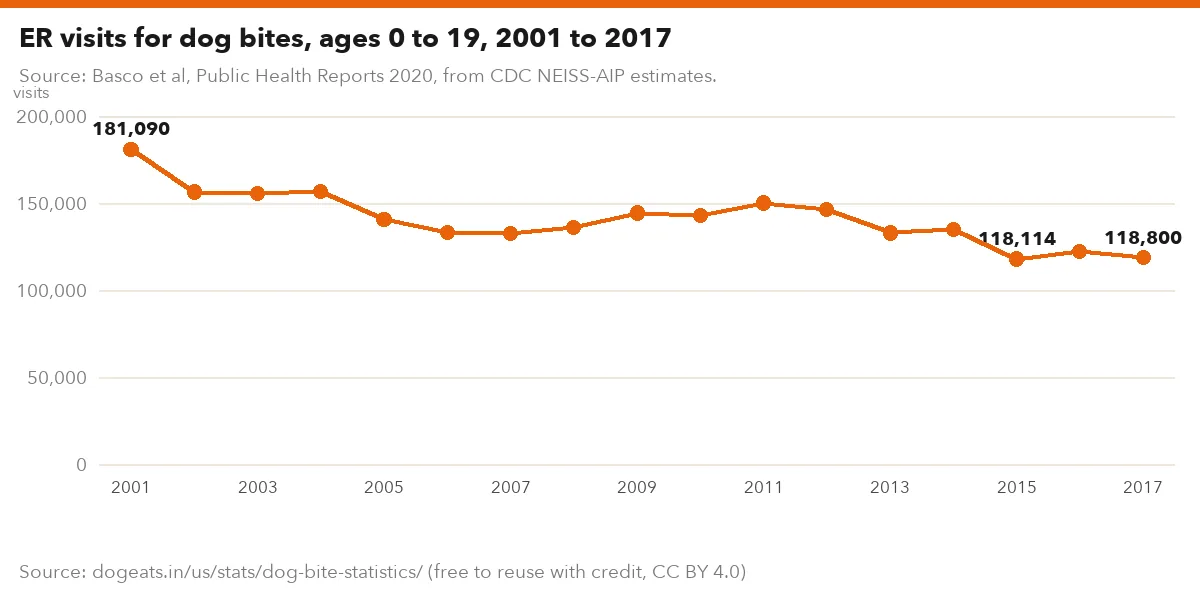
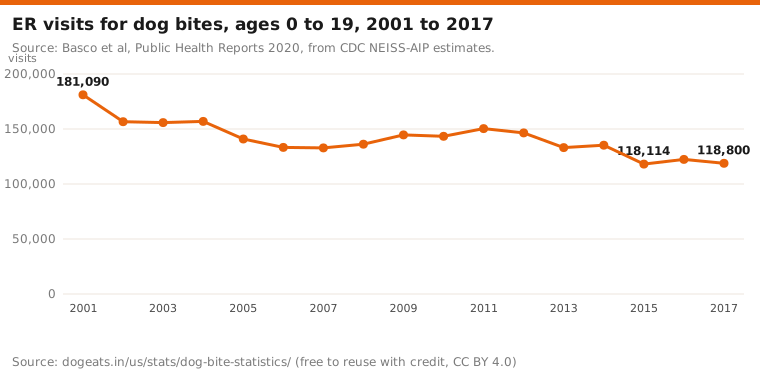
Source: Basco et al, Public Health Reports 2020, from CDC NEISS-AIP estimates.
Show the numbers
| Label | visits |
|---|---|
| 2001 | 181,090 |
| 2002 | 156,674 |
| 2003 | 155,791 |
| 2004 | 156,890 |
| 2005 | 140,953 |
| 2006 | 133,297 |
| 2007 | 132,837 |
| 2008 | 136,149 |
| 2009 | 144,606 |
| 2010 | 143,329 |
| 2011 | 150,372 |
| 2012 | 146,459 |
| 2013 | 133,133 |
| 2014 | 135,255 |
| 2015 | 118,114 |
| 2016 | 122,360 |
| 2017 | 118,800 |
Embed this chart
Children's bites have fallen. Basco and colleagues found ER visits for dog bites among people aged 0 to 19 dropped 34.4%, from 181,090 in 2001 to 118,800 in 2017.
Sources disagree on children's share. Triple-I's 2025 release says more than 50% of dog-related injuries are to children. In the CDC-based ER data for 2005 to 2018, ages 0 to 14 made up 32.0% of visits and ages 0 to 19 made up 39.0%.
The difference may come from what is counted. Survey estimates include minor bites, while ER data include only injuries treated in a hospital. CDC's 2001 report found 42% of ER-treated bites were to children under 14.
Young children are more often bitten on the head and neck
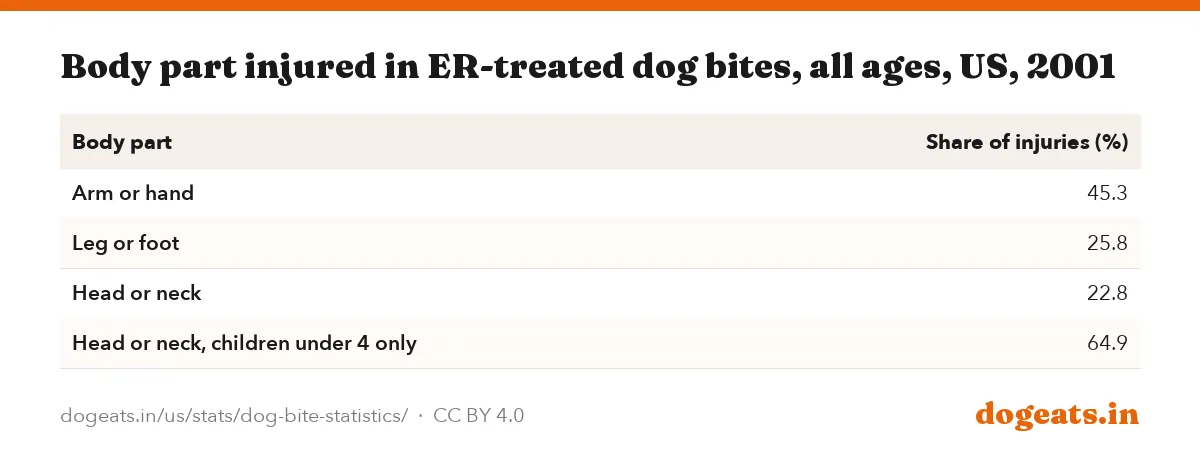
The pattern of injury changes with height. CDC's 2001 analysis found 64.9% of ER-treated dog bites in children under 4 were to the head or neck.
Across all ages, the arm and hand took 45.3% of injuries, the leg and foot 25.8% and the head and neck 22.8%. About 98.2% of patients were treated and released the same day.
| Body part | Share of injuries (%) |
|---|---|
| Arm or hand | 45.3 |
| Leg or foot | 25.8 |
| Head or neck | 22.8 |
| Head or neck, children under 4 only | 64.9 |
- Never leave a young child alone with any dog, including the family pet. Triple-I's release gives this as its first prevention point.
- Teach children to ask the owner before petting a dog they do not know.
- Leave a dog alone while it eats, sleeps or cares for puppies.
- Any bite that breaks the skin needs medical advice, because of infection and rabies risk. Ask a doctor, not a search engine.
These figures are from 2001, because CDC has not published a newer national body-part breakdown. Treat them as a pattern, not a current count.
Mail carriers reported more than 5,200 dog attacks in 2025
The US Postal Service counts attacks on its own employees. It reported more than 5,200 dog attacks in 2025, down from more than 6,000 in 2024.
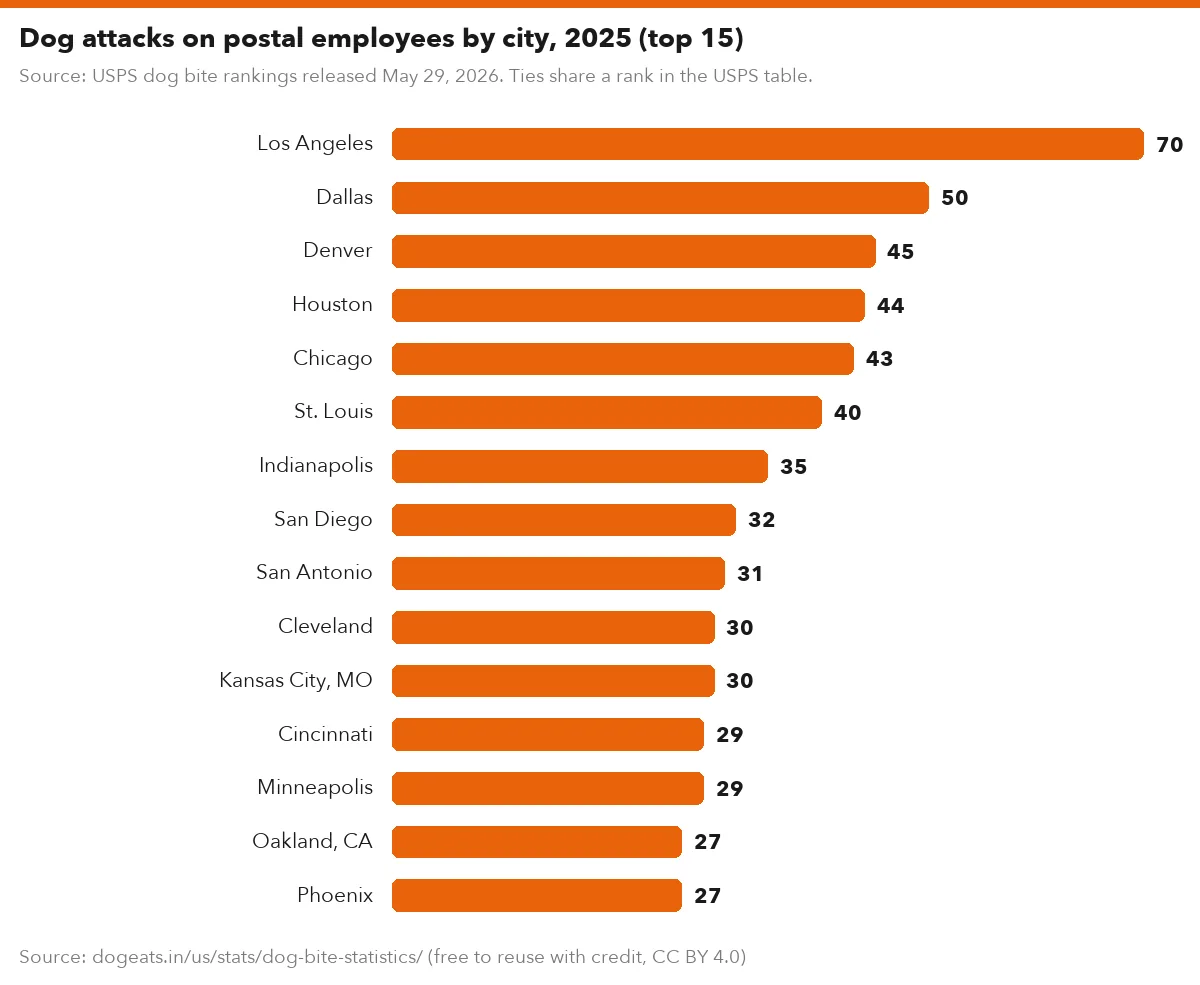
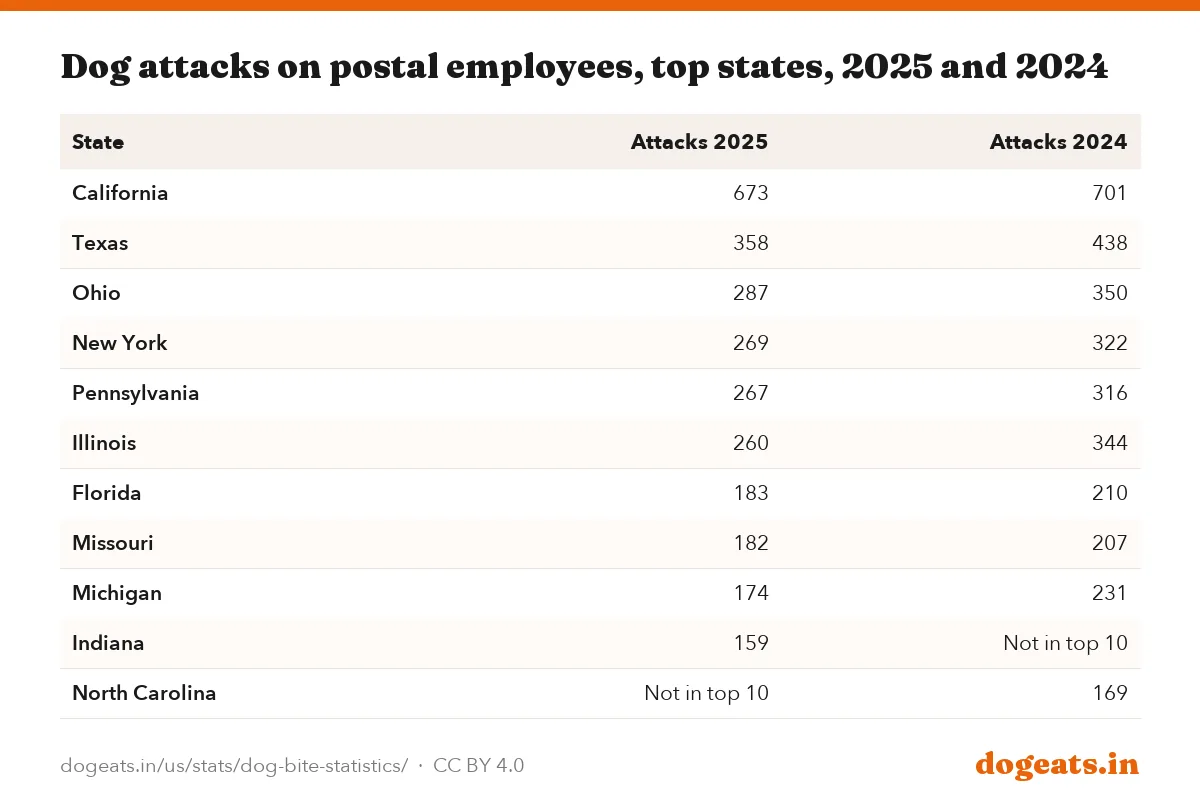
Los Angeles topped the city ranking in both years, with 70 attacks in 2025 against 77 in 2024. Dallas had 50 and Denver 45. By state, California had 673, Texas 358 and Ohio 287.
Source: USPS dog bite rankings released May 29, 2026. Ties share a rank in the USPS table.
Show the numbers
| Label | attacks |
|---|---|
| Los Angeles | 70 |
| Dallas | 50 |
| Denver | 45 |
| Houston | 44 |
| Chicago | 43 |
| St. Louis | 40 |
| Indianapolis | 35 |
| San Diego | 32 |
| San Antonio | 31 |
| Cleveland | 30 |
| Kansas City, MO | 30 |
| Cincinnati | 29 |
| Minneapolis | 29 |
| Oakland, CA | 27 |
| Phoenix | 27 |
Embed this chart
| State | Attacks 2025 | Attacks 2024 |
|---|---|---|
| California | 673 | 701 |
| Texas | 358 | 438 |
| Ohio | 287 | 350 |
| New York | 269 | 322 |
| Pennsylvania | 267 | 316 |
| Illinois | 260 | 344 |
| Florida | 183 | 210 |
| Missouri | 182 | 207 |
| Michigan | 174 | 231 |
| Indiana | 159 | Not in top 10 |
| North Carolina | Not in top 10 | 169 |
All nine states that made both top 10 lists fell between 2024 and 2025. Texas dropped from 438 to 358, and Illinois from 344 to 260.
USPS runs its awareness campaign in June. In 2026 it ran through the month rather than for a single week.
What the dog bite data can and cannot tell you
Each source answers a different question, so the figures should not be added together. Claims measure money, ER data measure treated injuries, and death data measure fatal cases only.
National Dog Bite Prevention Week runs each April, and Triple-I and State Farm released their 2024 figures during it. Triple-I gave the 2025 dates as April 13 to 18.
- CDC's ER estimates come from NEISS-AIP, a national sample of about 66 hospitals. They give national estimates only, with no state figures.
- Neither CDC's ER data nor its death data record the breed of dog.
- The death series counts ICD-10 code W54 as the underlying cause and excludes rabies deaths. We did not find official counts after 2021.
- Triple-I claims are estimates for the homeowners market and include non-bite injuries, such as falls caused by a dog.
- USPS counts cover only postal employees on duty.
- Advocacy groups such as DogsBite.org publish their own fatality and breed tallies from news reports. They are not official statistics, and we do not use them here.
For context on how many dogs Americans own, see our dog ownership statistics. Breed popularity, which bite data cannot fairly be compared against, is in most popular dog breeds.
Frequently asked questions
How many dog bites happen in the US each year?
There is no complete count. A CDC estimate from the early 2000s put it at about 4.5 million bites a year, with 885,000 needing medical care. CDC-based hospital data show about 350,000 emergency room visits a year, with 349,961 estimated in 2018.
How much do insurers pay for dog bites?
US insurers paid an estimated $1.86 billion on 28,450 dog bite and dog injury claims in 2025, according to Triple-I and State Farm. The average claim cost $65,450.
Which state has the most dog bite claims?
California, with 2,830 claims in 2025. Florida was second with 2,347 and Michigan third with 1,432. New York had the highest average cost per claim at $92,154.
How many people die from dog bites each year in the US?
CDC recorded 81 deaths in 2021 from being bitten or struck by a dog, the highest since at least 1999. From 2011 to 2021 the average was 43 a year.
Who is most likely to be bitten by a dog?
Children aged 5 to 9 have the highest emergency room rate, at 202.9 visits per 100,000 a year in 2005 to 2018 data. Boys are bitten more often than girls through age 14.
Are children most at risk of dying from dog attacks?
No. Adults 55 and older made up 52.2% of the 387 deaths recorded from 2011 to 2020. Children under 15 made up 26.1%, though babies under 1 have a high rate per person.
Why is the average cost of a dog bite claim so high?
Triple-I links it to rising medical costs and larger settlements, judgments and jury awards. The average claim rose 97% from $33,230 in 2016 to $65,450 in 2025.
When is National Dog Bite Prevention Week?
It is held each April. Triple-I gave the 2025 dates as April 13 to 18, and released its claim figures that week. USPS runs a separate dog bite awareness campaign each June.
Does CDC track dog bites by breed?
No. CDC emergency room and death data do not record breed. Breed tallies online usually come from news reports compiled by advocacy groups, not from official records.
Methodology and limitations
We compiled national dog bite figures from four official or peer-reviewed systems: Triple-I and State Farm insurance estimates, CDC death certificate data, CDC-based emergency department estimates, and USPS employee reports. We opened every source listed below.
Annual deaths for 1999 to 2020 come from a CDC WONDER query of underlying cause of death code W54, run in October 2026. The 2021 figure and the 2011 to 2021 total of 468 come from CDC's MMWR QuickStats, which our query matches.
Age-group death shares and rates per 10 million are dogeats.in calculations from the same CDC WONDER data for 2011 to 2020 combined. CDC suppresses counts from 1 to 9, so the 15 to 24 group is blank.
Shares of claims, year-on-year changes and the claims-to-ER ratio are our calculations from the published figures. We did not adjust dollar amounts for inflation.
Sources
- CDC, MMWR QuickStats: Deaths from being bitten or struck by a dog, 2011 to 2021 (Sept 2023), 468 deaths 2011 to 2021, 81 in 2021, trend by sex
- Insurance Information Institute (Triple-I) and State Farm, Spotlight on dog bite liability, Claims, value and average cost 2016 to 2025, top 10 states 2025, liability laws
- CDC WONDER, Underlying Cause of Death 1999 to 2020, Annual W54 deaths 1999 to 2020 and deaths by age group 2011 to 2020
- Also consulted: Tuckel and Milczarski, The changing epidemiology of dog bite injuries in the United States, 2005 to 2018, Injury Epidemiology 2020, Basco, McCormack and Basco, Public Health Reports 2020, CDC, MMWR: Nonfatal dog bite-related injuries treated in hospital emergency departments, 2001, CDC, Dog bite prevention page (archived, last updated 2009), Triple-I and State Farm press release, April 16, 2025, US Postal Service, dog attack rankings, May 29, 2026, US Postal Service, dog bite national rankings, June 2025.
Cite, embed and download
This report, its data and its images are free to reuse under a Creative Commons Attribution 4.0 licence. Credit dogeats.in with a link to this page. Every chart has its own embed code, every table has a CSV and an image download, and the images below are ready for social posts, slides and articles.
Cite this report
Link to this report
Every chart and table as an image