Data report · Updated October 2026
Fatal dog attacks by breed: US dog attack deaths per year, and what the breed data can and cannot show
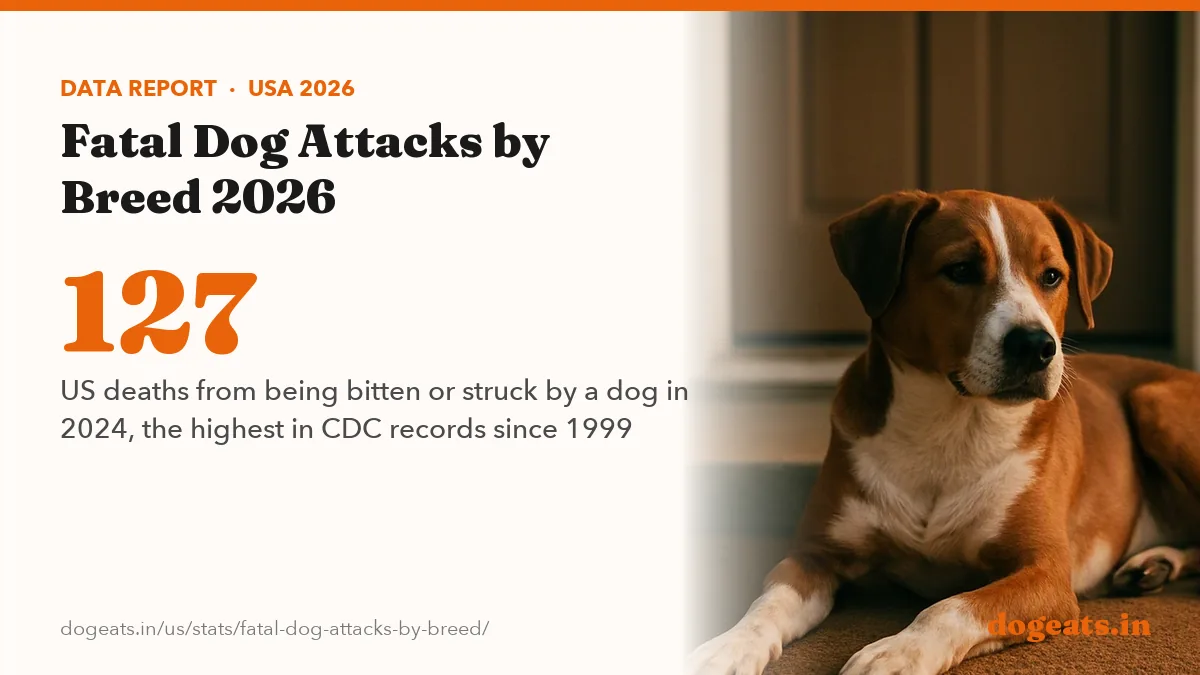
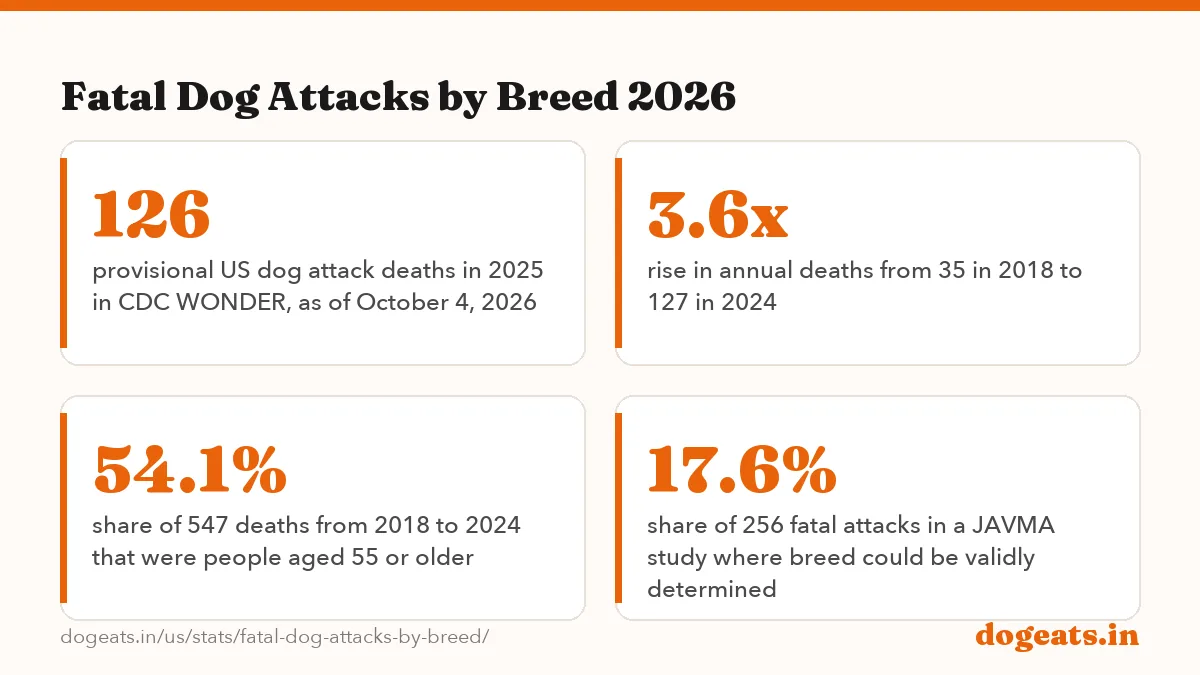
Dogs killed 127 people in the United States in 2024, the most in CDC death records going back to 1999, and provisional data show 126 more in 2025. No government agency records the breed of dog involved. Breed tallies come from news-based counts by advocacy groups, and peer-reviewed studies disagree on what those tallies mean.

Key findings
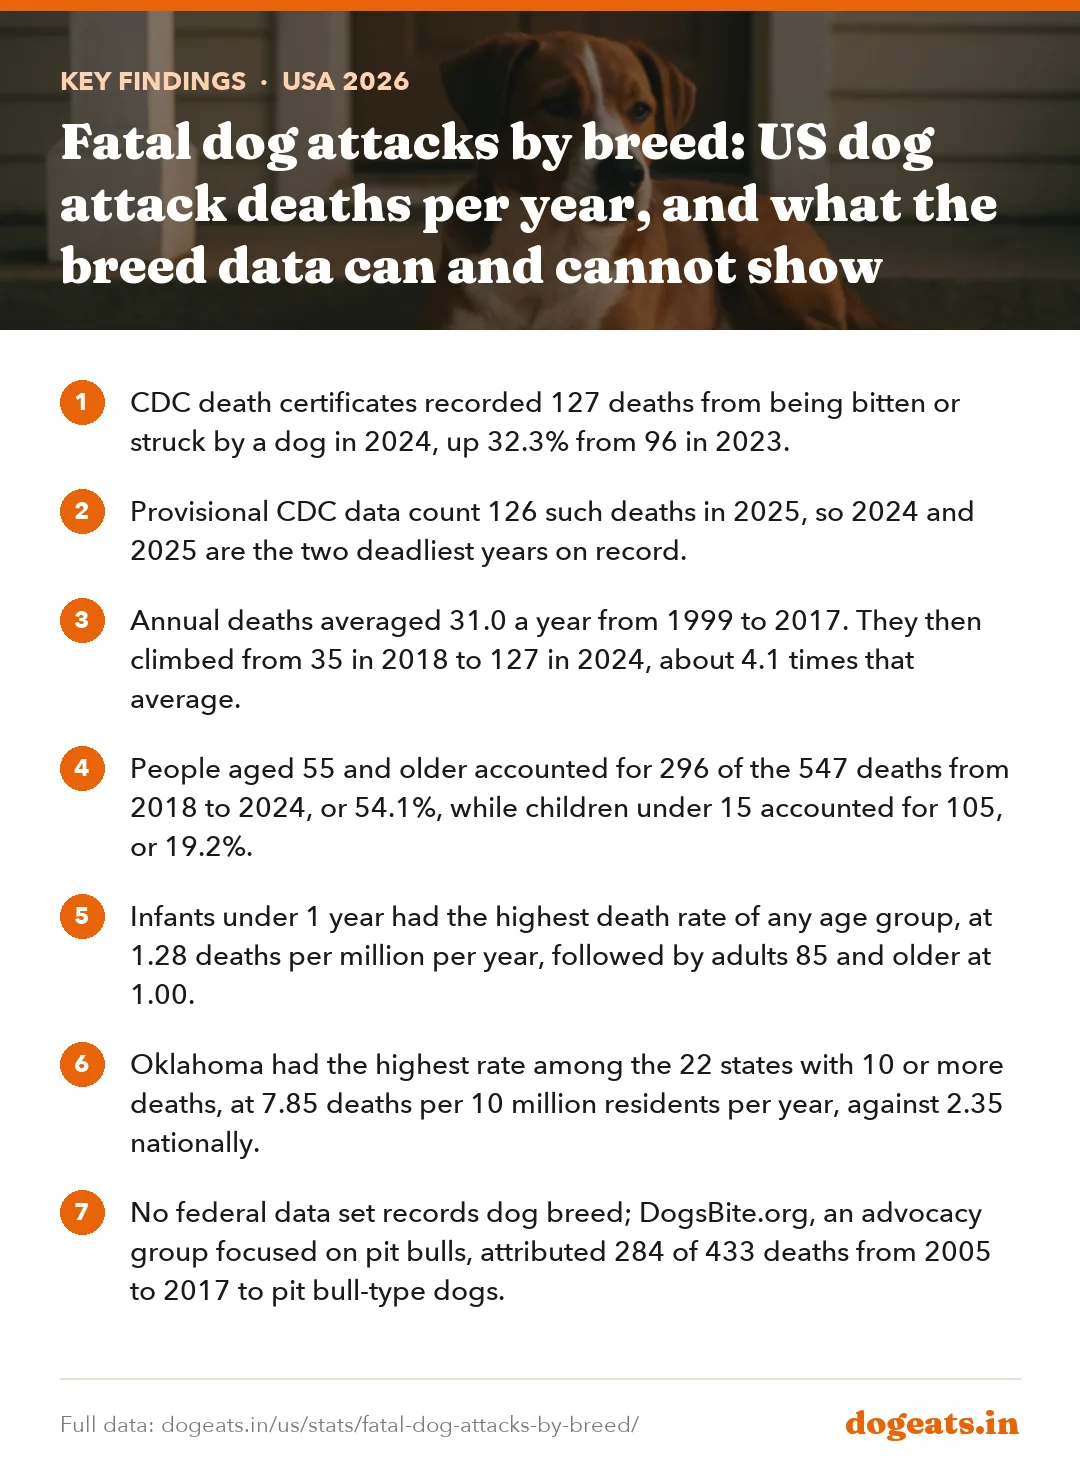
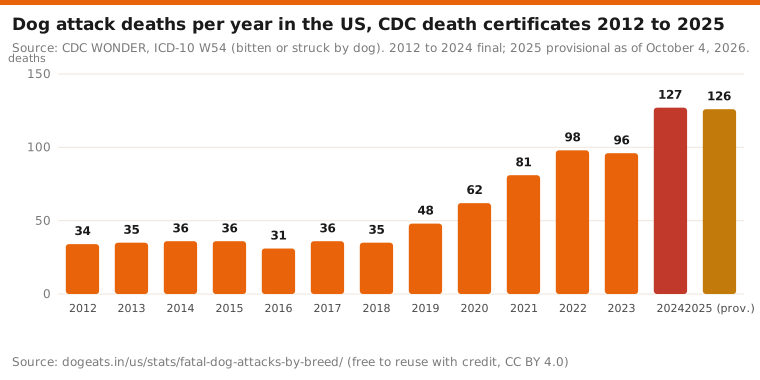
- CDC death certificates recorded 127 deaths from being bitten or struck by a dog in 2024, up 32.3% from 96 in 2023.
- Provisional CDC data count 126 such deaths in 2025, so 2024 and 2025 are the two deadliest years on record.
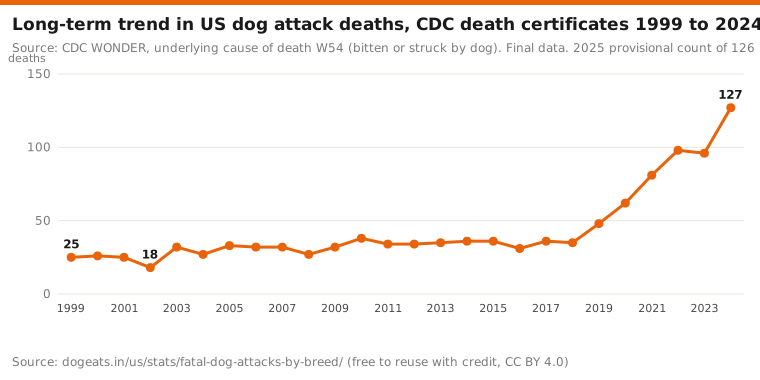
- Annual deaths averaged 31.0 a year from 1999 to 2017. They then climbed from 35 in 2018 to 127 in 2024, about 4.1 times that average.
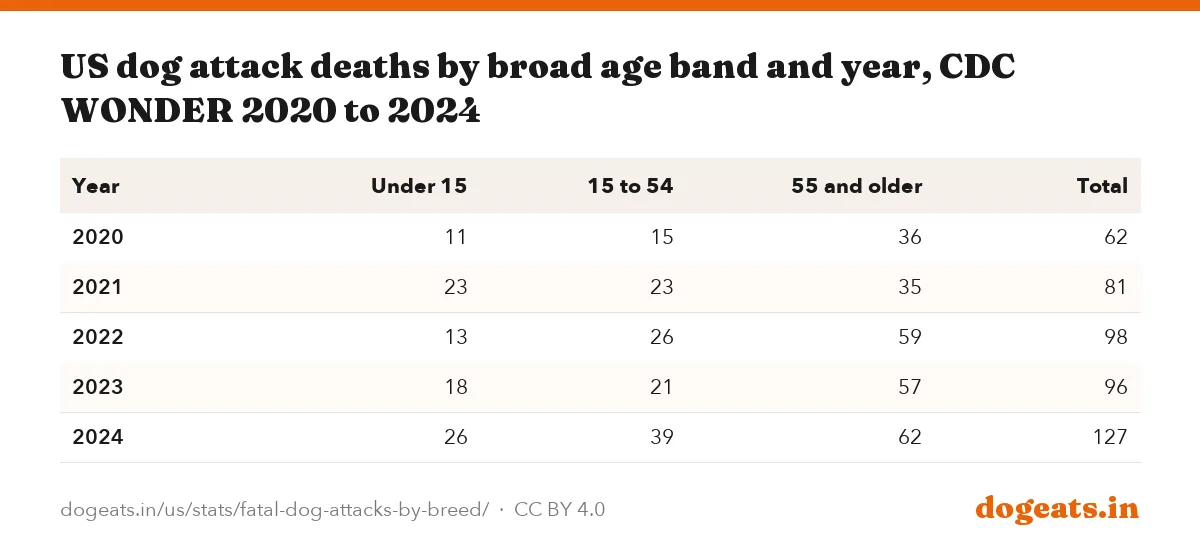
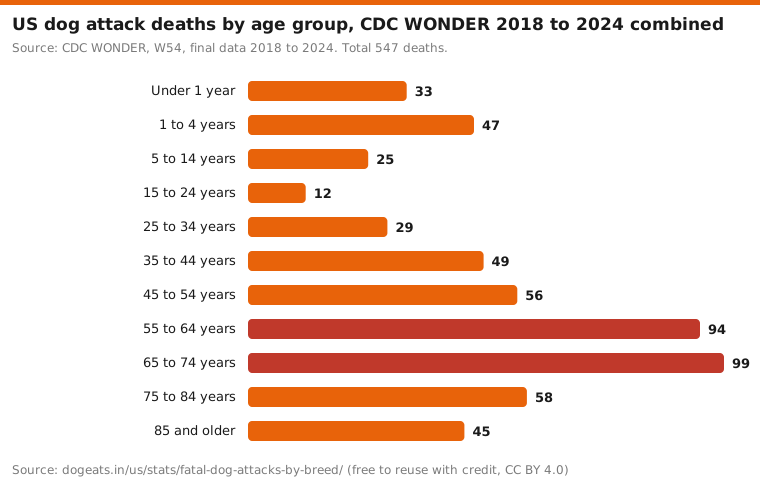
- People aged 55 and older accounted for 296 of the 547 deaths from 2018 to 2024, or 54.1%, while children under 15 accounted for 105, or 19.2%.
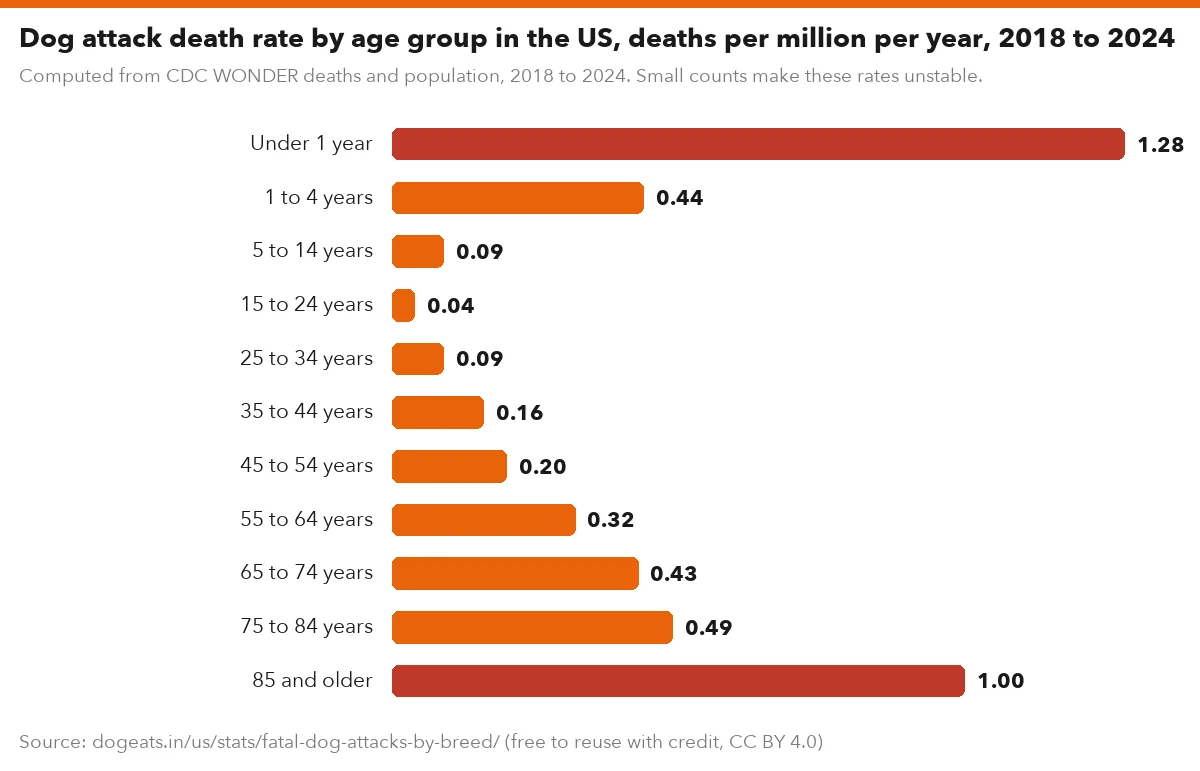
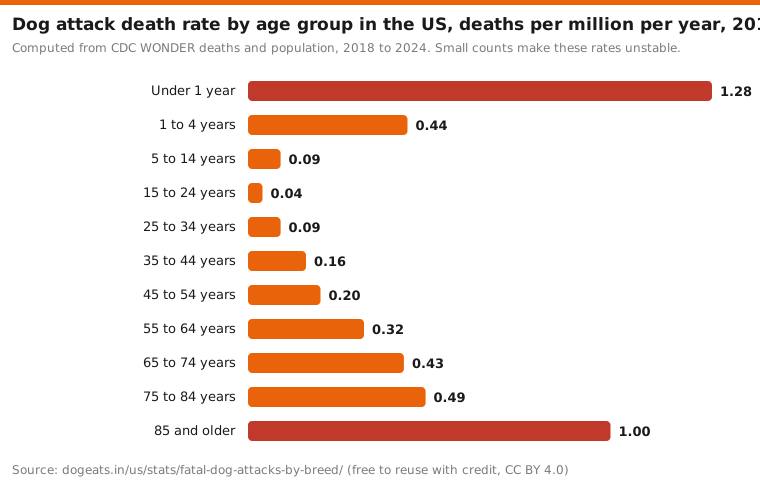
- Infants under 1 year had the highest death rate of any age group, at 1.28 deaths per million per year, followed by adults 85 and older at 1.00.
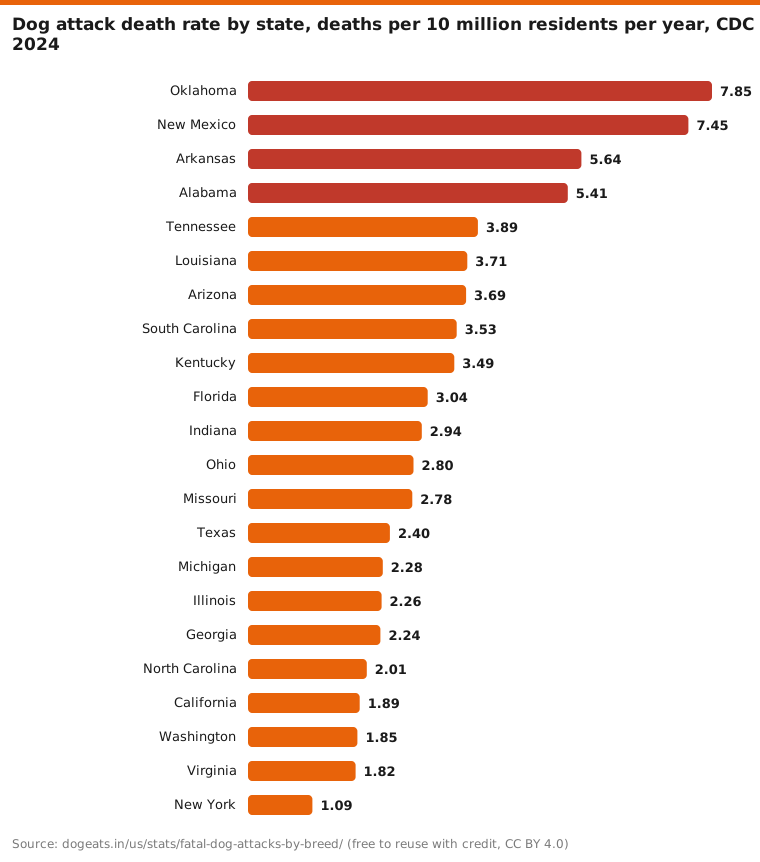
- Oklahoma had the highest rate among the 22 states with 10 or more deaths, at 7.85 deaths per 10 million residents per year, against 2.35 nationally.
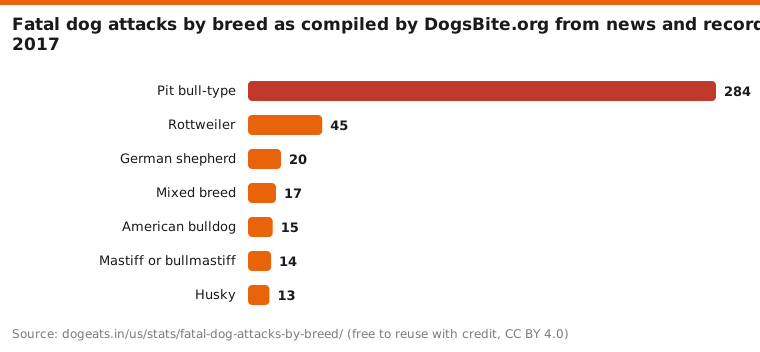
- No federal data set records dog breed; DogsBite.org, an advocacy group focused on pit bulls, attributed 284 of 433 deaths from 2005 to 2017 to pit bull-type dogs.
- A 2013 JAVMA study of 256 fatal attacks could validly determine breed in only 45 cases, and media and animal control reports disagreed on breed for 40.2% of dogs.
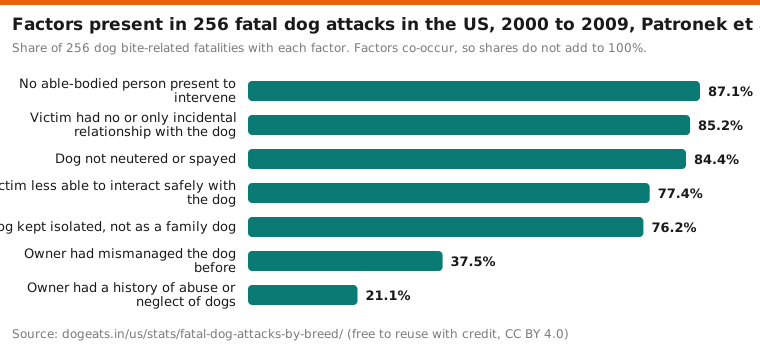
- Four or more preventable factors, such as no able-bodied person present and an unneutered dog, co-occurred in 80.5% of the 256 deaths in that study.
- Counts differ by source: in 2023 CDC recorded 96 deaths and DogsBite.org recorded 63, a gap of 33 deaths.
How many people die from dog attacks each year in the US?
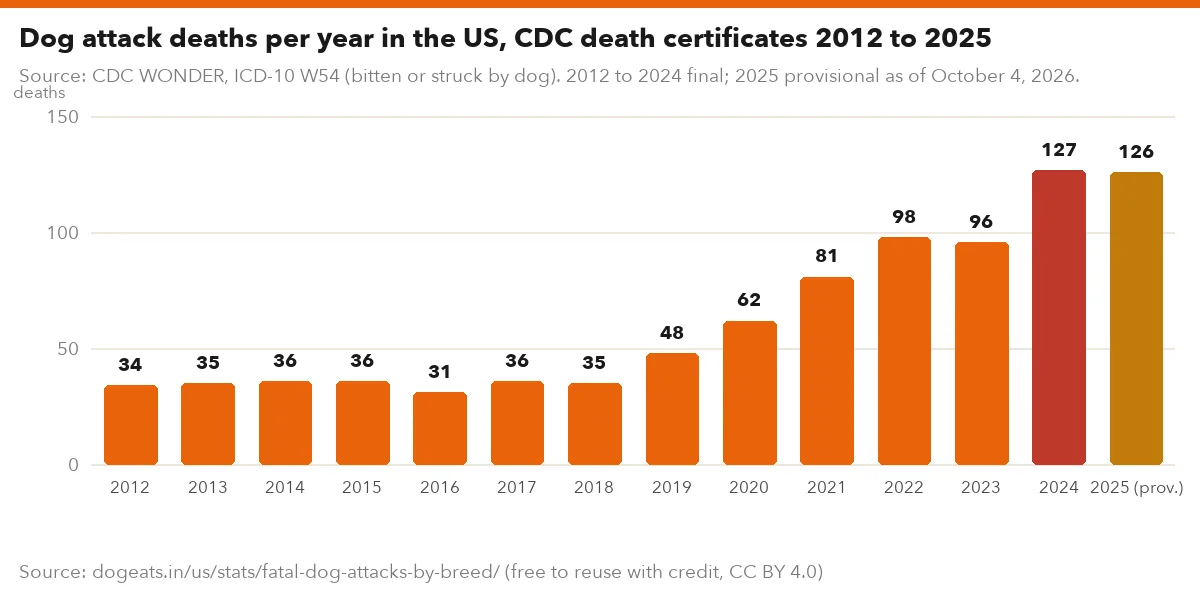
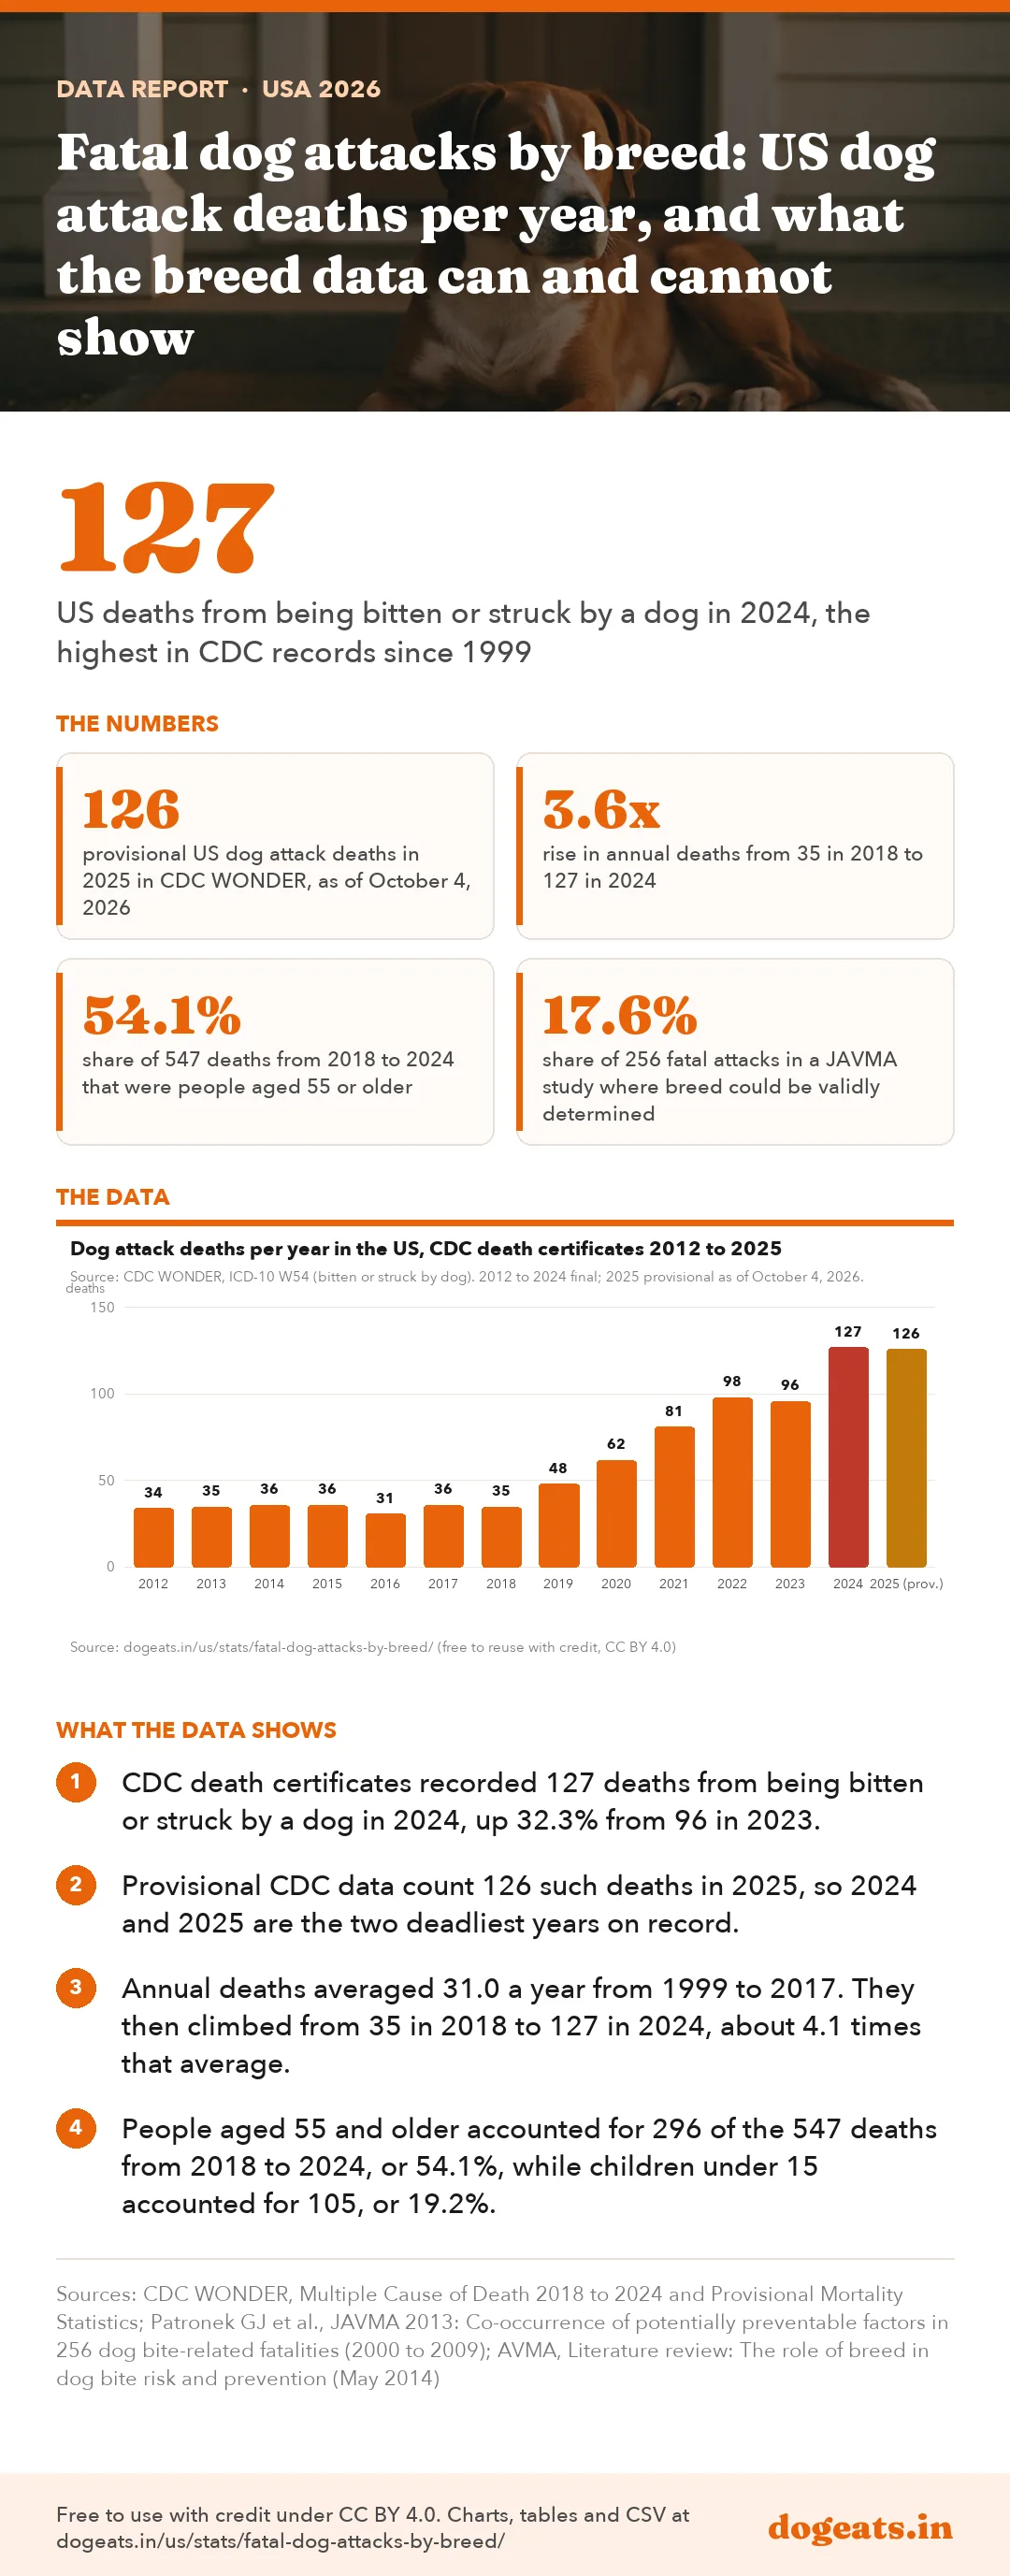
Dogs killed 127 people in the United States in 2024, according to CDC death certificate data. That is the highest annual count in the CDC's ICD-10 records, which start in 1999.
Provisional CDC data show 126 deaths in 2025, as of an October 4, 2026 update. Provisional counts can still change, and injury deaths are often added late.
The CDC counts these deaths under code W54, being bitten or struck by a dog. It includes people knocked down by a dog, not only bites, and it excludes rabies deaths.
Source: CDC WONDER, ICD-10 W54 (bitten or struck by dog). 2012 to 2024 final; 2025 provisional as of October 4, 2026.
Show the numbers
| Label | deaths |
|---|---|
| 2012 | 34 |
| 2013 | 35 |
| 2014 | 36 |
| 2015 | 36 |
| 2016 | 31 |
| 2017 | 36 |
| 2018 | 35 |
| 2019 | 48 |
| 2020 | 62 |
| 2021 | 81 |
| 2022 | 98 |
| 2023 | 96 |
| 2024 | 127 |
| 2025 (prov.) | 126 |
Embed this chart
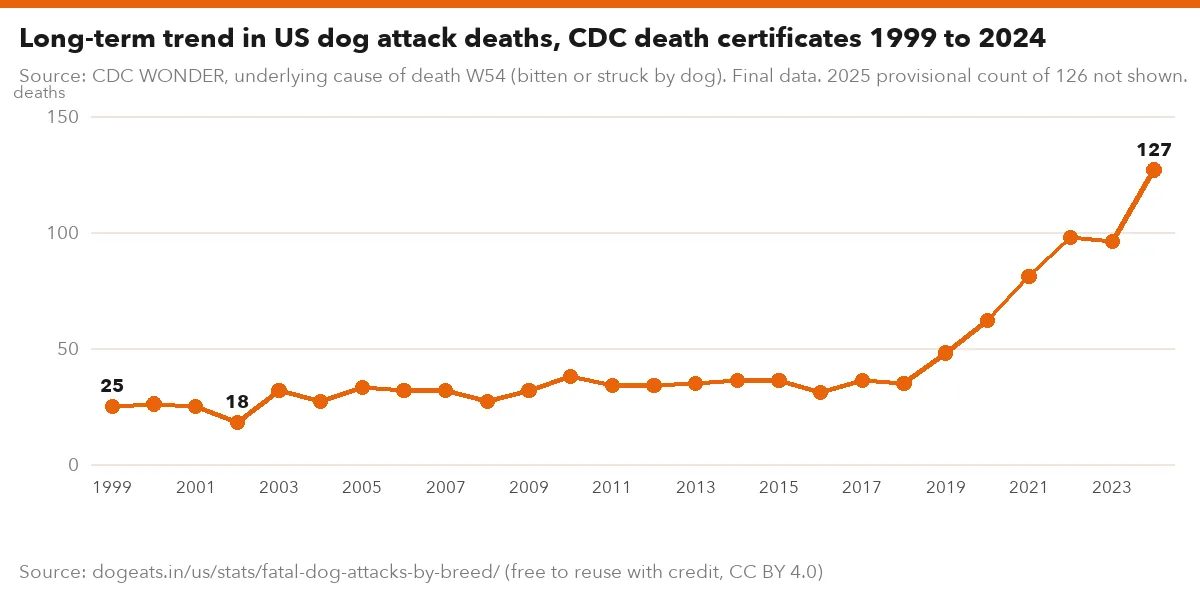
Source: CDC WONDER, underlying cause of death W54 (bitten or struck by dog). Final data. 2025 provisional count of 126 not shown.
Show the numbers
| Label | deaths |
|---|---|
| 1999 | 25 |
| 2000 | 26 |
| 2001 | 25 |
| 2002 | 18 |
| 2003 | 32 |
| 2004 | 27 |
| 2005 | 33 |
| 2006 | 32 |
| 2007 | 32 |
| 2008 | 27 |
| 2009 | 32 |
| 2010 | 38 |
| 2011 | 34 |
| 2012 | 34 |
| 2013 | 35 |
| 2014 | 36 |
| 2015 | 36 |
| 2016 | 31 |
| 2017 | 36 |
| 2018 | 35 |
| 2019 | 48 |
| 2020 | 62 |
| 2021 | 81 |
| 2022 | 98 |
| 2023 | 96 |
| 2024 | 127 |
Embed this chart
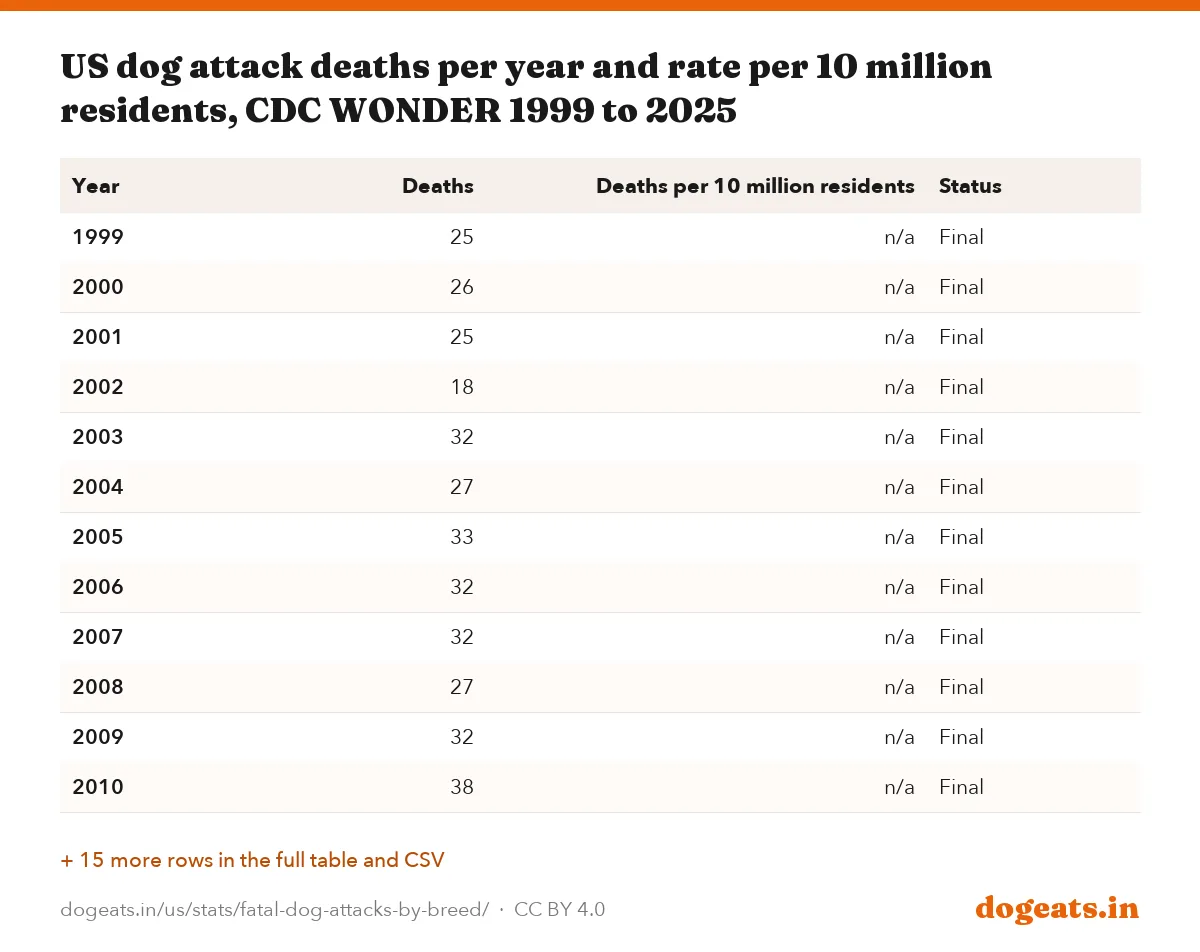
| Year | Deaths | Deaths per 10 million residents | Status |
|---|---|---|---|
| 1999 | 25 | n/a | Final |
| 2000 | 26 | n/a | Final |
| 2001 | 25 | n/a | Final |
| 2002 | 18 | n/a | Final |
| 2003 | 32 | n/a | Final |
| 2004 | 27 | n/a | Final |
| 2005 | 33 | n/a | Final |
| 2006 | 32 | n/a | Final |
| 2007 | 32 | n/a | Final |
| 2008 | 27 | n/a | Final |
| 2009 | 32 | n/a | Final |
| 2010 | 38 | n/a | Final |
| 2011 | 34 | n/a | Final |
| 2012 | 34 | n/a | Final |
| 2013 | 35 | n/a | Final |
| 2014 | 36 | n/a | Final |
| 2015 | 36 | n/a | Final |
| 2016 | 31 | n/a | Final |
| 2017 | 36 | n/a | Final |
| 2018 | 35 | 1.07 | Final |
| 2019 | 48 | 1.46 | Final |
| 2020 | 62 | 1.88 | Final |
| 2021 | 81 | 2.44 | Final |
| 2022 | 98 | 2.94 | Final |
| 2023 | 96 | 2.87 | Final |
| 2024 | 127 | 3.73 | Final |
| 2025 | 126 | n/a | Provisional |
Deaths held between 18 and 38 a year from 1999 to 2017. The lowest year was 2002, with 18 deaths, and the highest in that span was 2010, with 38.
The climb began in 2019. Deaths went from 35 in 2018 to 48 in 2019, 62 in 2020, 81 in 2021 and 98 in 2022.
There was one dip, to 96 in 2023, before the jump to 127 in 2024. The rate rose from 1.07 to 3.73 deaths per 10 million residents between 2018 and 2024.
The CDC's own MMWR QuickStats, published in September 2023, counted 468 deaths from 2011 to 2021, an average of 43 a year. Our query returns the same 468.
The 2026 count so far is 26, but that figure is partial and covers deaths through September 26, 2026. It should not be compared with full years.
Who dies in fatal dog attacks: older adults now outnumber children
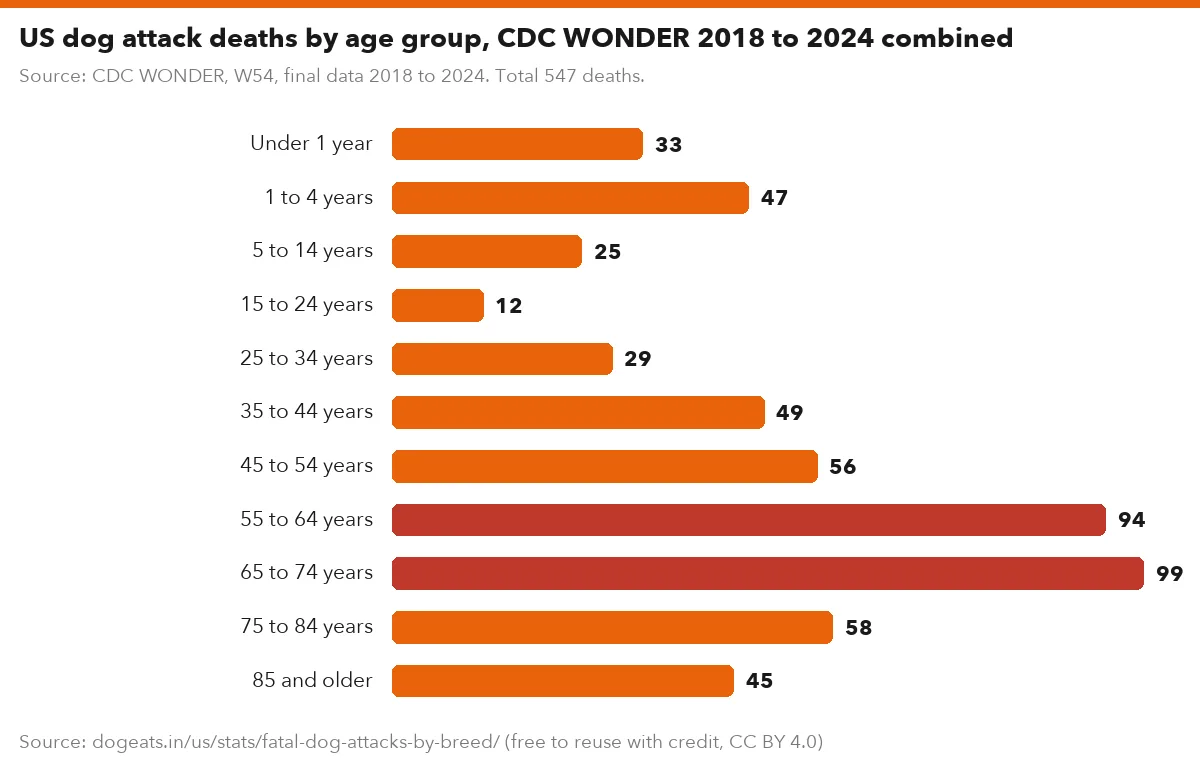
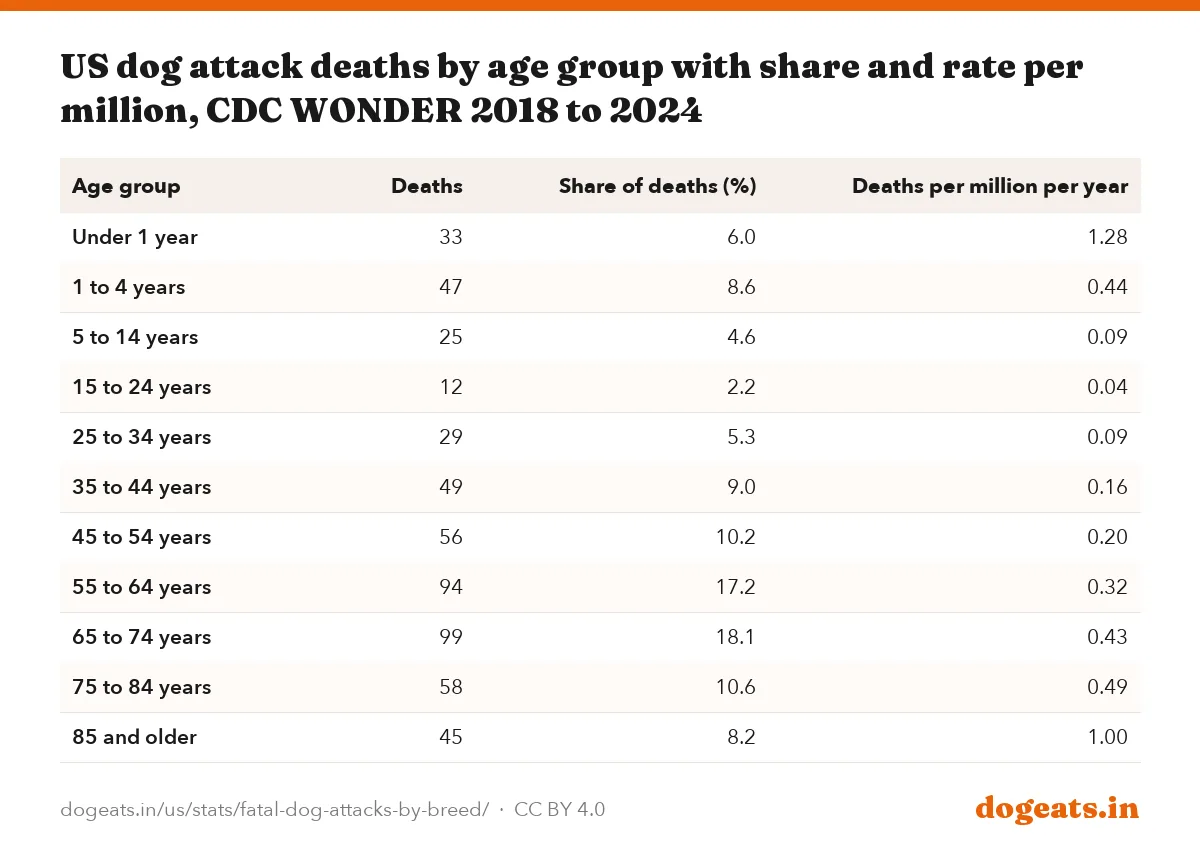
Most people killed by dogs in recent years were adults, not children. From 2018 to 2024, people aged 55 and older made up 296 of 547 deaths, or 54.1%.
Children under 15 accounted for 105 deaths, or 19.2%. Adults aged 15 to 54 accounted for the remaining 146, or 26.7%.
Counts and rates tell different stories. Babies under 1 year died at the highest rate, 1.28 per million per year, because there are far fewer of them in the population.

Source: CDC WONDER, W54, final data 2018 to 2024. Total 547 deaths.
Show the numbers
| Label | deaths |
|---|---|
| Under 1 year | 33 |
| 1 to 4 years | 47 |
| 5 to 14 years | 25 |
| 15 to 24 years | 12 |
| 25 to 34 years | 29 |
| 35 to 44 years | 49 |
| 45 to 54 years | 56 |
| 55 to 64 years | 94 |
| 65 to 74 years | 99 |
| 75 to 84 years | 58 |
| 85 and older | 45 |
Embed this chart
Computed from CDC WONDER deaths and population, 2018 to 2024. Small counts make these rates unstable.
Show the numbers
| Label | per million |
|---|---|
| Under 1 year | 1.28 |
| 1 to 4 years | 0.44 |
| 5 to 14 years | 0.09 |
| 15 to 24 years | 0.04 |
| 25 to 34 years | 0.09 |
| 35 to 44 years | 0.16 |
| 45 to 54 years | 0.20 |
| 55 to 64 years | 0.32 |
| 65 to 74 years | 0.43 |
| 75 to 84 years | 0.49 |
| 85 and older | 1.00 |
Embed this chart
| Age group | Deaths | Share of deaths (%) | Deaths per million per year |
|---|---|---|---|
| Under 1 year | 33 | 6.0 | 1.28 |
| 1 to 4 years | 47 | 8.6 | 0.44 |
| 5 to 14 years | 25 | 4.6 | 0.09 |
| 15 to 24 years | 12 | 2.2 | 0.04 |
| 25 to 34 years | 29 | 5.3 | 0.09 |
| 35 to 44 years | 49 | 9.0 | 0.16 |
| 45 to 54 years | 56 | 10.2 | 0.20 |
| 55 to 64 years | 94 | 17.2 | 0.32 |
| 65 to 74 years | 99 | 18.1 | 0.43 |
| 75 to 84 years | 58 | 10.6 | 0.49 |
| 85 and older | 45 | 8.2 | 1.00 |
| Year | Under 15 | 15 to 54 | 55 and older | Total |
|---|---|---|---|---|
| 2020 | 11 | 15 | 36 | 62 |
| 2021 | 23 | 23 | 35 | 81 |
| 2022 | 13 | 26 | 59 | 98 |
| 2023 | 18 | 21 | 57 | 96 |
| 2024 | 26 | 39 | 62 | 127 |
| Year | Female | Male | Total |
|---|---|---|---|
| 2018 | 20 | 15 | 35 |
| 2019 | 29 | 19 | 48 |
| 2020 | 37 | 25 | 62 |
| 2021 | 44 | 37 | 81 |
| 2022 | 57 | 41 | 98 |
| 2023 | 42 | 54 | 96 |
| 2024 | 60 | 67 | 127 |
| 2025 (provisional) | 61 | 65 | 126 |
The 65 to 74 age group had the most deaths of any 10-year band, with 99. The 55 to 64 group was close behind with 94.
Deaths among people 55 and older rose from 20 in 2018 to 62 in 2024. Deaths among children under 15 ranged from 11 to 26 a year between 2020 and 2024.
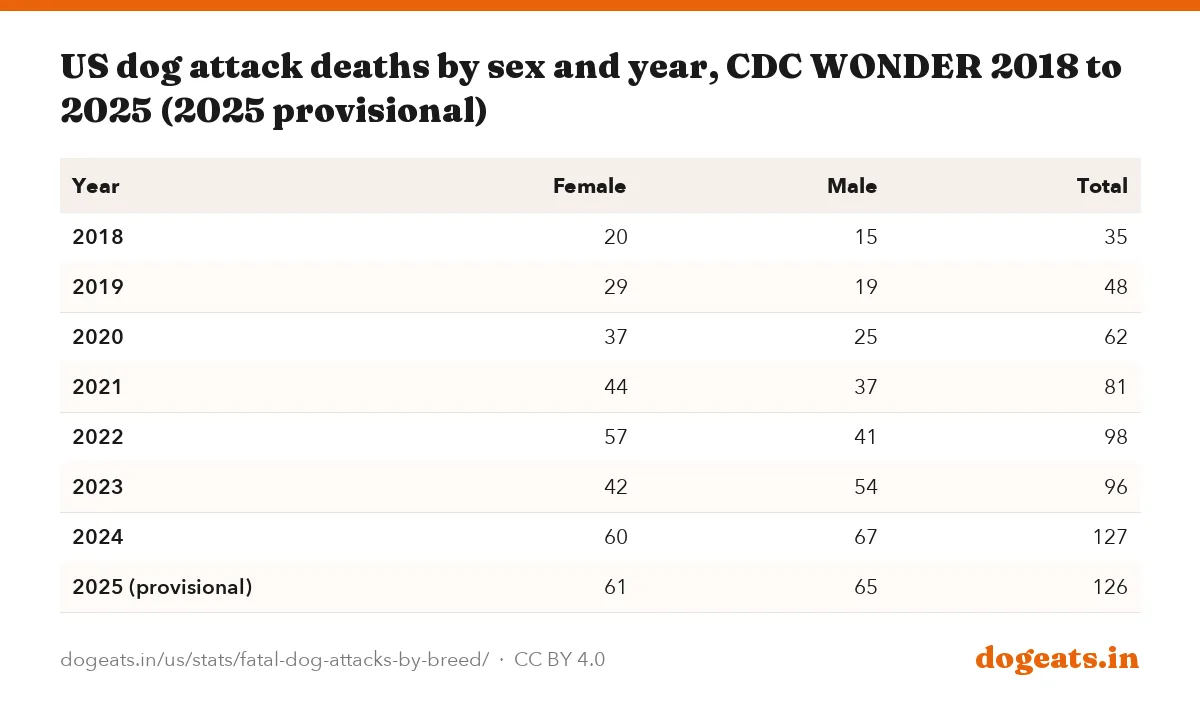
Women and girls made up 289 of the 547 deaths from 2018 to 2024, or 52.8%. In 2024 the split was 67 male and 60 female deaths.
CDC hides counts below 10 in its tables, so some years and age groups are blank. For 2018 and 2019, the under-15 count was below 10 in each year.
Fatal dog attacks by state, 2018 to 2024
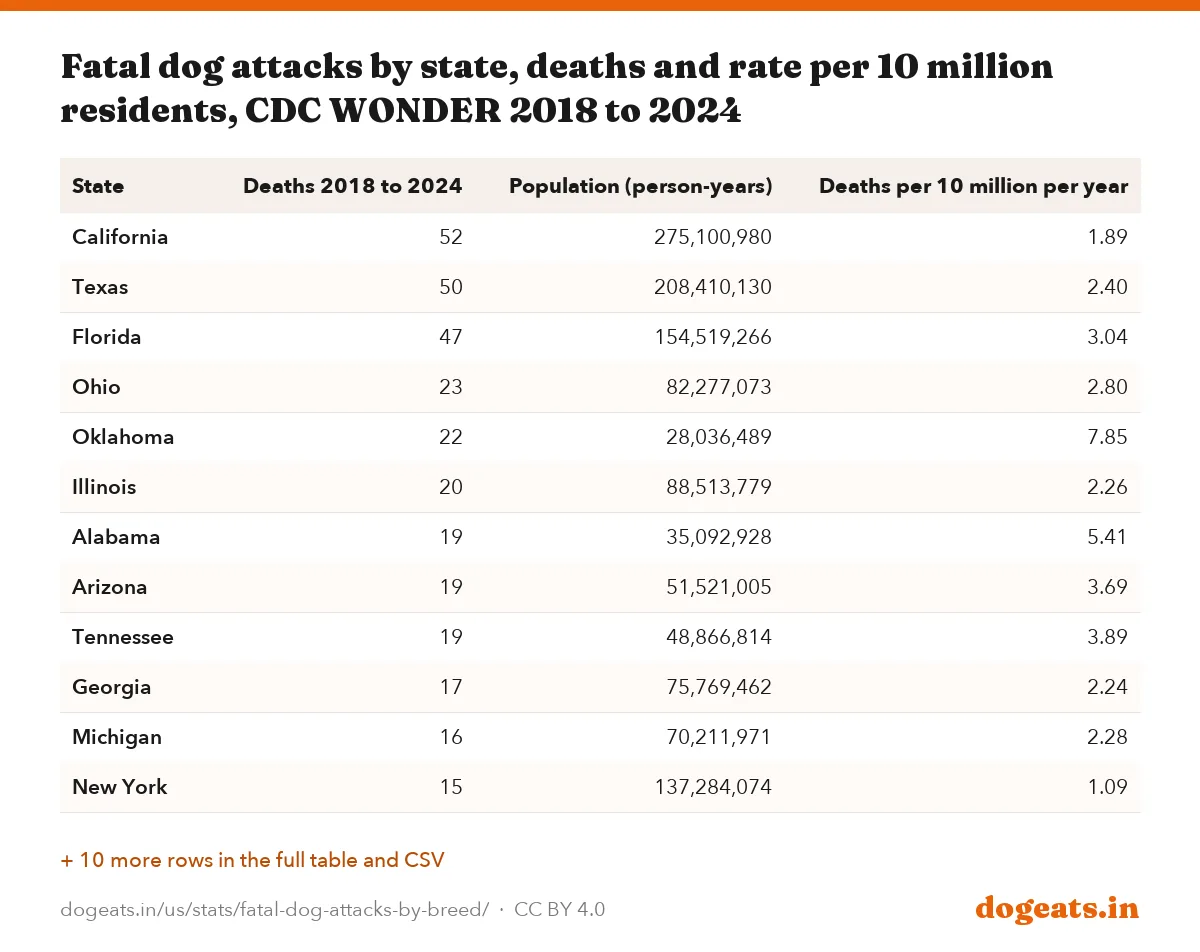
California had the most dog attack deaths from 2018 to 2024, with 52. Texas had 50 and Florida had 47, together 149 deaths, or 27.2% of the national total.
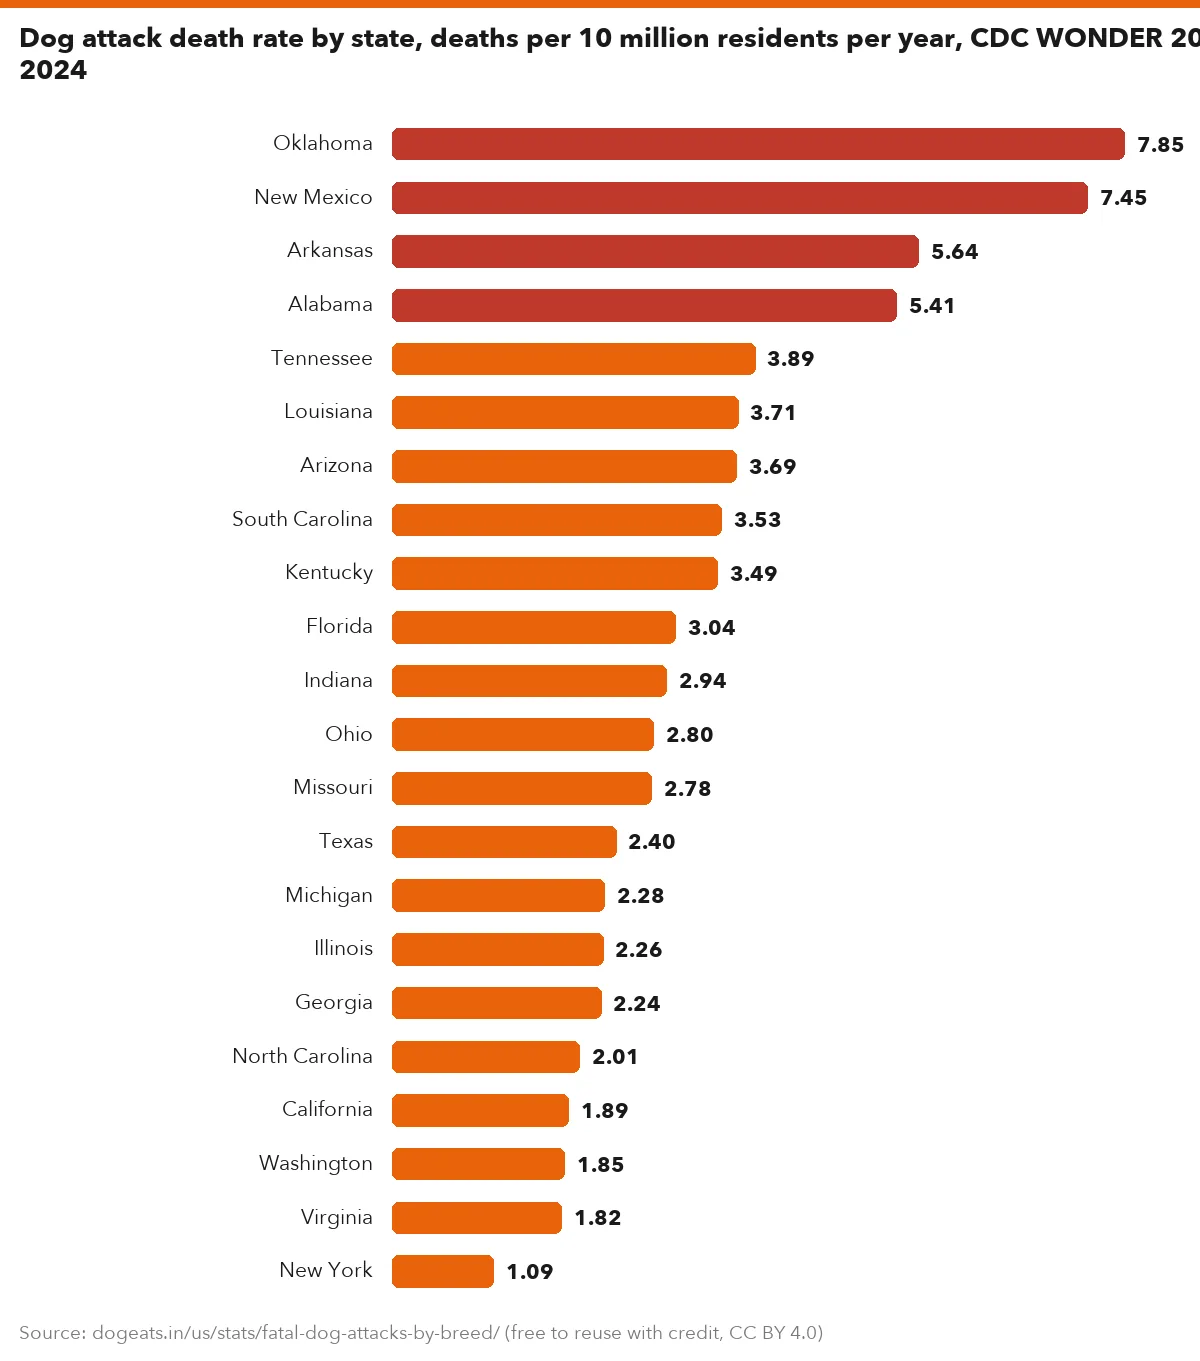
Per resident, the picture changes. Oklahoma had 22 deaths, a rate of 7.85 per 10 million residents per year, the highest of the 22 states with enough deaths to report.
New Mexico was second at 7.45, then Arkansas at 5.64 and Alabama at 5.41. The national rate over the same seven years was 2.35.
Only the 22 states with 10 or more deaths are shown; CDC suppresses smaller counts. Rates computed from CDC deaths and population.
Show the numbers
| Label | per 10 million |
|---|---|
| Oklahoma | 7.85 |
| New Mexico | 7.45 |
| Arkansas | 5.64 |
| Alabama | 5.41 |
| Tennessee | 3.89 |
| Louisiana | 3.71 |
| Arizona | 3.69 |
| South Carolina | 3.53 |
| Kentucky | 3.49 |
| Florida | 3.04 |
| Indiana | 2.94 |
| Ohio | 2.80 |
| Missouri | 2.78 |
| Texas | 2.40 |
| Michigan | 2.28 |
| Illinois | 2.26 |
| Georgia | 2.24 |
| North Carolina | 2.01 |
| California | 1.89 |
| Washington | 1.85 |
| Virginia | 1.82 |
| New York | 1.09 |
Embed this chart
| State | Deaths 2018 to 2024 | Population (person-years) | Deaths per 10 million per year |
|---|---|---|---|
| California | 52 | 275,100,980 | 1.89 |
| Texas | 50 | 208,410,130 | 2.40 |
| Florida | 47 | 154,519,266 | 3.04 |
| Ohio | 23 | 82,277,073 | 2.80 |
| Oklahoma | 22 | 28,036,489 | 7.85 |
| Illinois | 20 | 88,513,779 | 2.26 |
| Alabama | 19 | 35,092,928 | 5.41 |
| Arizona | 19 | 51,521,005 | 3.69 |
| Tennessee | 19 | 48,866,814 | 3.89 |
| Georgia | 17 | 75,769,462 | 2.24 |
| Michigan | 16 | 70,211,971 | 2.28 |
| New York | 15 | 137,284,074 | 1.09 |
| North Carolina | 15 | 74,604,177 | 2.01 |
| Indiana | 14 | 47,604,546 | 2.94 |
| South Carolina | 13 | 36,776,606 | 3.53 |
| Arkansas | 12 | 21,289,765 | 5.64 |
| Louisiana | 12 | 32,339,867 | 3.71 |
| Missouri | 12 | 43,203,194 | 2.78 |
| Kentucky | 11 | 31,549,556 | 3.49 |
| New Mexico | 11 | 14,772,424 | 7.45 |
| Virginia | 11 | 60,496,553 | 1.82 |
| Washington | 10 | 54,139,634 | 1.85 |
These 22 states account for 440 of the 547 deaths, or 80.4%. The other 28 states and the District of Columbia each had fewer than 10 deaths, so CDC does not publish their counts.
New York had 15 deaths but the lowest rate on the list, 1.09 per 10 million. California's rate was 1.89, below the national figure despite its top count.
State rates rest on small numbers. One or two extra deaths can move a small state several places, so read the ranking as a rough guide.
What breeds are involved in fatal dog attacks?
No official US source records the breed of dog in a fatal attack. CDC death certificates code the cause of death, not the dog.
Breed counts come from groups that compile news reports, police records and court filings. The best known is DogsBite.org, which describes itself as a public education website about dangerous dog breeds, chiefly pit bulls.
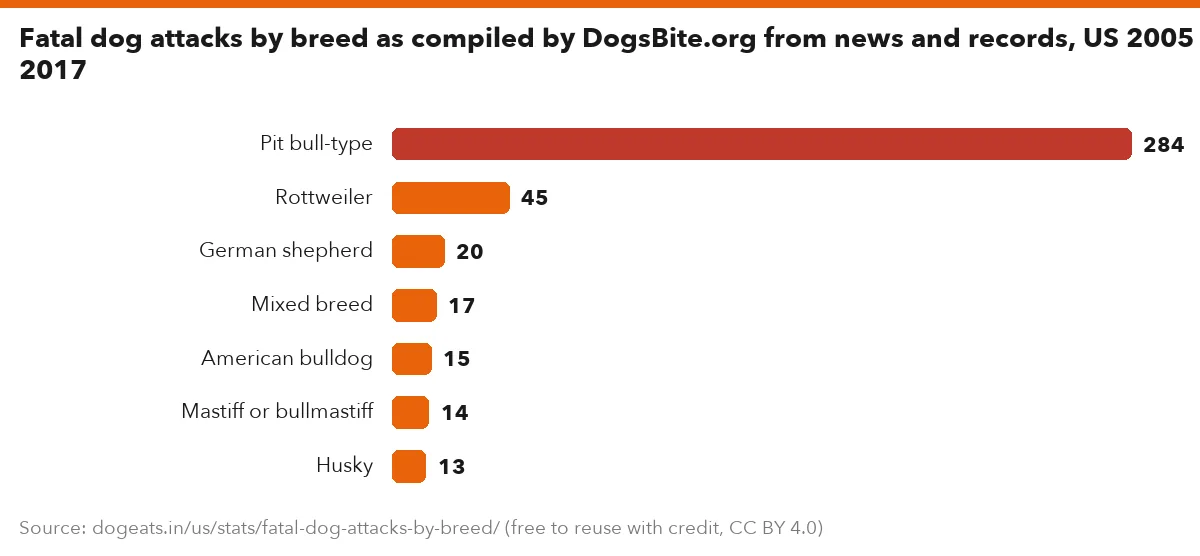
DogsBite.org's 13-year report counted 433 deaths from 2005 to 2017. It attributed 284, or 65.6%, to pit bull-type dogs and 45, or 10.4%, to Rottweilers.
Advocacy data, not official. DogsBite.org counts; 9.5% of attacks involved more than one breed, so breed totals exceed the 433 deaths. Breeds with fewer than 13 deaths not shown.
Show the numbers
| Label | deaths |
|---|---|
| Pit bull-type | 284 |
| Rottweiler | 45 |
| German shepherd | 20 |
| Mixed breed | 17 |
| American bulldog | 15 |
| Mastiff or bullmastiff | 14 |
| Husky | 13 |
Embed this chart
German shepherds were next with 20 deaths, then mixed breeds with 17, American bulldogs with 15, mastiffs or bullmastiffs with 14 and huskies with 13.
For 2005 to 2019, DogsBite.org reports 522 deaths, with pit bulls contributing to 345, or 66%. Its fatalities page, last updated June 10, 2026, listed 2024 deaths as still under review.
The last CDC breed study covered 1979 to 1998. Using news accounts and a Humane Society registry, it found at least 25 breeds involved in 238 deaths, with pit bull-type dogs and Rottweilers in more than half.
That CDC-led study, Sacks et al. in JAVMA in 2000, also warned that breed is hard to determine with certainty. It said fatal attacks should not be the main factor driving dangerous dog policy.
Why breed counts from news reports are disputed
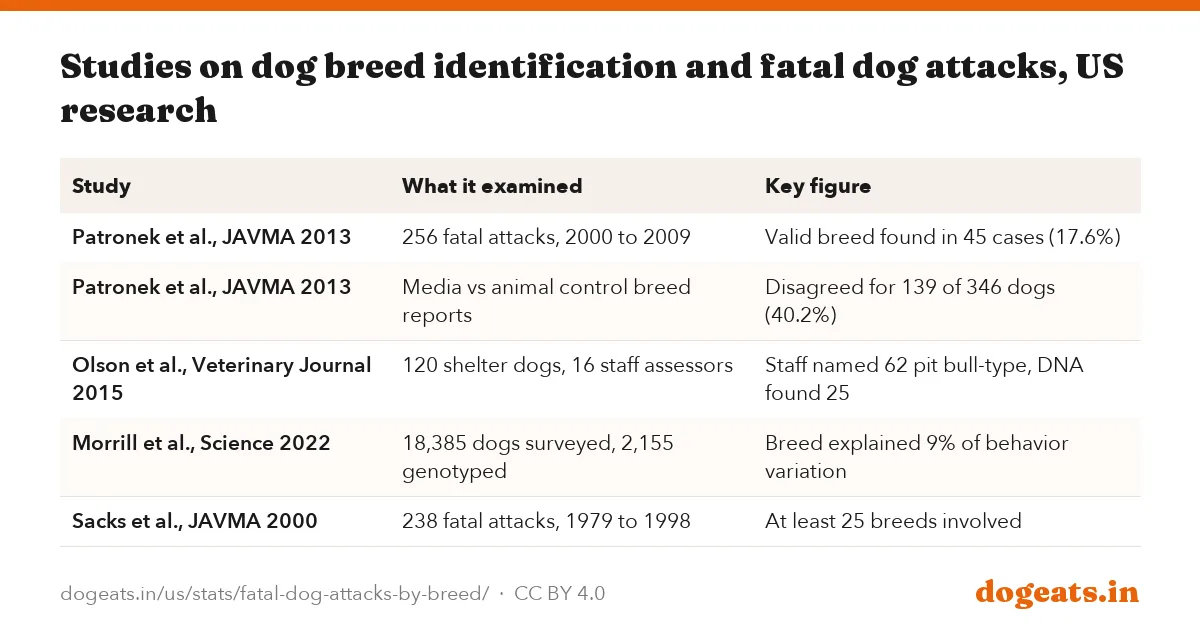
The main problem is identification. A 2013 JAVMA study by Patronek and colleagues reviewed 256 fatal attacks from 2000 to 2009 using police, animal control and investigator records.
It could make a valid breed determination in only 45 cases, or 17.6%. Those 45 cases involved 20 breeds, including 2 known mixes.
Media accounts disagreed with each other on breed for 124 of 401 dogs, or 30.9%. Media and animal control reports disagreed for 139 of 346 dogs, or 40.2%.
| Study | What it examined | Key figure |
|---|---|---|
| Patronek et al., JAVMA 2013 | 256 fatal attacks, 2000 to 2009 | Valid breed found in 45 cases (17.6%) |
| Patronek et al., JAVMA 2013 | Media vs animal control breed reports | Disagreed for 139 of 346 dogs (40.2%) |
| Olson et al., Veterinary Journal 2015 | 120 shelter dogs, 16 staff assessors | Staff named 62 pit bull-type, DNA found 25 |
| Morrill et al., Science 2022 | 18,385 dogs surveyed, 2,155 genotyped | Breed explained 9% of behavior variation |
| Sacks et al., JAVMA 2000 | 238 fatal attacks, 1979 to 1998 | At least 25 breeds involved |
A 2015 University of Florida study tested shelter staff against DNA. Staff labeled 62 of 120 dogs, or 52%, as pit bull-type, but DNA identified only 25, or 21%.
Staff sensitivity for spotting pit bull-type dogs ranged from 33% to 75%. The authors concluded that visual identification of pit bull-type dogs was unreliable.
A 2022 study in Science surveyed owners of 18,385 dogs and genotyped 2,155. Breed explained just 9% of the variation in individual behavior.
Pit bull attack statistics vs other breeds: what studies show
Research points in two directions. Studies of severe and fatal cases more often identify pit bull-type dogs. Controlled studies have not identified the breed group as disproportionately dangerous.
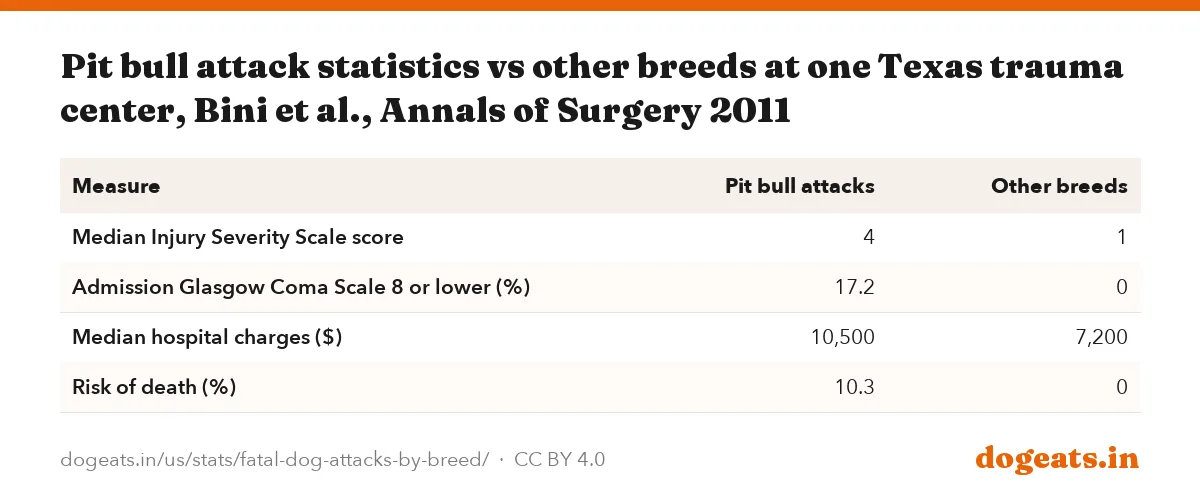
A San Antonio level I trauma center study in the Annals of Surgery in 2011 reviewed 228 dog bite patients over 15 years. Breed was recorded for 82, of whom 29 were injured by pit bulls.
Compared with other breeds, pit bull attacks in that study had a higher death risk, 10.3% against 0%. Median hospital charges were $10,500 against $7,200.
| Measure | Pit bull attacks | Other breeds |
|---|---|---|
| Median Injury Severity Scale score | 4 | 1 |
| Admission Glasgow Coma Scale 8 or lower (%) | 17.2 | 0 |
| Median hospital charges ($) | 10,500 | 7,200 |
| Risk of death (%) | 10.3 | 0 |
- AVMA literature review (May 2014): in the smaller number of very severe or fatal cases, pit bull-type dogs are more frequently identified.
- The same review says this may reflect the breed's local popularity, reporting bias and how owners treat their dogs.
- It adds that controlled studies have not identified pit bull-type dogs as disproportionately dangerous.
- It says it has not been demonstrated that a breed-specific ban reduces the rate or severity of bite injuries in a community.
The trauma study was small. Its pit bull group had 29 patients, so one or two cases change the percentages a lot.
Neither side of the debate has a national breed denominator. Without a count of how many dogs of each breed live in the US, no source can calculate a true death rate by breed.
Rules on breed vary by state and city. Our report on breed-specific laws by state tracks where those rules are allowed or limited.
Death counts differ by source
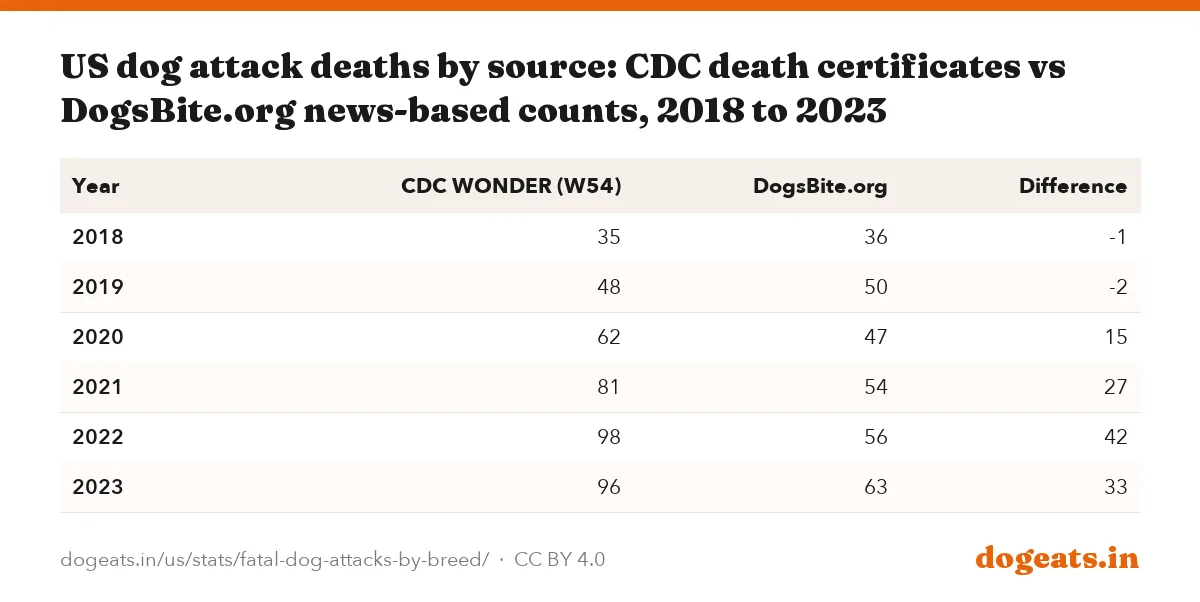
CDC death certificates and news-based counts do not agree. Before 2020 they were close: DogsBite.org counted 433 deaths from 2005 to 2017, and CDC recorded 436.
Since 2020 the gap has widened. In 2022 CDC recorded 98 deaths and DogsBite.org recorded 56. In 2023 the counts were 96 and 63.
The National Canine Research Council, which advocates breed-neutral dog policies, counted 51 deaths in 2021. CDC recorded 81 and DogsBite.org 54.
| Year | CDC WONDER (W54) | DogsBite.org | Difference |
|---|---|---|---|
| 2018 | 35 | 36 | -1 |
| 2019 | 48 | 50 | -2 |
| 2020 | 62 | 47 | 15 |
| 2021 | 81 | 54 | 27 |
| 2022 | 98 | 56 | 42 |
| 2023 | 96 | 63 | 33 |
DogsBite.org links the gap to fewer news reports during and after the Covid period. It says it found 39 previously unreported deaths through records requests and other means since 2011.
Any breed share built on news reports covers only the deaths that made the news. In 2023 DogsBite.org's count of 63 equaled 65.6% of the 96 deaths CDC recorded.
CDC counts can also miss cases.
Factors that show up in most fatal dog attacks
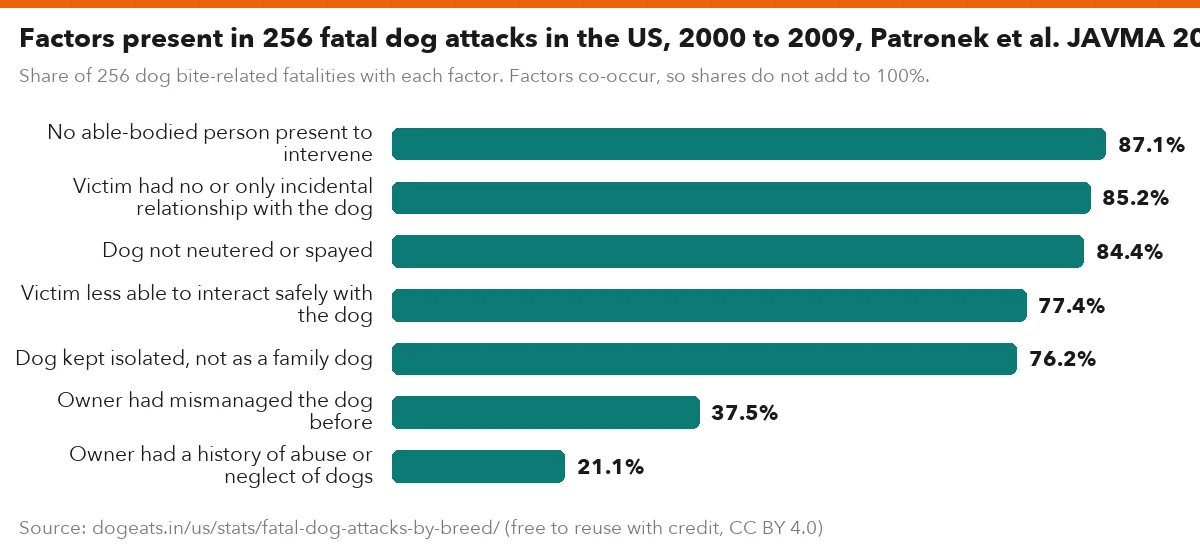
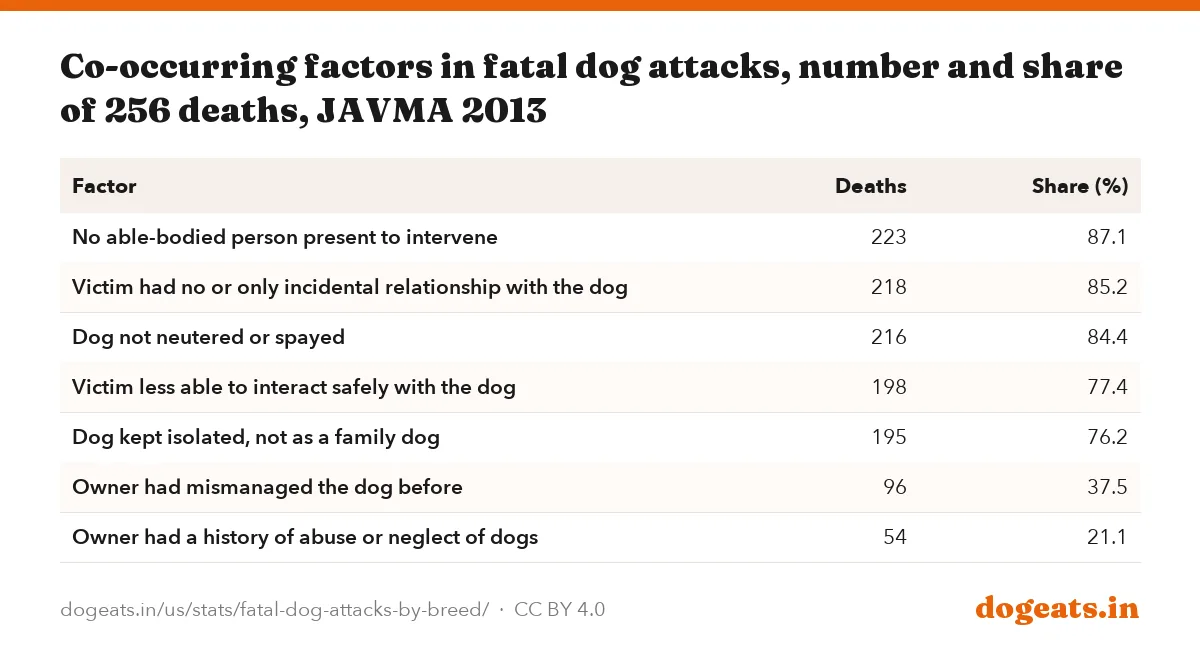
The 2013 JAVMA study looked past breed at the circumstances of each death. In 223 of 256 cases, or 87.1%, no able-bodied person was present to intervene.
In 218 cases, or 85.2%, the victim had no familiar relationship with the dog or only an incidental one. The dog was not neutered in 216 cases, or 84.4%.
Four or more of these factors occurred together in 206 deaths, or 80.5%. The authors concluded that breed was not one of the preventable factors.

Share of 256 dog bite-related fatalities with each factor. Factors co-occur, so shares do not add to 100%.
Show the numbers
| Label | % |
|---|---|
| No able-bodied person present to intervene | 87.1% |
| Victim had no or only incidental relationship with the dog | 85.2% |
| Dog not neutered or spayed | 84.4% |
| Victim less able to interact safely with the dog | 77.4% |
| Dog kept isolated, not as a family dog | 76.2% |
| Owner had mismanaged the dog before | 37.5% |
| Owner had a history of abuse or neglect of dogs | 21.1% |
Embed this chart
| Factor | Deaths | Share (%) |
|---|---|---|
| No able-bodied person present to intervene | 223 | 87.1 |
| Victim had no or only incidental relationship with the dog | 218 | 85.2 |
| Dog not neutered or spayed | 216 | 84.4 |
| Victim less able to interact safely with the dog | 198 | 77.4 |
| Dog kept isolated, not as a family dog | 195 | 76.2 |
| Owner had mismanaged the dog before | 96 | 37.5 |
| Owner had a history of abuse or neglect of dogs | 54 | 21.1 |
Victims had a compromised ability to interact appropriately with the dog in 198 cases, or 77.4%. Dogs were kept isolated rather than as family pets in 195 cases, or 76.2%.
Owners had mismanaged the dog before in 96 cases, or 37.5%. Owners had a history of abuse or neglect of dogs in 54 cases, or 21.1%.
The CDC-led 1979 to 1998 study found a similar pattern on restraint. Of 227 deaths with data, 133, or 58%, involved unrestrained dogs on the owner's property.
Where dog attack victims die
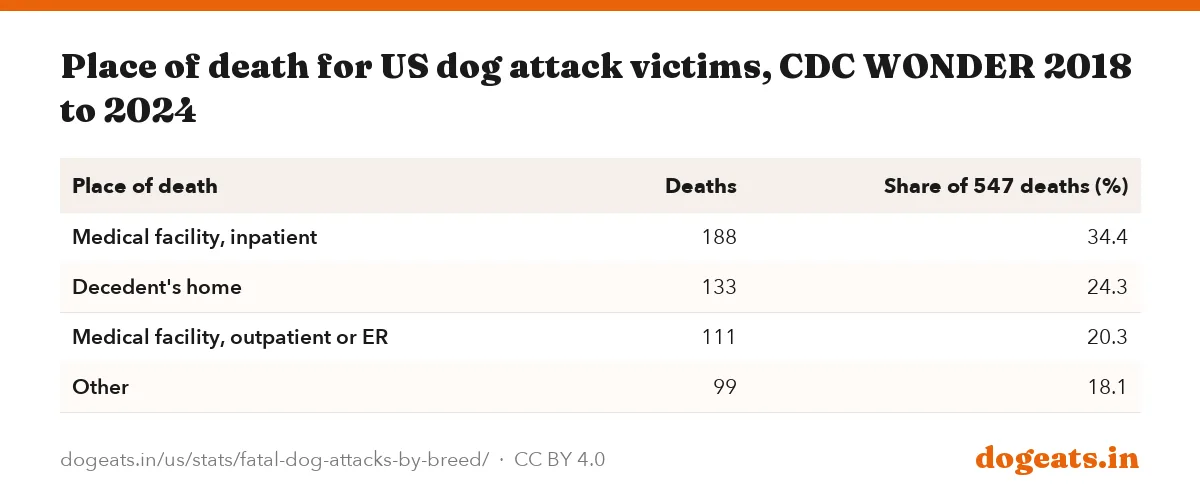
More than half of the people killed by dogs from 2018 to 2024 died in a medical facility. CDC records 188 deaths, or 34.4%, as hospital inpatients and 111, or 20.3%, in an outpatient clinic or emergency room.
Another 133 people, or 24.3%, died at home. CDC lists 99, or 18.1%, under other places, and smaller categories are hidden because they have fewer than 10 deaths.
| Place of death | Deaths | Share of 547 deaths (%) |
|---|---|---|
| Medical facility, inpatient | 188 | 34.4 |
| Decedent's home | 133 | 24.3 |
| Medical facility, outpatient or ER | 111 | 20.3 |
| Other | 99 | 18.1 |
For the wider picture on nonfatal bites, see our dog bite statistics report. It covers insurance claims, emergency room visits and postal worker attacks.
Falls and other injuries involving dogs are a separate and much larger problem. Our report on dog-related injuries covers them.
Frequently asked questions
How many people are killed by dogs each year in the US?
CDC death certificates recorded 127 deaths from being bitten or struck by a dog in 2024, the highest since at least 1999. Provisional data show 126 in 2025. From 1999 to 2017 the average was 31.0 a year.
What dog breed kills the most people?
No official source records breed. DogsBite.org, an advocacy group focused on pit bulls, attributed 284 of 433 deaths from 2005 to 2017 to pit bull-type dogs and 45 to Rottweilers. A 2013 JAVMA study found breed could be validly determined in only 17.6% of 256 fatal attacks.
Are pit bulls more dangerous than other breeds?
The evidence is mixed. A 2011 trauma center study found pit bull attacks more severe, with a 10.3% death risk against 0% for other breeds among 82 patients. AVMA's 2014 review says controlled studies have not identified pit bull-type dogs as disproportionately dangerous.
Who is most likely to be killed by a dog?
By count, older adults: people 55 and older made up 54.1% of the 547 deaths from 2018 to 2024. By rate, infants under 1 year are at highest risk, at 1.28 deaths per million per year, followed by adults 85 and older at 1.00.
Which state has the most fatal dog attacks?
California had the most deaths from 2018 to 2024, with 52, followed by Texas with 50 and Florida with 47. Per resident, Oklahoma ranked first at 7.85 deaths per 10 million residents per year.
Are dog attack deaths increasing?
Yes. Deaths rose from 35 in 2018 to 127 in 2024, about 3.6 times higher. The rate went from 1.07 to 3.73 deaths per 10 million residents. Provisional 2025 data show 126 deaths, close to the 2024 record.
Why do dog attack death counts differ?
CDC counts death certificates coded W54, while groups such as DogsBite.org count deaths reported in the news and records. In 2023 CDC recorded 96 deaths and DogsBite.org recorded 63. The National Canine Research Council counted 51 for 2021, when CDC recorded 81.
Can you tell a dog's breed by looking at it?
Not reliably. In a 2015 study, shelter staff labeled 62 of 120 dogs as pit bull-type, but DNA found only 25. In the 2013 JAVMA study, media and animal control reports disagreed on breed for 40.2% of dogs.
Methodology and limitations
Deaths for 1999 to 2020 come from CDC WONDER's Multiple Cause of Death 1999 to 2020 database. Deaths for 2018 to 2024 come from its Multiple Cause of Death 2018 to 2024 final data. Both use ICD-10 code W54, bitten or struck by dog, as the underlying cause. We ran the queries on October 11, 2026. The overlapping years 2018 to 2020 match exactly.
The 2025 count of 126 and the partial 2026 count of 26 come from CDC WONDER's Provisional Mortality Statistics database. Its October 4, 2026 update covered deaths through September 26, 2026. We label them provisional.
Age, sex, state and place-of-death breakdowns use final 2018 to 2024 data. CDC suppresses counts below 10, so we show only published cells and never derive hidden values. State rates are deaths divided by summed annual population (person-years), times 10 million.
Breed figures come from DogsBite.org's multi-year report and fatality pages, opened October 11, 2026, and are labeled as advocacy data. Study figures come from the published abstracts or full texts of Patronek et al. 2013, Sacks et al. 2000, Bini et al. 2011, Olson et al. 2015 and Morrill et al. 2022, and from AVMA's May 2014 literature review.
Sources
- CDC WONDER, Multiple Cause of Death 2018 to 2024 and Provisional Mortality Statistics, Deaths by year, age, sex, state and place, 2018 to 2024; provisional 2025
- Patronek GJ et al., JAVMA 2013: Co-occurrence of potentially preventable factors in 256 dog bite-related fatalities (2000 to 2009), Breed identification and co-occurring factors
- AVMA, Literature review: The role of breed in dog bite risk and prevention (May 2014), Breed findings, controlled studies, breed bans
- Also consulted: CDC WONDER, Multiple Cause of Death 1999 to 2020 (underlying cause W54), CDC, MMWR QuickStats, September 2023, Sacks JJ et al., JAVMA 2000: Breeds of dogs involved in fatal human attacks, 1979 to 1998, Bini JK et al., Annals of Surgery 2011: Mortality, mauling, and maiming by vicious dogs, Olson KR et al., Veterinary Journal 2015: Inconsistent identification of pit bull-type dogs by shelter staff, Morrill K et al., Science 2022: Ancestry-inclusive dog genomics challenges popular breed stereotypes, DogsBite.org (advocacy group), multi-year fatality report 2005 to 2017, DogsBite.org (advocacy group), US dog bite fatalities by year, DogsBite.org (advocacy group), 2023 Macro-Level Forces Report, June 2025, National Canine Research Council (advocacy group), Report on 2021 dog bite-related fatalities, July 2023.
Cite, embed and download
This report, its data and its images are free to reuse under a Creative Commons Attribution 4.0 licence. Credit dogeats.in with a link to this page. Every chart has its own embed code, every table has a CSV and an image download, and the images below are ready for social posts, slides and articles.
Cite this report
Link to this report
Every chart and table as an image