Data report · Updated October 2026
Dog bite insurance claims by state: homeowners claims, average payouts and state trends
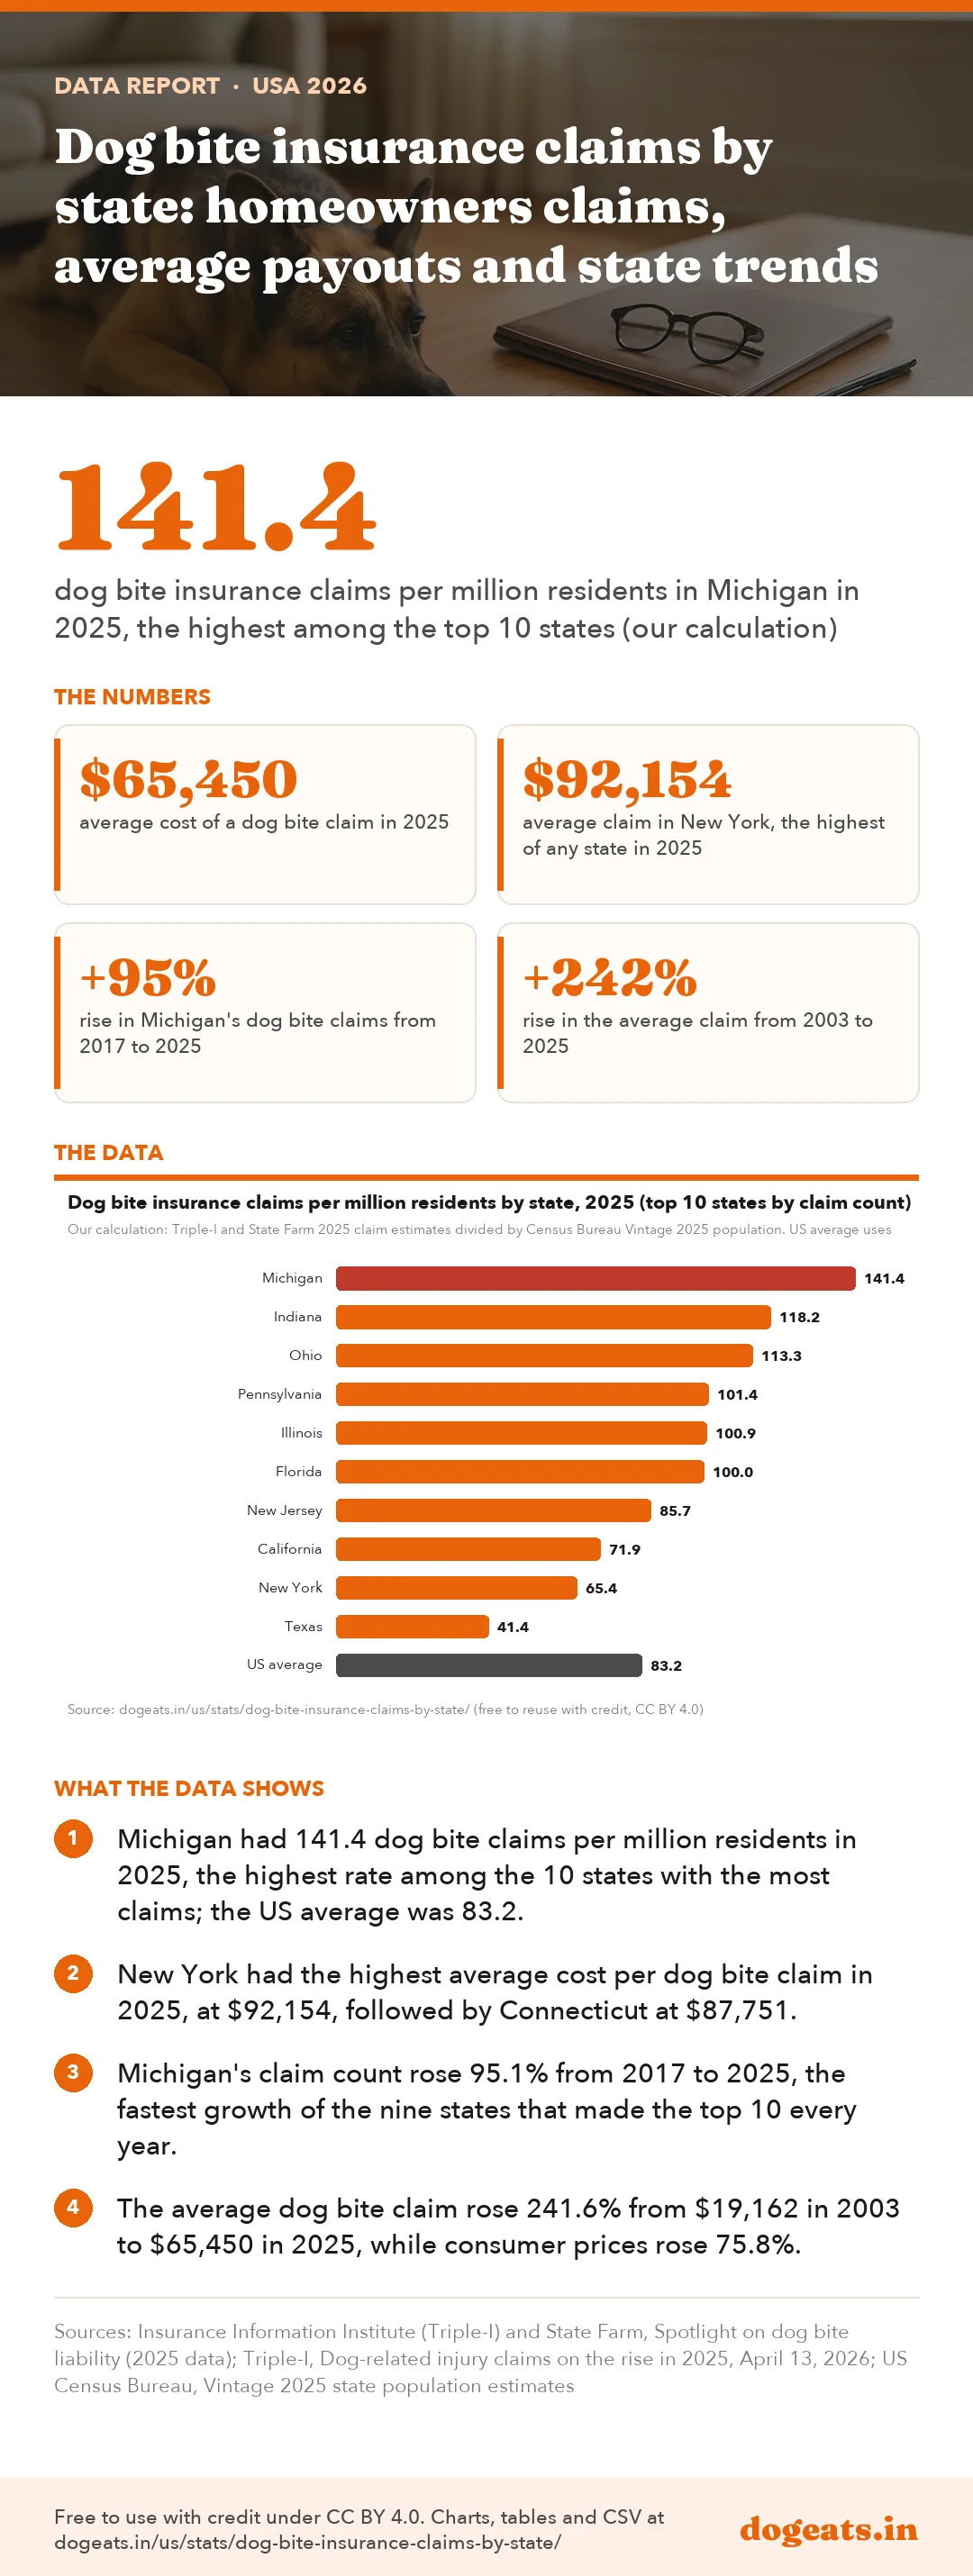
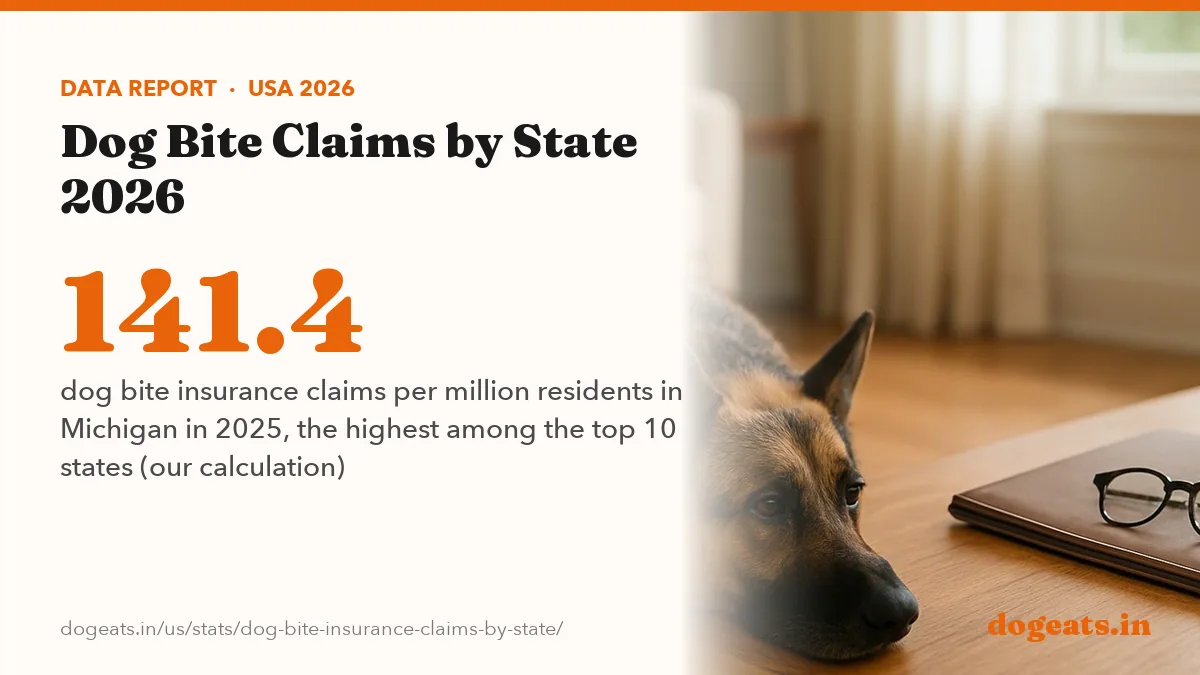
US homeowners insurers paid an estimated $1.86 billion on 28,450 dog bite and dog-related injury claims in 2025, an average of $65,450 per claim, Triple-I and State Farm estimate. California and Florida had the most claims. Per resident, Michigan led the top 10 states with 141.4 claims per million people, by our calculation.

Key findings
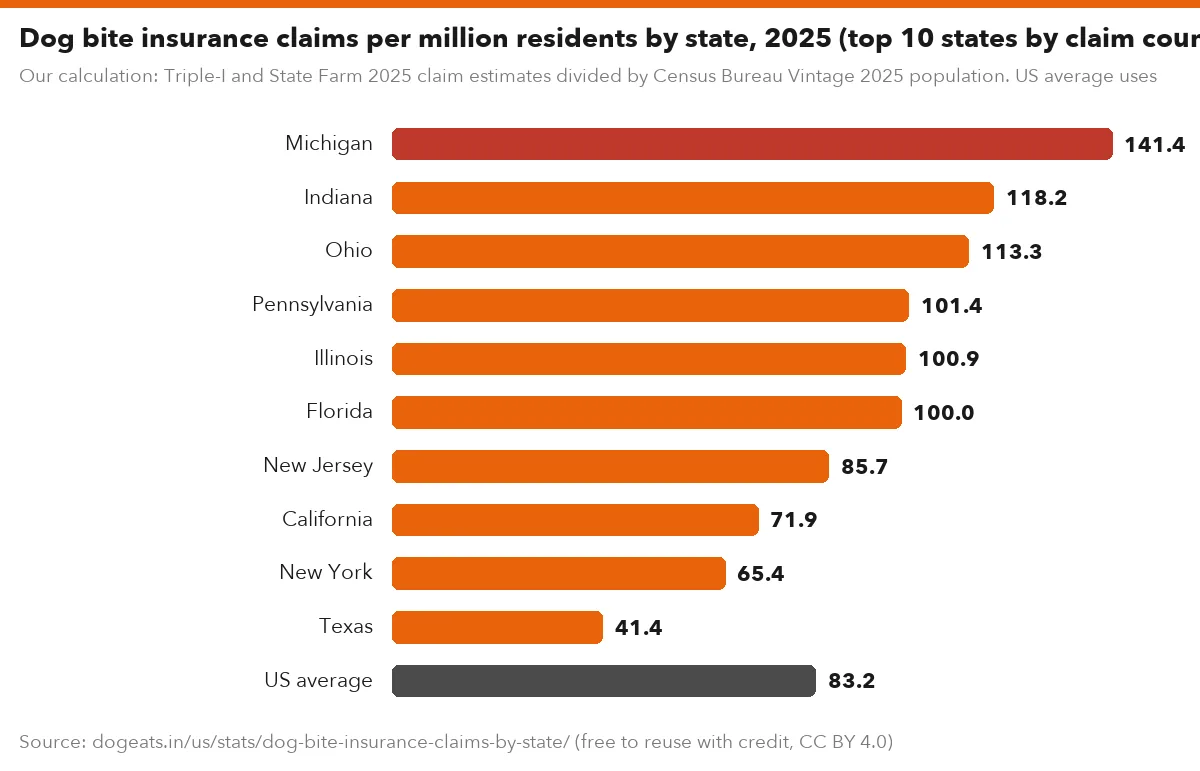
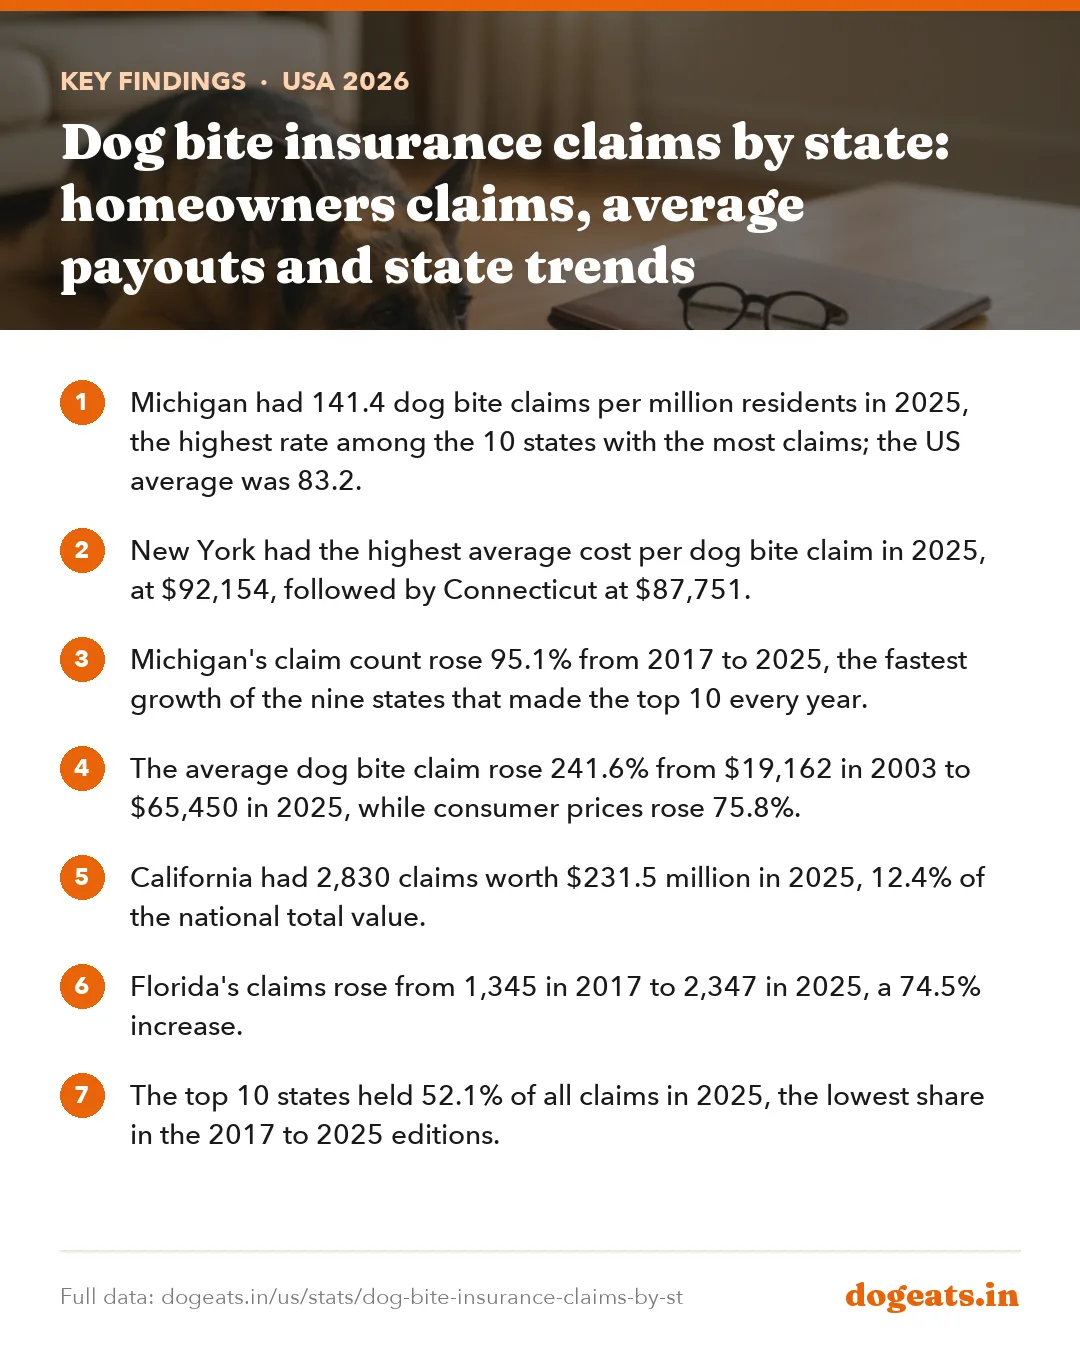
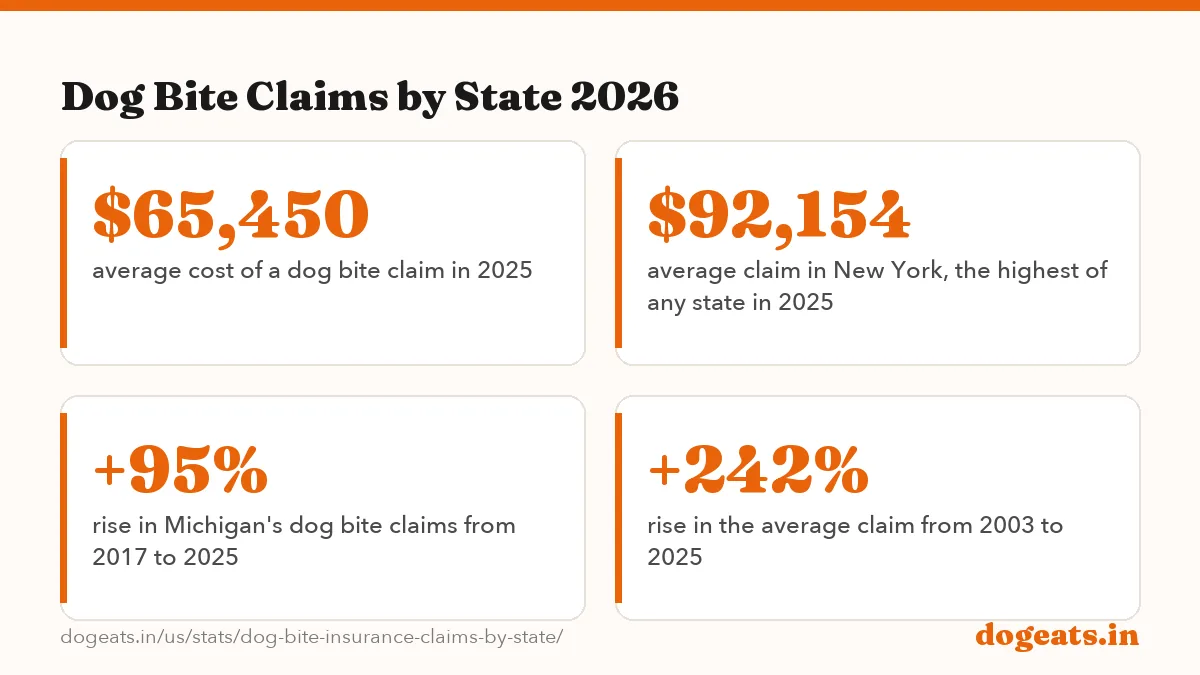
- Michigan had 141.4 dog bite claims per million residents in 2025, the highest rate among the 10 states with the most claims; the US average was 83.2.
- New York had the highest average cost per dog bite claim in 2025, at $92,154, followed by Connecticut at $87,751.
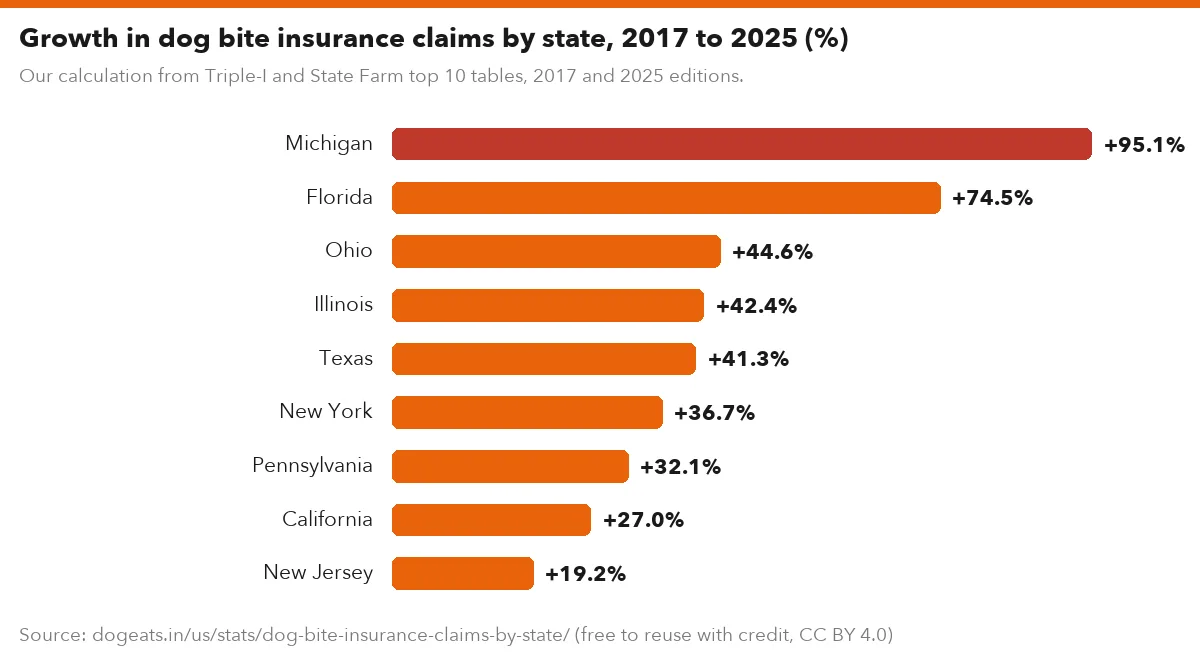
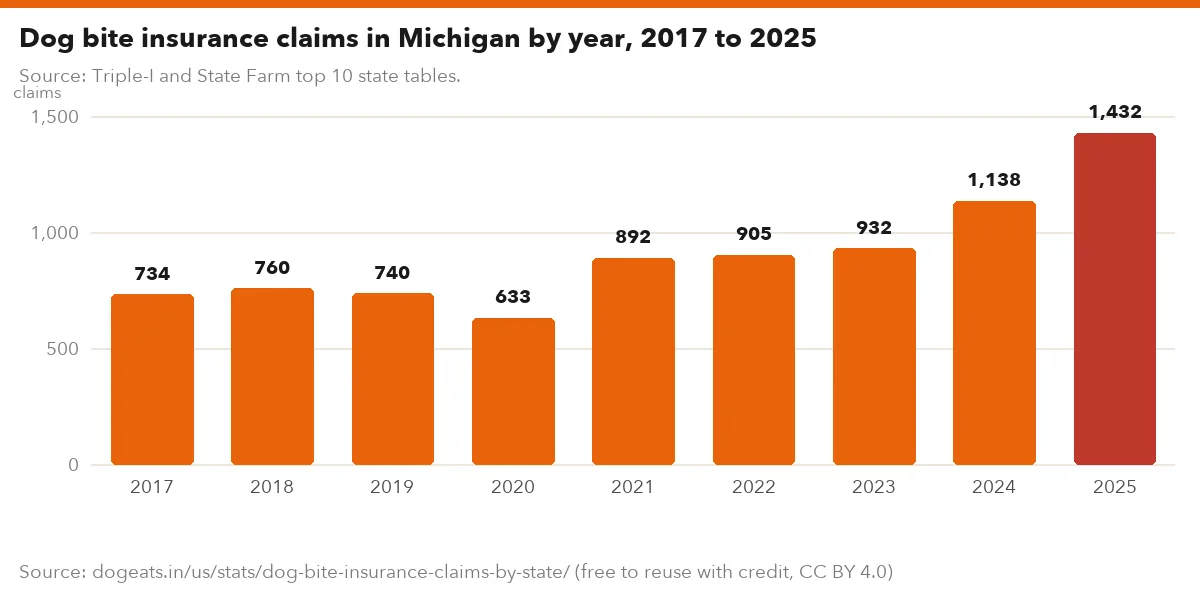
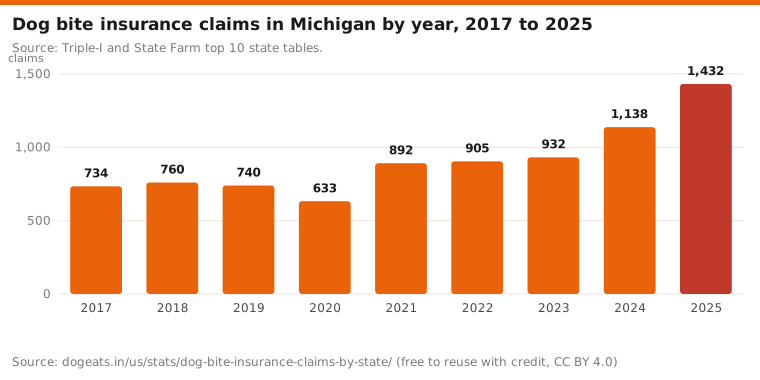
- Michigan's claim count rose 95.1% from 2017 to 2025, the fastest growth of the nine states that made the top 10 every year.
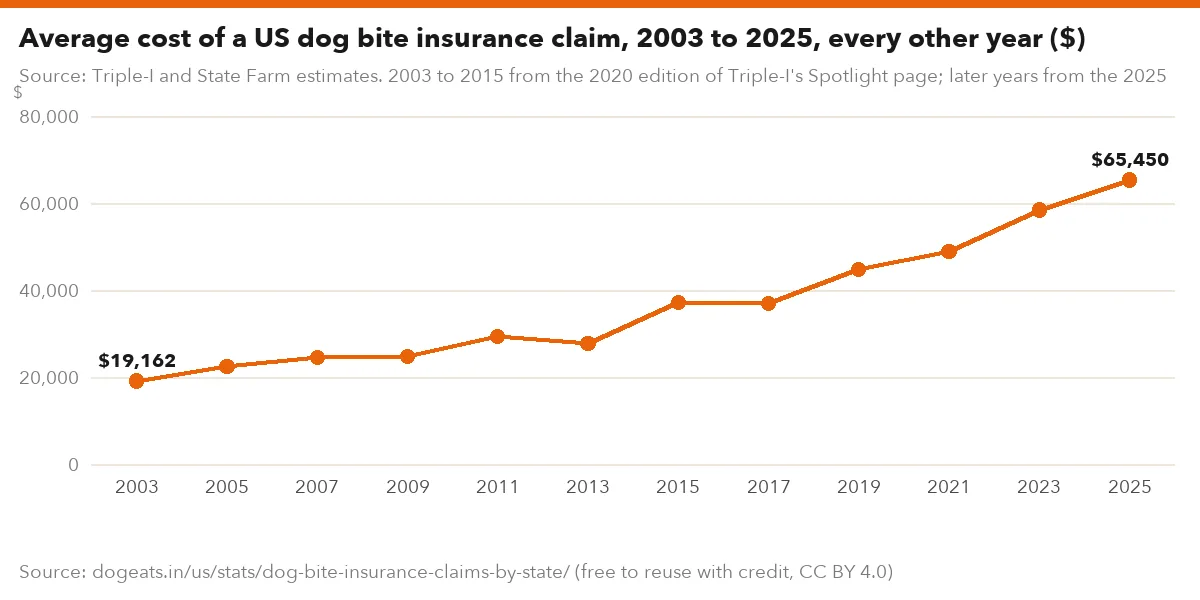
- The average dog bite claim rose 241.6% from $19,162 in 2003 to $65,450 in 2025, while consumer prices rose 75.8%.
- California had 2,830 claims worth $231.5 million in 2025, 12.4% of the national total value.
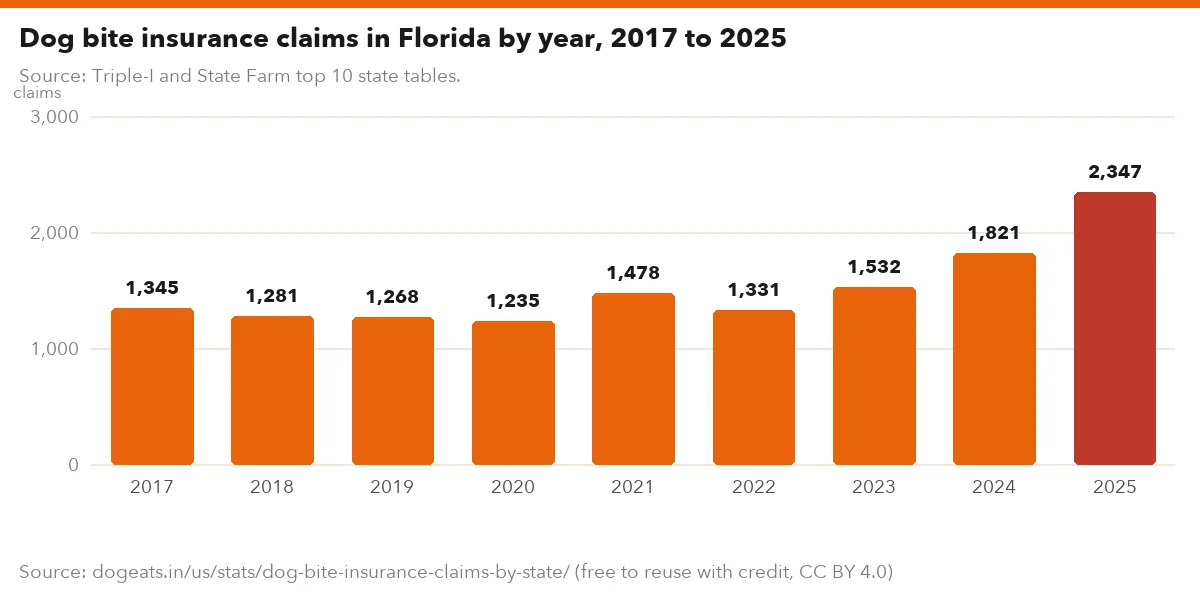
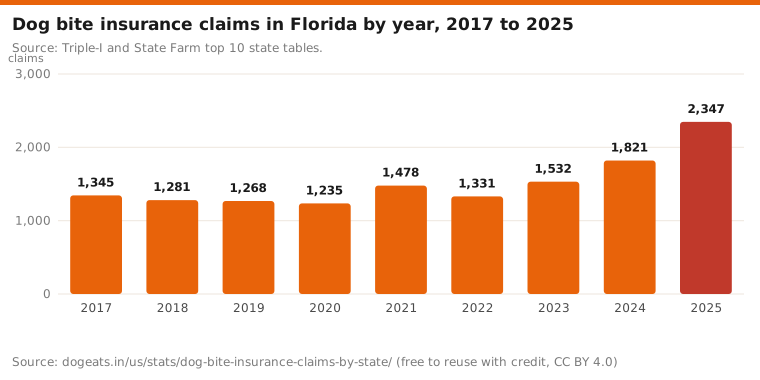
- Florida's claims rose from 1,345 in 2017 to 2,347 in 2025, a 74.5% increase.
- The top 10 states held 52.1% of all claims in 2025, the lowest share in the 2017 to 2025 editions.
- Claims in the top 10 states averaged $70,496 in 2025, against $59,959 in the other states.
- Triple-I first published 16,991 claims for 2020; later editions show 17,597, while the current table keeps the original dollar totals.
Which states have the most dog bite insurance claims?
California had the most dog bite claims in 2025, with 2,830, and Florida was second with 2,347, according to the Insurance Information Institute (Triple-I) and State Farm. Michigan was third with 1,432.
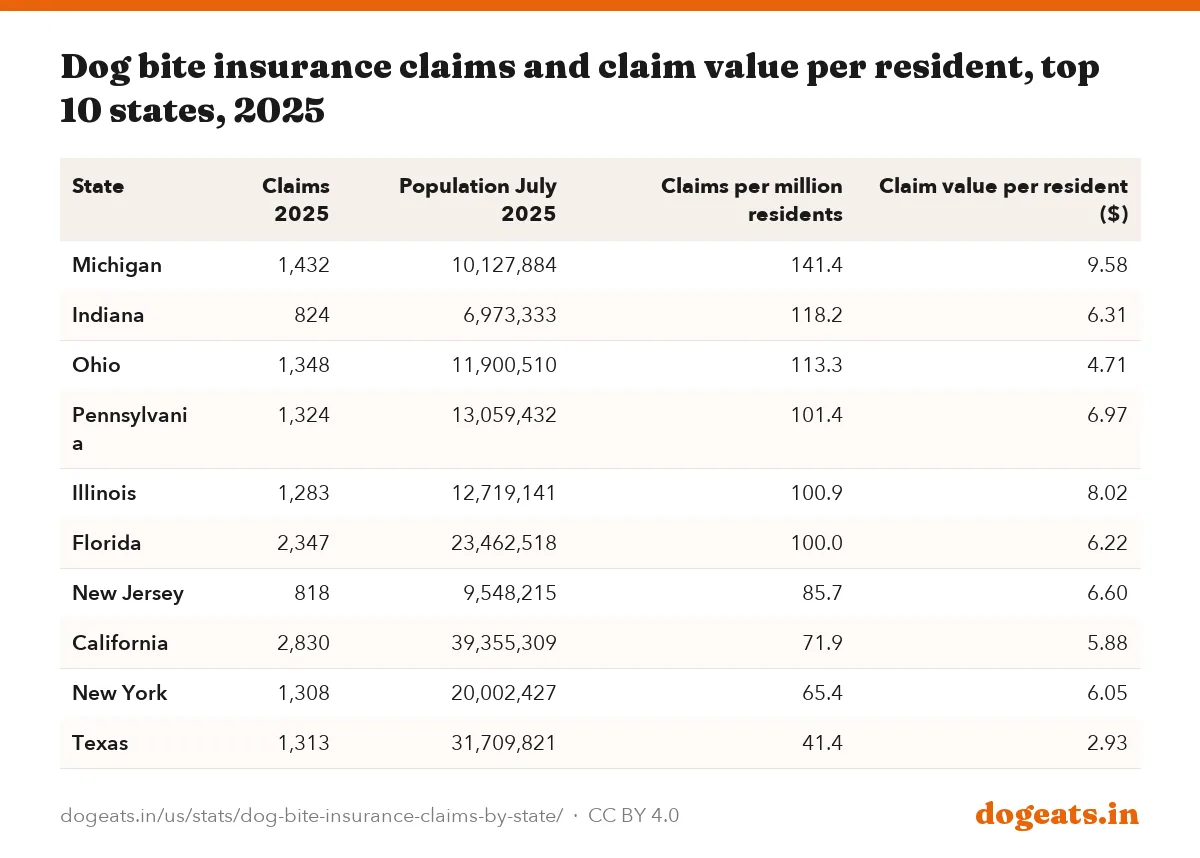
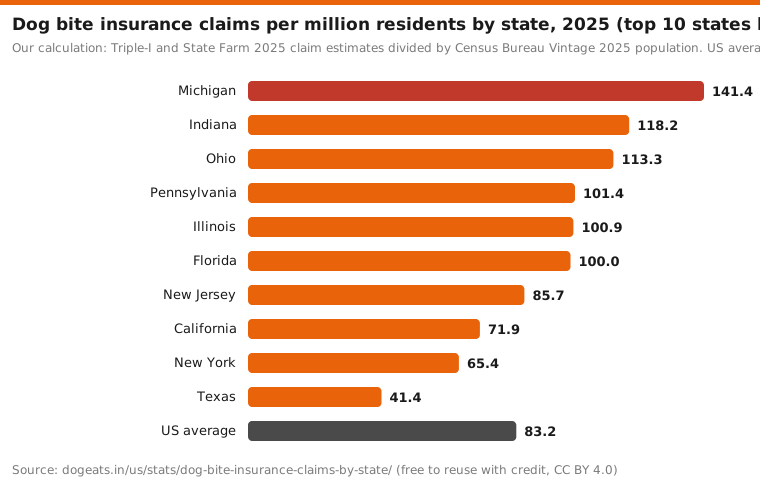
Big states naturally have more claims, so we divided each count by the state's 2025 population. Michigan had 141.4 claims per million residents, Indiana 118.2 and Ohio 113.3.
California, with the most claims, had 71.9 per million, below the US average of 83.2. Texas had the lowest rate of the 10, at 41.4 per million.
Our calculation: Triple-I and State Farm 2025 claim estimates divided by Census Bureau Vintage 2025 population. US average uses 28,450 claims.
Show the numbers
| Label | per million |
|---|---|
| Michigan | 141.4 |
| Indiana | 118.2 |
| Ohio | 113.3 |
| Pennsylvania | 101.4 |
| Illinois | 100.9 |
| Florida | 100.0 |
| New Jersey | 85.7 |
| California | 71.9 |
| New York | 65.4 |
| Texas | 41.4 |
| US average | 83.2 |
Embed this chart
| State | Claims 2025 | Population July 2025 | Claims per million residents | Claim value per resident ($) |
|---|---|---|---|---|
| Michigan | 1,432 | 10,127,884 | 141.4 | 9.58 |
| Indiana | 824 | 6,973,333 | 118.2 | 6.31 |
| Ohio | 1,348 | 11,900,510 | 113.3 | 4.71 |
| Pennsylvania | 1,324 | 13,059,432 | 101.4 | 6.97 |
| Illinois | 1,283 | 12,719,141 | 100.9 | 8.02 |
| Florida | 2,347 | 23,462,518 | 100.0 | 6.22 |
| New Jersey | 818 | 9,548,215 | 85.7 | 6.60 |
| California | 2,830 | 39,355,309 | 71.9 | 5.88 |
| New York | 1,308 | 20,002,427 | 65.4 | 6.05 |
| Texas | 1,313 | 31,709,821 | 41.4 | 2.93 |
Michigan's claims were worth $9.58 per resident in 2025, the most of the 10. Illinois followed at $8.02 and Pennsylvania at $6.97. The US figure was $5.45 per resident.
Triple-I publishes counts only for the top 10 states. The other 40 states and DC shared 13,623 claims in 2025, so no state outside the list can be ranked.
How much does a dog bite claim cost?
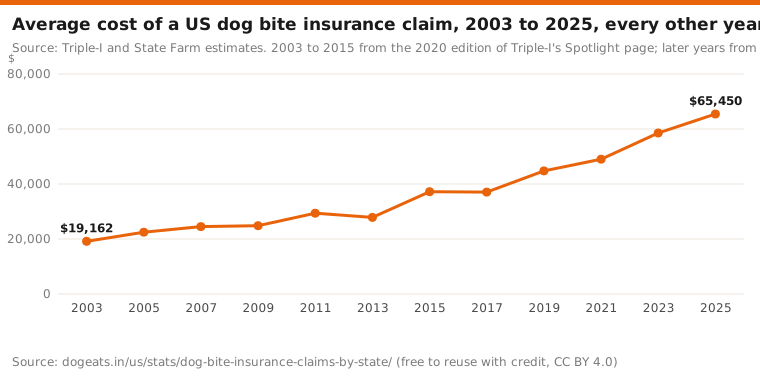
The average dog bite claim cost $65,450 in 2025, down 5.5% from the record $69,272 in 2024. Triple-I says rising medical costs and larger settlements, judgments and jury awards push the average up.
The long-run rise is steep. In 2003, the average claim was $19,162. By 2025 it had risen 241.6%, while the consumer price index rose 75.8% from December 2003 to December 2025.
Medical care services prices rose 105.7% over the same years. Claim costs grew faster than both measures.
Source: Triple-I and State Farm estimates. 2003 to 2015 from the 2020 edition of Triple-I's Spotlight page; later years from the 2025 edition.
Show the numbers
| Label | $ |
|---|---|
| 2003 | $19,162 |
| 2005 | $22,464 |
| 2007 | $24,511 |
| 2009 | $24,840 |
| 2011 | $29,396 |
| 2013 | $27,862 |
| 2015 | $37,214 |
| 2017 | $37,051 |
| 2019 | $44,760 |
| 2021 | $49,025 |
| 2023 | $58,545 |
| 2025 | $65,450 |
Embed this chart
| Year | Value of claims ($ millions) | Number of claims | Average cost per claim ($) | Triple-I edition used |
|---|---|---|---|---|
| 2003 | 324.2 | 16,919 | 19,162 | 2020 edition |
| 2004 | 318.9 | 15,630 | 20,406 | 2020 edition |
| 2005 | 321.1 | 14,295 | 22,464 | 2020 edition |
| 2006 | 322.4 | 14,661 | 21,987 | 2020 edition |
| 2007 | 356.2 | 14,531 | 24,511 | 2020 edition |
| 2008 | 387.0 | 15,823 | 24,461 | 2020 edition |
| 2009 | 412.0 | 16,586 | 24,840 | 2020 edition |
| 2010 | 412.6 | 15,770 | 26,166 | 2020 edition |
| 2011 | 490.8 | 16,695 | 29,396 | 2020 edition |
| 2012 | 489.7 | 16,459 | 29,752 | 2020 edition |
| 2013 | 483.7 | 17,359 | 27,862 | 2020 edition |
| 2014 | 530.8 | 16,550 | 32,072 | 2020 edition |
| 2015 | 571.3 | 15,352 | 37,214 | 2020 edition |
| 2016 | 602.2 | 18,123 | 33,230 | 2025 edition |
| 2017 | 686.3 | 18,522 | 37,051 | 2025 edition |
| 2018 | 674.9 | 17,297 | 39,017 | 2025 edition |
| 2019 | 796.8 | 17,802 | 44,760 | 2025 edition |
| 2020 | 853.7 | 16,991 | 50,245 | 2020 edition (later editions: 17,597) |
| 2021 | 881.9 | 17,989 | 49,025 | 2025 edition |
| 2022 | 1136.0 | 17,597 | 64,555 | 2025 edition |
| 2023 | 1116.0 | 19,062 | 58,545 | 2025 edition |
| 2024 | 1569.6 | 22,658 | 69,272 | 2025 edition |
| 2025 | 1862.1 | 28,450 | 65,450 | 2025 edition |
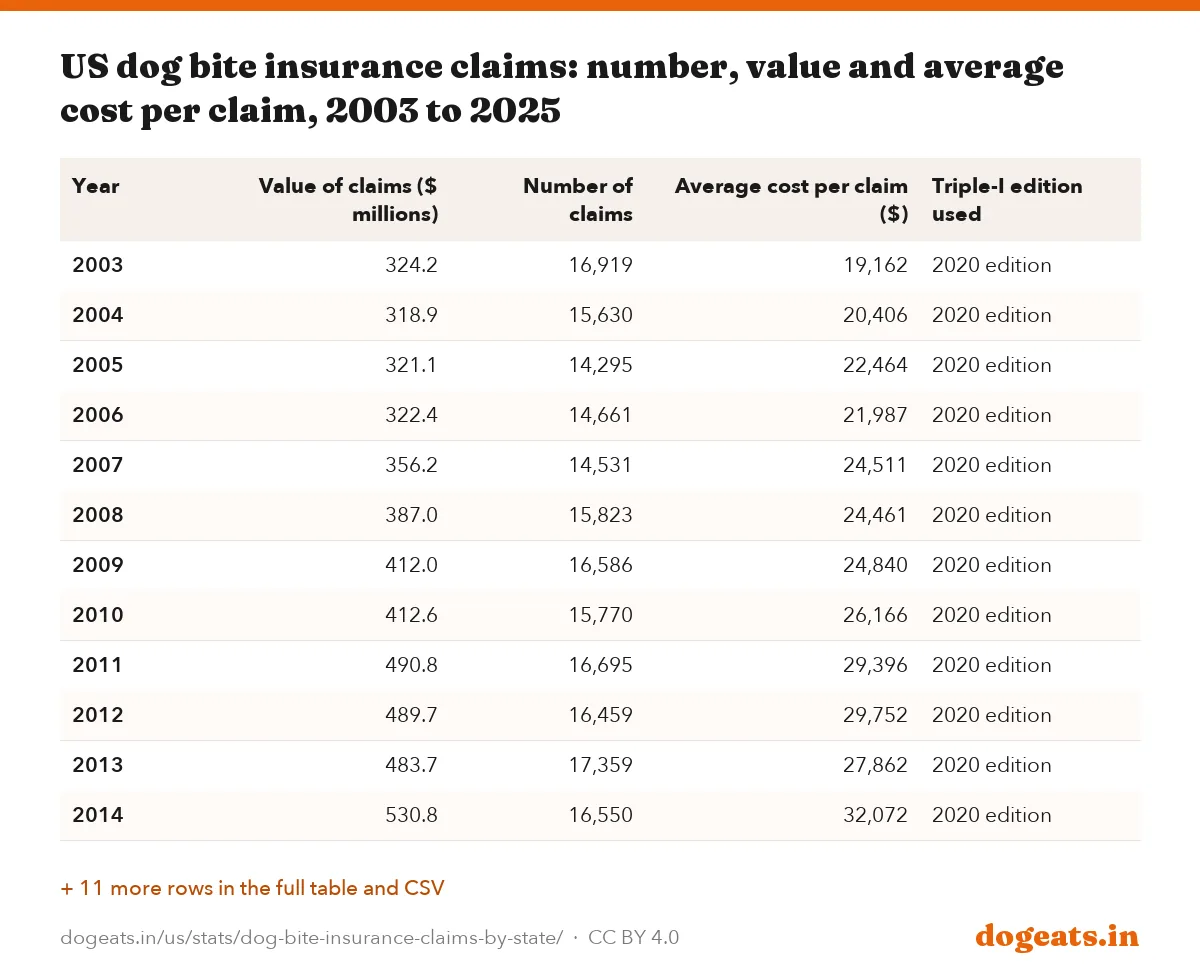
Claim numbers grew far less than costs. There were 16,919 claims in 2003 and 28,450 in 2025, a 68.2% rise. The total value of claims rose 474.4%.
The fewest claims in this series were 14,295 in 2005. The 2025 count was the highest on record in these tables.
New York has the costliest dog bite claims
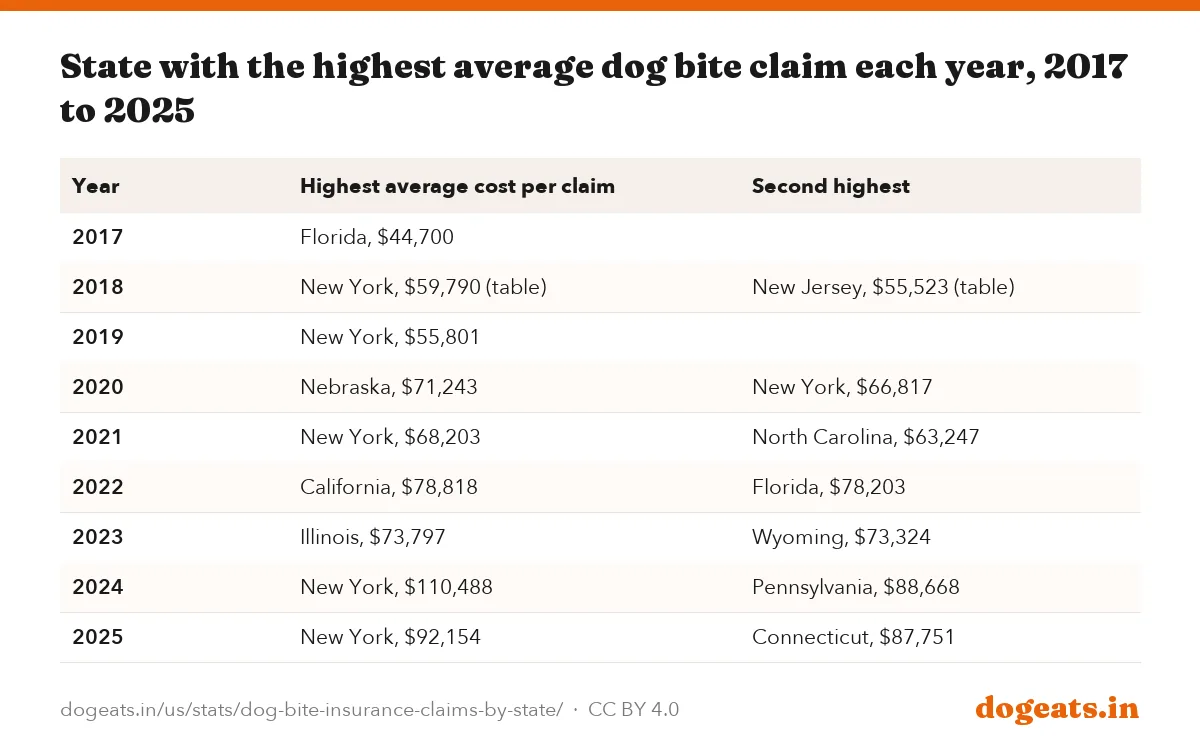
New York had the highest average cost per claim in 2025, at $92,154. Connecticut was next at $87,751, Triple-I said. Among the 10 states with the most claims, California came second at $81,789.
New York has topped the average-cost list in four of the last seven years: 2019, 2021, 2024 and 2025. Its 2024 average of $110,488 is the highest state figure in any Triple-I table we opened.
Ohio had the lowest average of the 2025 top 10, at $41,413. A claim in New York cost more than twice as much on average.

| Year | Highest average cost per claim | Second highest |
|---|---|---|
| 2017 | Florida, $44,700 | |
| 2018 | New York, $59,790 (table) | New Jersey, $55,523 (table) |
| 2019 | New York, $55,801 | |
| 2020 | Nebraska, $71,243 | New York, $66,817 |
| 2021 | New York, $68,203 | North Carolina, $63,247 |
| 2022 | California, $78,818 | Florida, $78,203 |
| 2023 | Illinois, $73,797 | Wyoming, $73,324 |
| 2024 | New York, $110,488 | Pennsylvania, $88,668 |
| 2025 | New York, $92,154 | Connecticut, $87,751 |
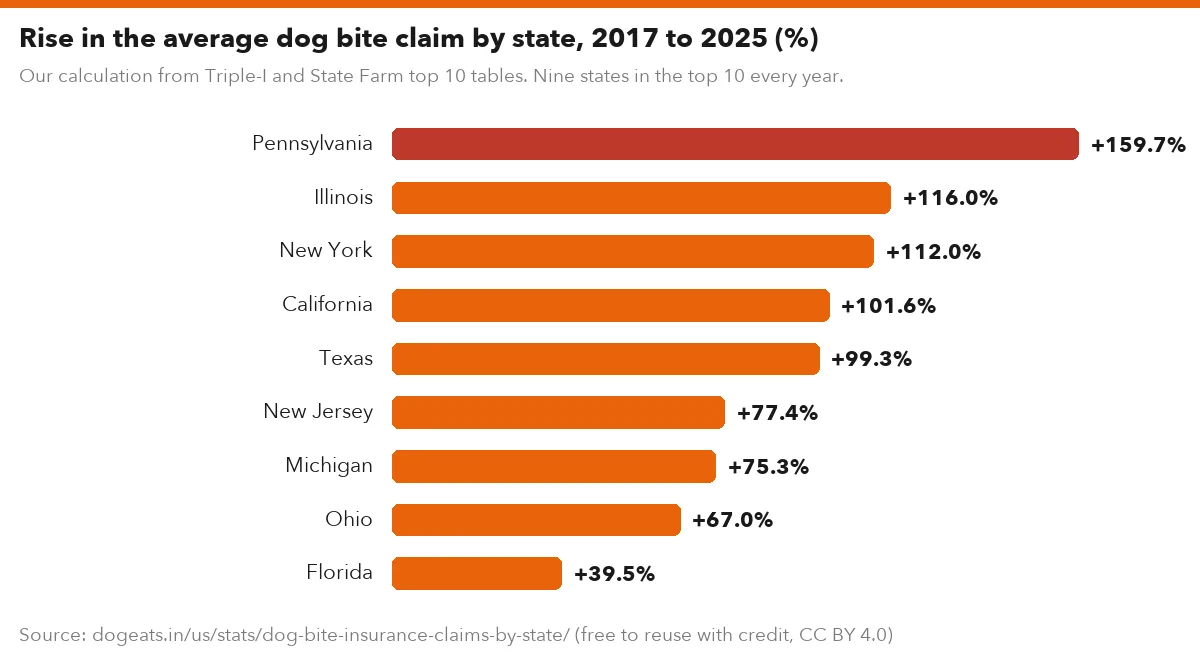
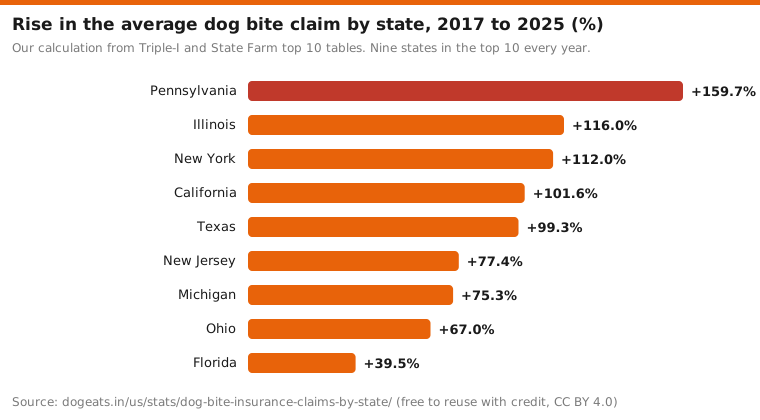
Our calculation from Triple-I and State Farm top 10 tables. Nine states in the top 10 every year.
Show the numbers
| Label | % |
|---|---|
| Pennsylvania | +159.7% |
| Illinois | +116.0% |
| New York | +112.0% |
| California | +101.6% |
| Texas | +99.3% |
| New Jersey | +77.4% |
| Michigan | +75.3% |
| Ohio | +67.0% |
| Florida | +39.5% |
Embed this chart
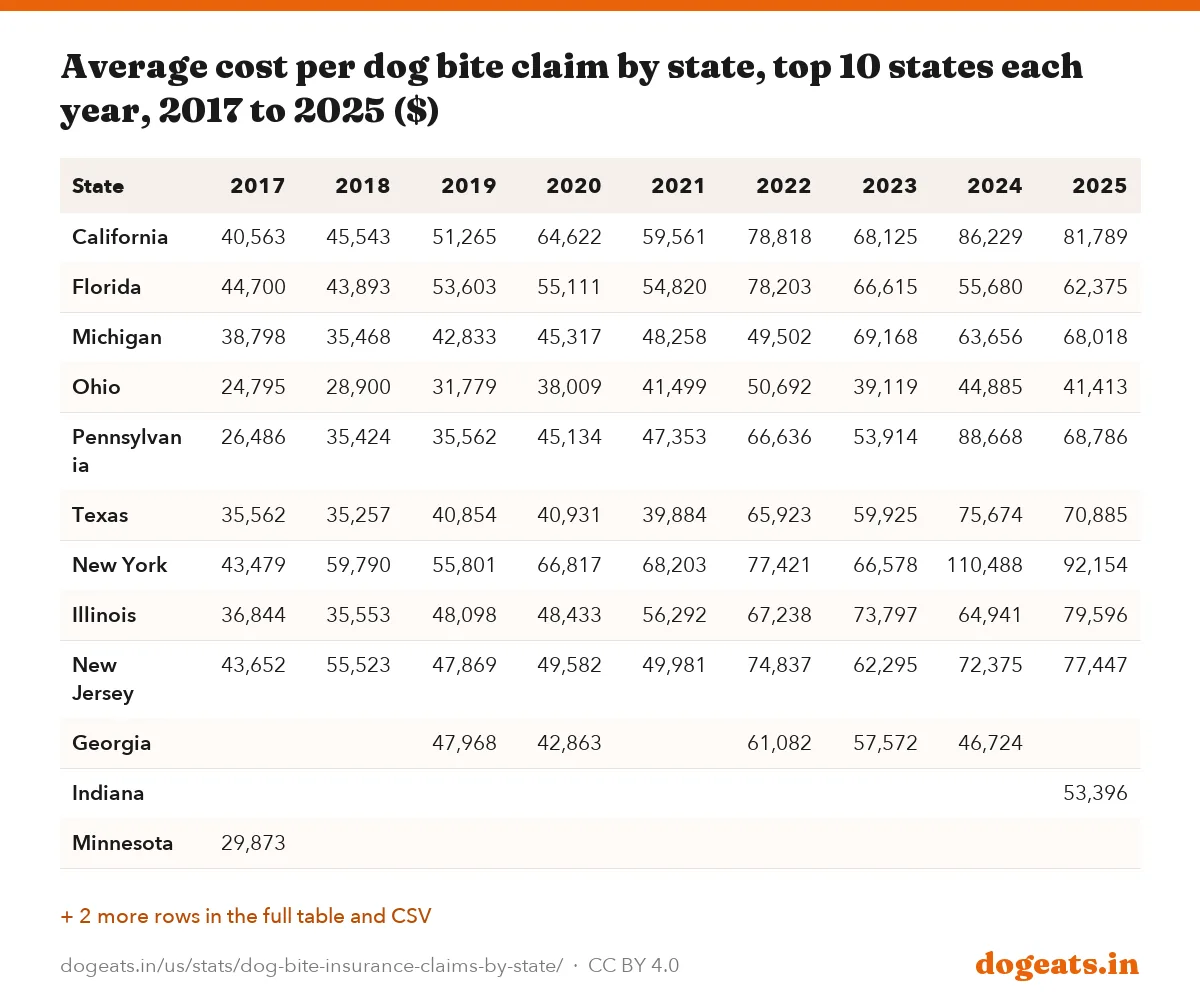
| State | 2017 | 2018 | 2019 | 2020 | 2021 | 2022 | 2023 | 2024 | 2025 |
|---|---|---|---|---|---|---|---|---|---|
| California | 40,563 | 45,543 | 51,265 | 64,622 | 59,561 | 78,818 | 68,125 | 86,229 | 81,789 |
| Florida | 44,700 | 43,893 | 53,603 | 55,111 | 54,820 | 78,203 | 66,615 | 55,680 | 62,375 |
| Michigan | 38,798 | 35,468 | 42,833 | 45,317 | 48,258 | 49,502 | 69,168 | 63,656 | 68,018 |
| Ohio | 24,795 | 28,900 | 31,779 | 38,009 | 41,499 | 50,692 | 39,119 | 44,885 | 41,413 |
| Pennsylvania | 26,486 | 35,424 | 35,562 | 45,134 | 47,353 | 66,636 | 53,914 | 88,668 | 68,786 |
| Texas | 35,562 | 35,257 | 40,854 | 40,931 | 39,884 | 65,923 | 59,925 | 75,674 | 70,885 |
| New York | 43,479 | 59,790 | 55,801 | 66,817 | 68,203 | 77,421 | 66,578 | 110,488 | 92,154 |
| Illinois | 36,844 | 35,553 | 48,098 | 48,433 | 56,292 | 67,238 | 73,797 | 64,941 | 79,596 |
| New Jersey | 43,652 | 55,523 | 47,869 | 49,582 | 49,981 | 74,837 | 62,295 | 72,375 | 77,447 |
| Georgia | 47,968 | 42,863 | 61,082 | 57,572 | 46,724 | ||||
| Indiana | 53,396 | ||||||||
| Minnesota | 29,873 | ||||||||
| Connecticut | 35,644 | ||||||||
| Arizona | 43,059 |
For 2017, Triple-I named the highest average in its top 10 table. For 2018 its text named California at $45,543, but its own table shows New York at $59,790. From 2020 it named states outside the top 10, such as Nebraska and Wyoming.
Pennsylvania's average claim rose 159.7% from 2017 to 2025, the most of the nine states. Florida's rose 39.5%, the least.
Claims are rising fastest in Michigan and Florida
Nine states made Triple-I's top 10 in every year from 2017 to 2025. All nine had more claims in 2025 than in 2017.
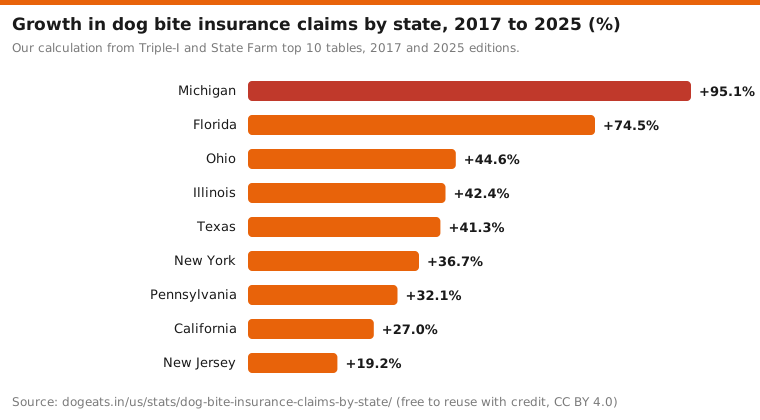
Michigan's claims rose 95.1%, from 734 to 1,432. Florida's rose 74.5% and Ohio's 44.6%. New Jersey grew least, at 19.2%.
The jump from 2024 to 2025 was broad. Claims rose 36.9% in Ohio, 36.5% in Illinois and 31.9% in Pennsylvania in a single year.
Our calculation from Triple-I and State Farm top 10 tables, 2017 and 2025 editions.
Show the numbers
| Label | % |
|---|---|
| Michigan | +95.1% |
| Florida | +74.5% |
| Ohio | +44.6% |
| Illinois | +42.4% |
| Texas | +41.3% |
| New York | +36.7% |
| Pennsylvania | +32.1% |
| California | +27.0% |
| New Jersey | +19.2% |
Embed this chart
Source: Triple-I and State Farm top 10 state tables.
Show the numbers
| Label | claims |
|---|---|
| 2017 | 1,345 |
| 2018 | 1,281 |
| 2019 | 1,268 |
| 2020 | 1,235 |
| 2021 | 1,478 |
| 2022 | 1,331 |
| 2023 | 1,532 |
| 2024 | 1,821 |
| 2025 | 2,347 |
Embed this chart
Source: Triple-I and State Farm top 10 state tables.
Show the numbers
| Label | claims |
|---|---|
| 2017 | 734 |
| 2018 | 760 |
| 2019 | 740 |
| 2020 | 633 |
| 2021 | 892 |
| 2022 | 905 |
| 2023 | 932 |
| 2024 | 1,138 |
| 2025 | 1,432 |
Embed this chart
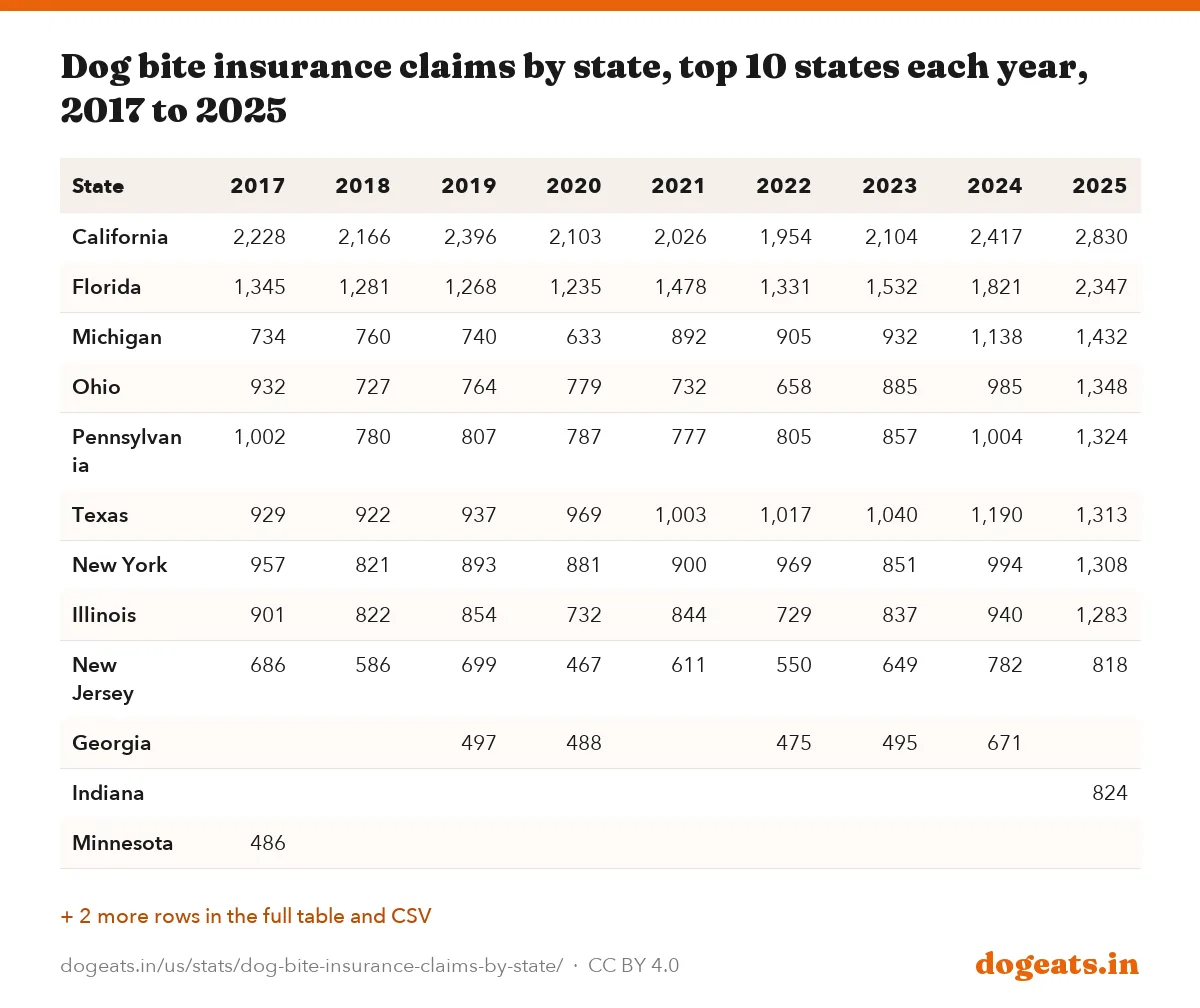
| State | 2017 | 2018 | 2019 | 2020 | 2021 | 2022 | 2023 | 2024 | 2025 |
|---|---|---|---|---|---|---|---|---|---|
| California | 2,228 | 2,166 | 2,396 | 2,103 | 2,026 | 1,954 | 2,104 | 2,417 | 2,830 |
| Florida | 1,345 | 1,281 | 1,268 | 1,235 | 1,478 | 1,331 | 1,532 | 1,821 | 2,347 |
| Michigan | 734 | 760 | 740 | 633 | 892 | 905 | 932 | 1,138 | 1,432 |
| Ohio | 932 | 727 | 764 | 779 | 732 | 658 | 885 | 985 | 1,348 |
| Pennsylvania | 1,002 | 780 | 807 | 787 | 777 | 805 | 857 | 1,004 | 1,324 |
| Texas | 929 | 922 | 937 | 969 | 1,003 | 1,017 | 1,040 | 1,190 | 1,313 |
| New York | 957 | 821 | 893 | 881 | 900 | 969 | 851 | 994 | 1,308 |
| Illinois | 901 | 822 | 854 | 732 | 844 | 729 | 837 | 940 | 1,283 |
| New Jersey | 686 | 586 | 699 | 467 | 611 | 550 | 649 | 782 | 818 |
| Georgia | 497 | 488 | 475 | 495 | 671 | ||||
| Indiana | 824 | ||||||||
| Minnesota | 486 | ||||||||
| Connecticut | 537 | ||||||||
| Arizona | 489 |
Georgia was in the top 10 in five of the nine years. Minnesota (2017), Connecticut (2018), Arizona (2021) and Indiana (2025) each appeared once.
California's claims dipped from 2,396 in 2019 to 1,954 in 2022, then rose 44.8% to 2,830 in 2025.
Top 10 states vs the rest of the country
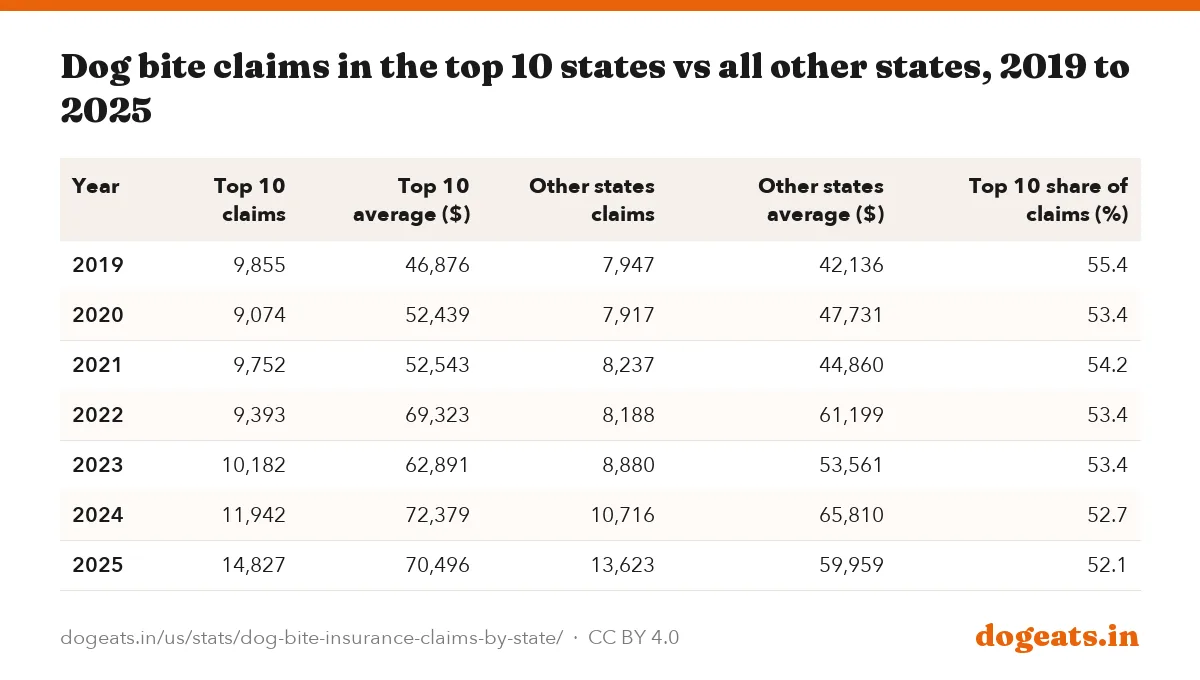
The 10 states with the most claims accounted for 14,827 of the 28,450 claims in 2025, or 52.1%. That share has slipped from 55.4% in 2019.
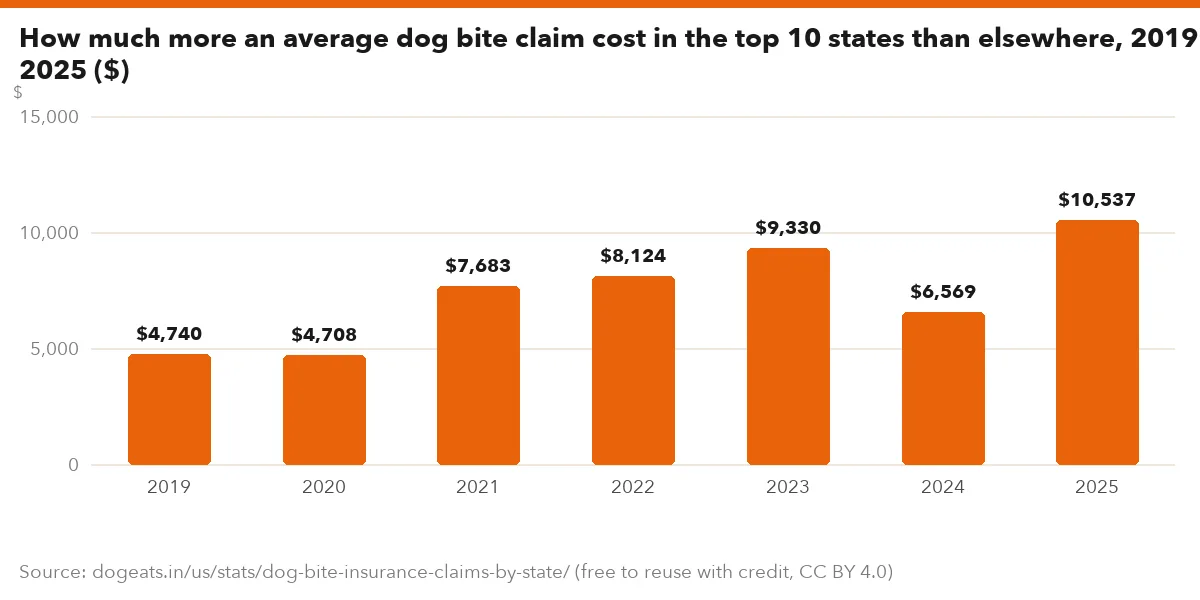
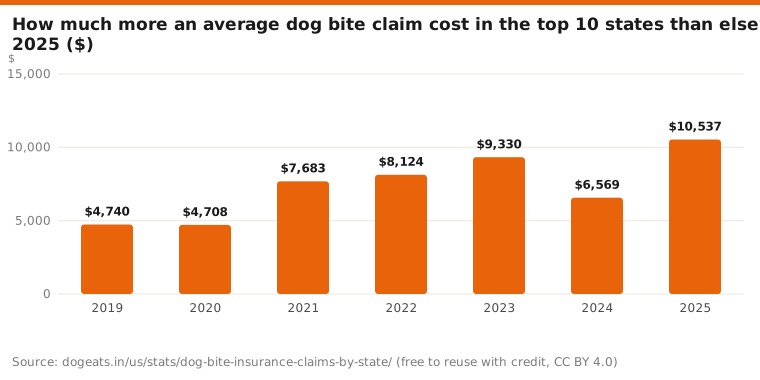
Claims in the top 10 states also cost more. They averaged $70,496 in 2025, against $59,959 in the other 40 states and DC.
The other states' claims grew fast too. They rose from 10,716 in 2024 to 13,623 in 2025, an increase of 27.1%.
| Year | Top 10 claims | Top 10 average ($) | Other states claims | Other states average ($) | Top 10 share of claims (%) |
|---|---|---|---|---|---|
| 2019 | 9,855 | 46,876 | 7,947 | 42,136 | 55.4 |
| 2020 | 9,074 | 52,439 | 7,917 | 47,731 | 53.4 |
| 2021 | 9,752 | 52,543 | 8,237 | 44,860 | 54.2 |
| 2022 | 9,393 | 69,323 | 8,188 | 61,199 | 53.4 |
| 2023 | 10,182 | 62,891 | 8,880 | 53,561 | 53.4 |
| 2024 | 11,942 | 72,379 | 10,716 | 65,810 | 52.7 |
| 2025 | 14,827 | 70,496 | 13,623 | 59,959 | 52.1 |
Our calculation: top 10 average minus other-states average, from Triple-I and State Farm tables.
Show the numbers
| Label | $ |
|---|---|
| 2019 | $4,740 |
| 2020 | $4,708 |
| 2021 | $7,683 |
| 2022 | $8,124 |
| 2023 | $9,330 |
| 2024 | $6,569 |
| 2025 | $10,537 |
Embed this chart
Dog bite claims, homeowners insurance and state law
Homeowners and renters policies usually cover dog bite liability up to the policy limit, typically $100,000 to $300,000, Triple-I says. The owner pays anything above the limit.
The average 2025 claim of $65,450 sits below the low end of that range. In New York, the average of $92,154 came close to a $100,000 limit.
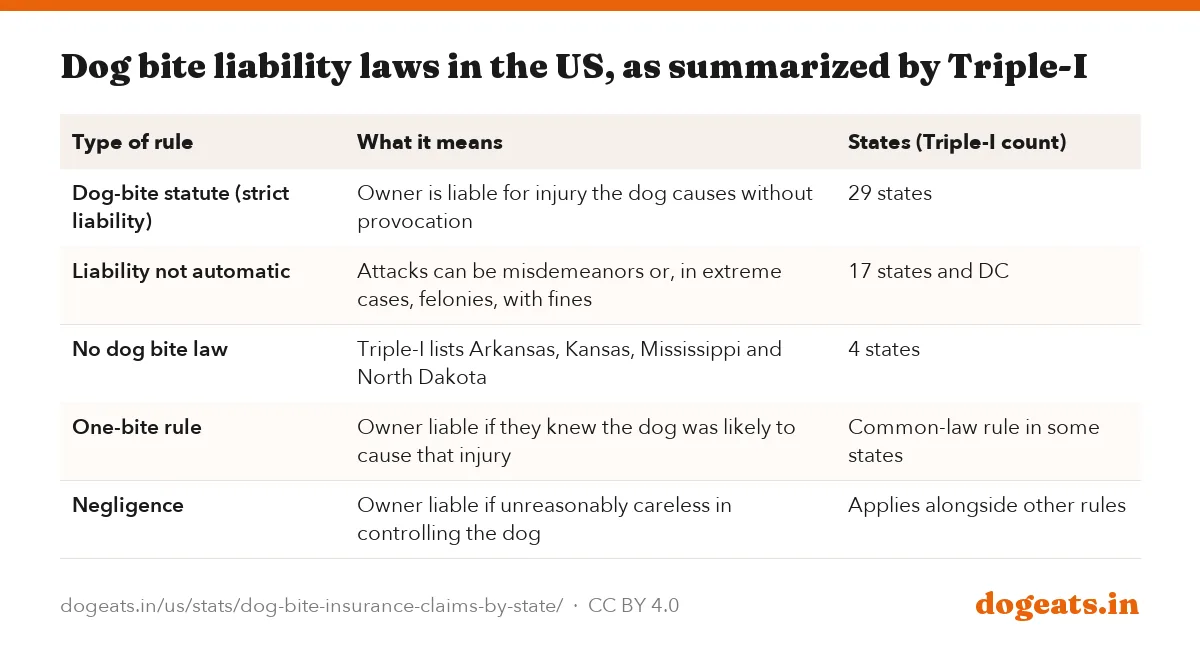
State law shapes these claims. Triple-I counts 29 states where owners are liable for injuries their dogs cause, with exceptions such as provocation, based on a March 2021 compilation.
| Type of rule | What it means | States (Triple-I count) |
|---|---|---|
| Dog-bite statute (strict liability) | Owner is liable for injury the dog causes without provocation | 29 states |
| Liability not automatic | Attacks can be misdemeanors or, in extreme cases, felonies, with fines | 17 states and DC |
| No dog bite law | Triple-I lists Arkansas, Kansas, Mississippi and North Dakota | 4 states |
| One-bite rule | Owner liable if they knew the dog was likely to cause that injury | Common-law rule in some states |
| Negligence | Owner liable if unreasonably careless in controlling the dog | Applies alongside other rules |
- Pennsylvania and Michigan have laws that bar insurers from canceling or refusing some policies because of a dog's breed, Triple-I says.
- Ohio requires owners of dogs classified as vicious to carry at least $100,000 of liability insurance.
- Some insurers charge more, exclude a dog or decline to renew after a bite, according to Triple-I.
This is a summary, not legal advice. Laws change, and the 29, 17 and 4 counts date from March 2021.
For bites to postal workers, see USPS dog attacks by city. For state breed rules, see breed-specific laws by state.
Triple-I's own tables do not always agree
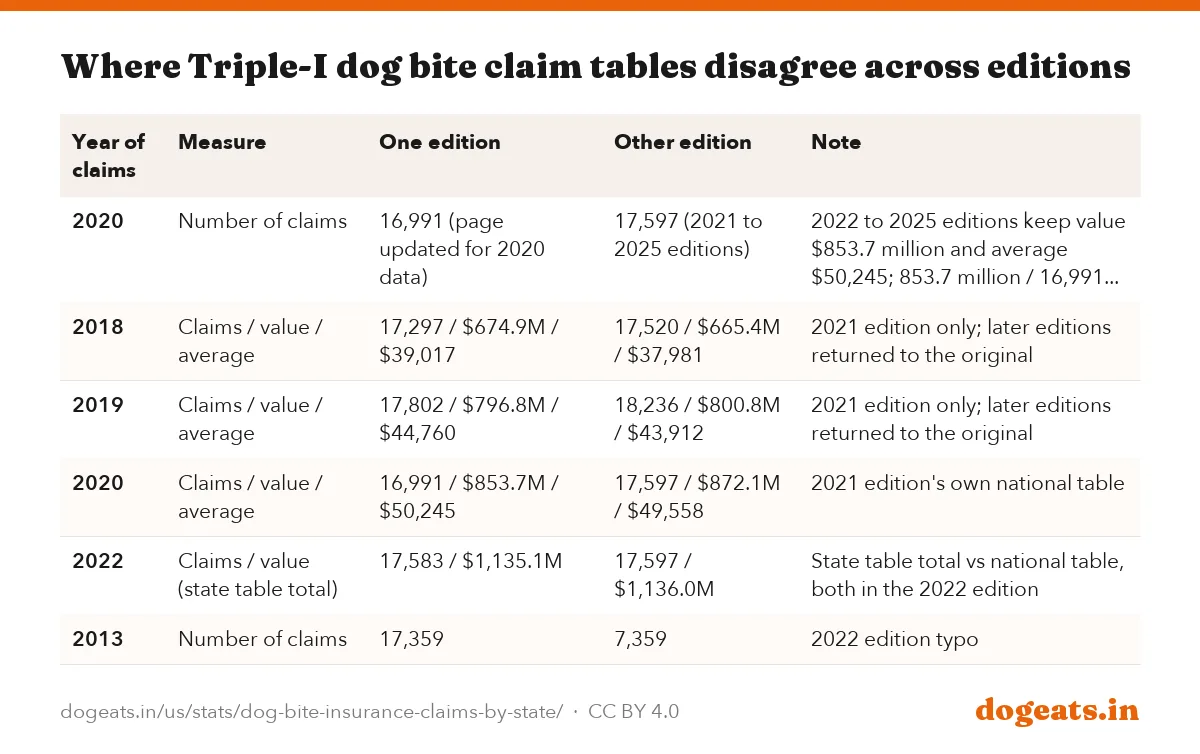
Triple-I first published 16,991 claims for 2020. Every edition from 2021 on shows 17,597. The 2022 to 2025 editions keep the original $853.7 million value and $50,245 average.
The original figure is the one that fits the arithmetic: $853.7 million divided by 16,991 claims is $50,244. The later 17,597 is also the published count for 2022.
The 2021 edition briefly revised 2018 to 2020. Later editions returned to the original 2018 and 2019 figures.
| Year of claims | Measure | One edition | Other edition | Note |
|---|---|---|---|---|
| 2020 | Number of claims | 16,991 (page updated for 2020 data) | 17,597 (2021 to 2025 editions) | 2022 to 2025 editions keep value $853.7 million and average $50,245; 853.7 million / 16,991 = $50,244 |
| 2018 | Claims / value / average | 17,297 / $674.9M / $39,017 | 17,520 / $665.4M / $37,981 | 2021 edition only; later editions returned to the original |
| 2019 | Claims / value / average | 17,802 / $796.8M / $44,760 | 18,236 / $800.8M / $43,912 | 2021 edition only; later editions returned to the original |
| 2020 | Claims / value / average | 16,991 / $853.7M / $50,245 | 17,597 / $872.1M / $49,558 | 2021 edition's own national table |
| 2022 | Claims / value (state table total) | 17,583 / $1,135.1M | 17,597 / $1,136.0M | State table total vs national table, both in the 2022 edition |
| 2013 | Number of claims | 17,359 | 7,359 | 2022 edition typo |
These revisions are small against a $1.86 billion total. They matter for year-to-year changes: 2020 claims fell 4.6% on the original figure, the drop Triple-I itself cites, but would have fallen 1.1% on the later one.
What insurance claim data can and cannot show
The figures are industry estimates from Triple-I and State Farm. They cover homeowners liability claims and include other dog-related injuries, such as fractures from being knocked over.
Claims are not bites. Many bites never lead to a claim, and some claims involve no bite. For medical and public health counts, see our dog bite statistics report.
Average cost per claim is the closest public figure to a typical dog bite settlement. Triple-I does not publish separate settlement or jury verdict amounts by state.
Frequently asked questions
Does homeowners insurance cover dog bites?
Usually, up to the liability limit, which Triple-I says is typically $100,000 to $300,000. Some insurers exclude certain dogs or breeds, or decline to renew after a bite. The owner pays costs above the limit.
What is the average dog bite settlement amount?
The closest public figure is the average insurance claim: $65,450 in 2025, per Triple-I and State Farm. It was $69,272 in 2024 and $19,162 in 2003. Individual settlements vary widely.
Which state has the most dog bite claims?
California, with 2,830 claims in 2025. Florida had 2,347 and Michigan 1,432. Per resident, Michigan was highest among the top 10 states, at 141.4 claims per million people.
Which state has the highest dog bite claim costs?
New York, with an average of $92,154 per claim in 2025. Connecticut was second at $87,751. New York's 2024 average was $110,488.
How many dog bite insurance claims are there each year?
Triple-I and State Farm estimate 28,450 claims in 2025, up 25.6% from 22,658 in 2024. The 2025 figure is the highest in their tables back to 2003.
How much do insurers pay for dog bites in total?
An estimated $1.86 billion in 2025, up 18.6% from $1.57 billion in 2024. California alone accounted for $231.5 million.
Are dog bite claims rising in every state?
In all nine states that made the top 10 every year from 2017 to 2025, claims were higher in 2025 than in 2017. Growth ranged from 19.2% in New Jersey to 95.1% in Michigan.
Why are dog bite claims so expensive?
Triple-I points to higher medical costs and larger settlements, judgments and jury awards. The average claim rose faster than consumer prices and medical care prices from 2003 to 2025.
Methodology and limitations
State tables come from Triple-I's Spotlight on dog bite liability page, which we opened live and in Internet Archive copies saved between December 2018 and October 2025. Each copy holds one year's top 10 state table.
National figures for 2003 to 2015 come from the copy holding the 2020 edition. Figures for 2016 to 2025 come from the current page, except the 2020 claim count explained in the conflicts section.
Claims per million residents and value per resident divide Triple-I's 2025 state figures by Census Bureau Vintage 2025 population estimates for July 1, 2025. Growth rates and top 10 versus other comparisons are our calculations.
Consumer price comparisons use BLS CPI-U all items and medical care services, December 2003 to December 2025.
Sources
- Insurance Information Institute (Triple-I) and State Farm, Spotlight on dog bite liability (2025 data), 2025 claims, value and averages, top 10 states, national series 2016 to 2025, liability laws
- Triple-I, Dog-related injury claims on the rise in 2025, April 13, 2026, 2025 totals, highest average cost states
- US Census Bureau, Vintage 2025 state population estimates, Populations for per-resident rates
- Also consulted: Triple-I Spotlight page, archived December 2018, Triple-I Spotlight page, archived December 2019, Triple-I Spotlight page, archived December 2020, Triple-I Spotlight page, archived November 2021, Triple-I Spotlight page, archived October 2022, Triple-I Spotlight page, archived December 2023, Triple-I Spotlight page, archived October 2024, Triple-I Spotlight page, archived October 2025, US Bureau of Labor Statistics, CPI-U all items and medical care services.
Cite, embed and download
This report, its data and its images are free to reuse under a Creative Commons Attribution 4.0 licence. Credit dogeats.in with a link to this page. Every chart has its own embed code, every table has a CSV and an image download, and the images below are ready for social posts, slides and articles.
Cite this report
Link to this report
Every chart and table as an image