Data report · Updated October 2026
USPS dog attacks by city and state: how many mail carriers dogs attack each year
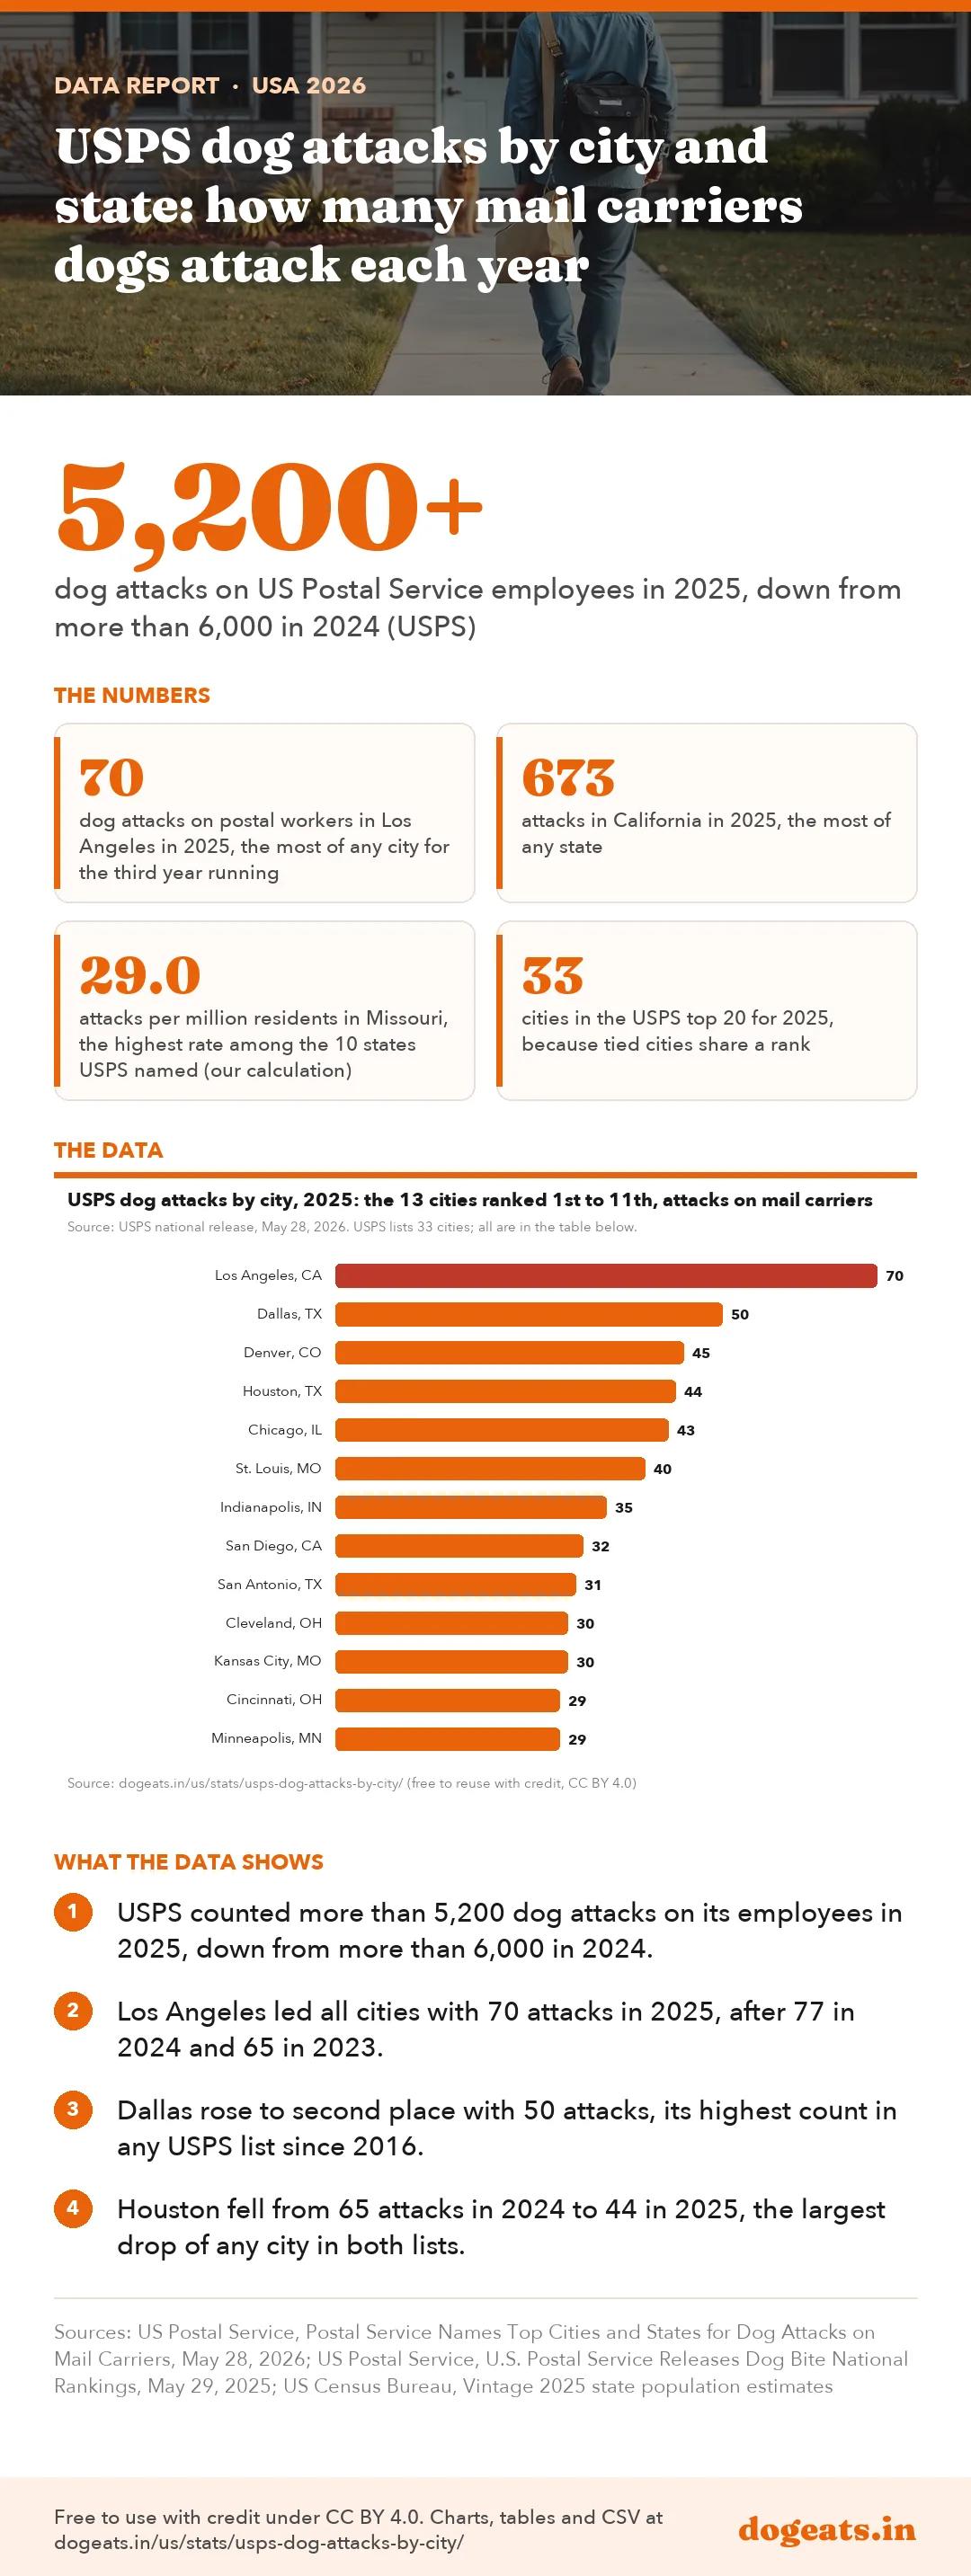
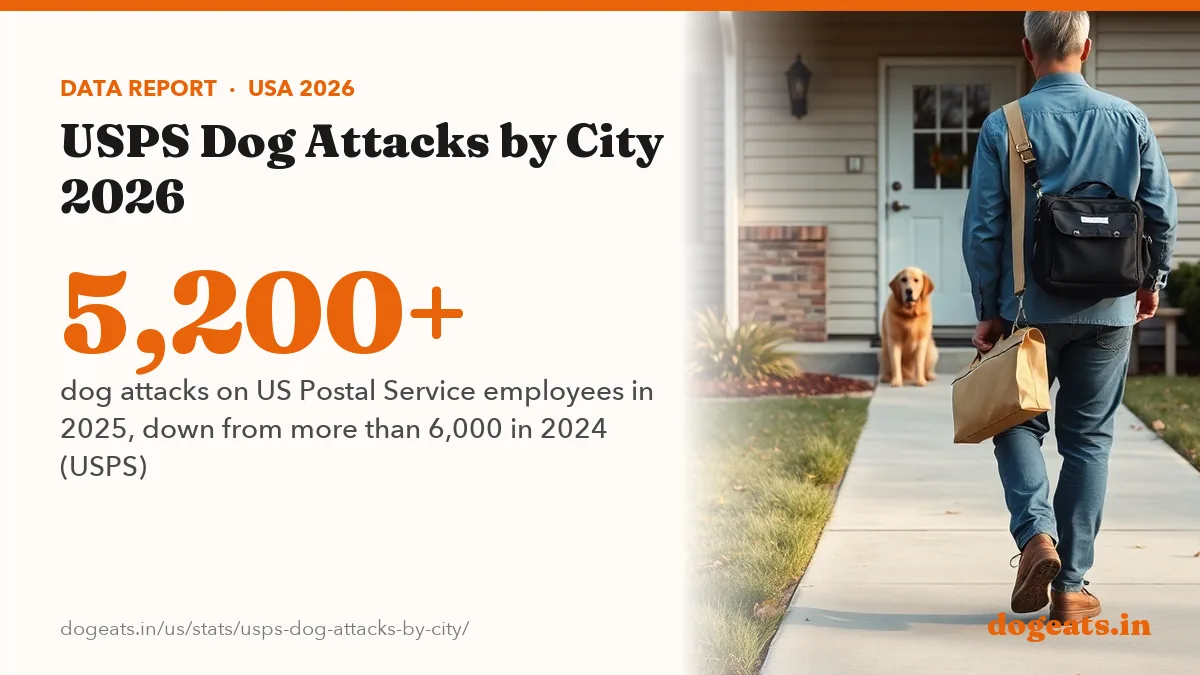
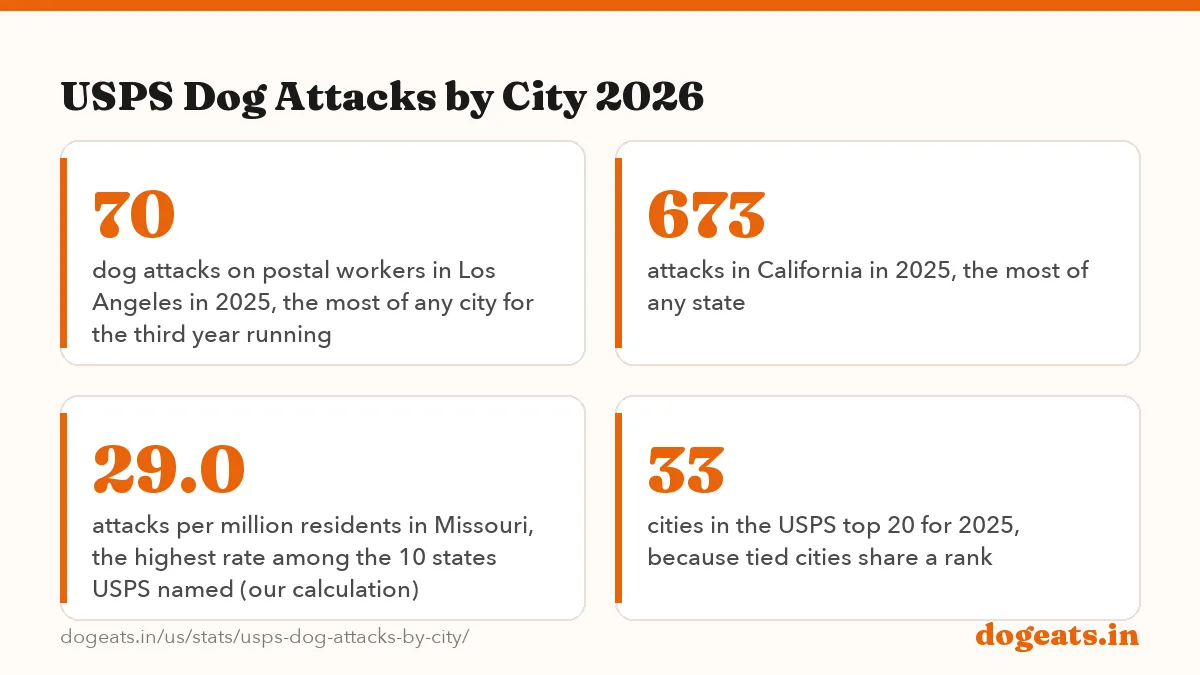
Dogs attacked more than 5,200 US Postal Service employees in 2025, down from more than 6,000 in 2024, according to USPS. Los Angeles had the most attacks of any city for the third year in a row, with 70. California led the states with 673, followed by Texas with 358 and Ohio with 287.

Key findings
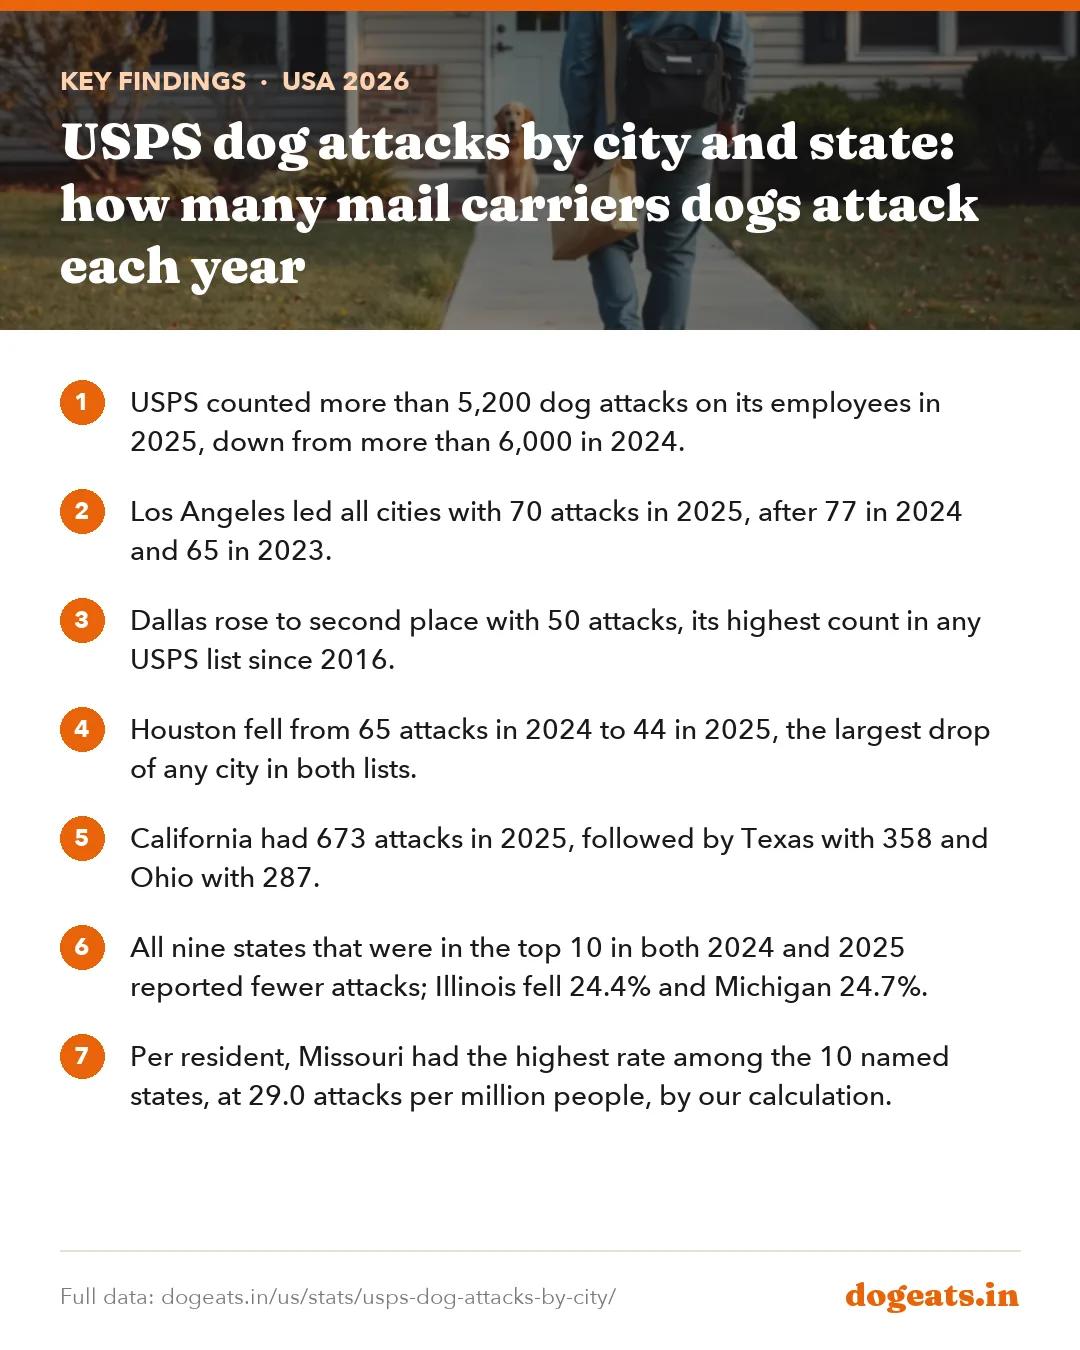
- USPS counted more than 5,200 dog attacks on its employees in 2025, down from more than 6,000 in 2024.
- Los Angeles led all cities with 70 attacks in 2025, after 77 in 2024 and 65 in 2023.
- Dallas rose to second place with 50 attacks, its highest count in any USPS list since 2016.
- Houston fell from 65 attacks in 2024 to 44 in 2025, the largest drop of any city in both lists.
- California had 673 attacks in 2025, followed by Texas with 358 and Ohio with 287.
- All nine states that were in the top 10 in both 2024 and 2025 reported fewer attacks; Illinois fell 24.4% and Michigan 24.7%.
- Per resident, Missouri had the highest rate among the 10 named states, at 29.0 attacks per million people, by our calculation.
- Seventeen cities appeared in every USPS city ranking from 2017 to 2025, including Los Angeles, Houston, Dallas and Chicago.
- USPS releases have revised or contradicted earlier figures, including California's 2020 count, listed as 782 and later as 787.
Which cities have the most USPS dog attacks?
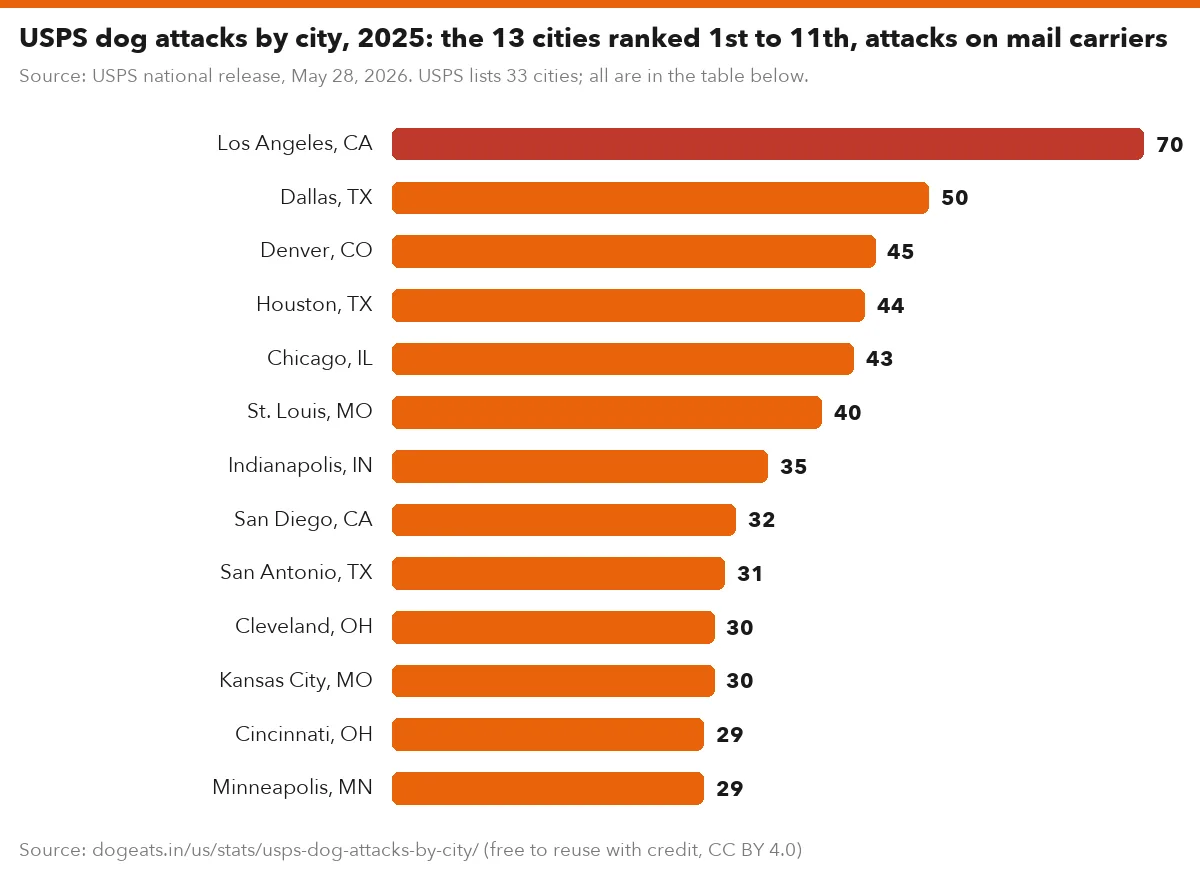
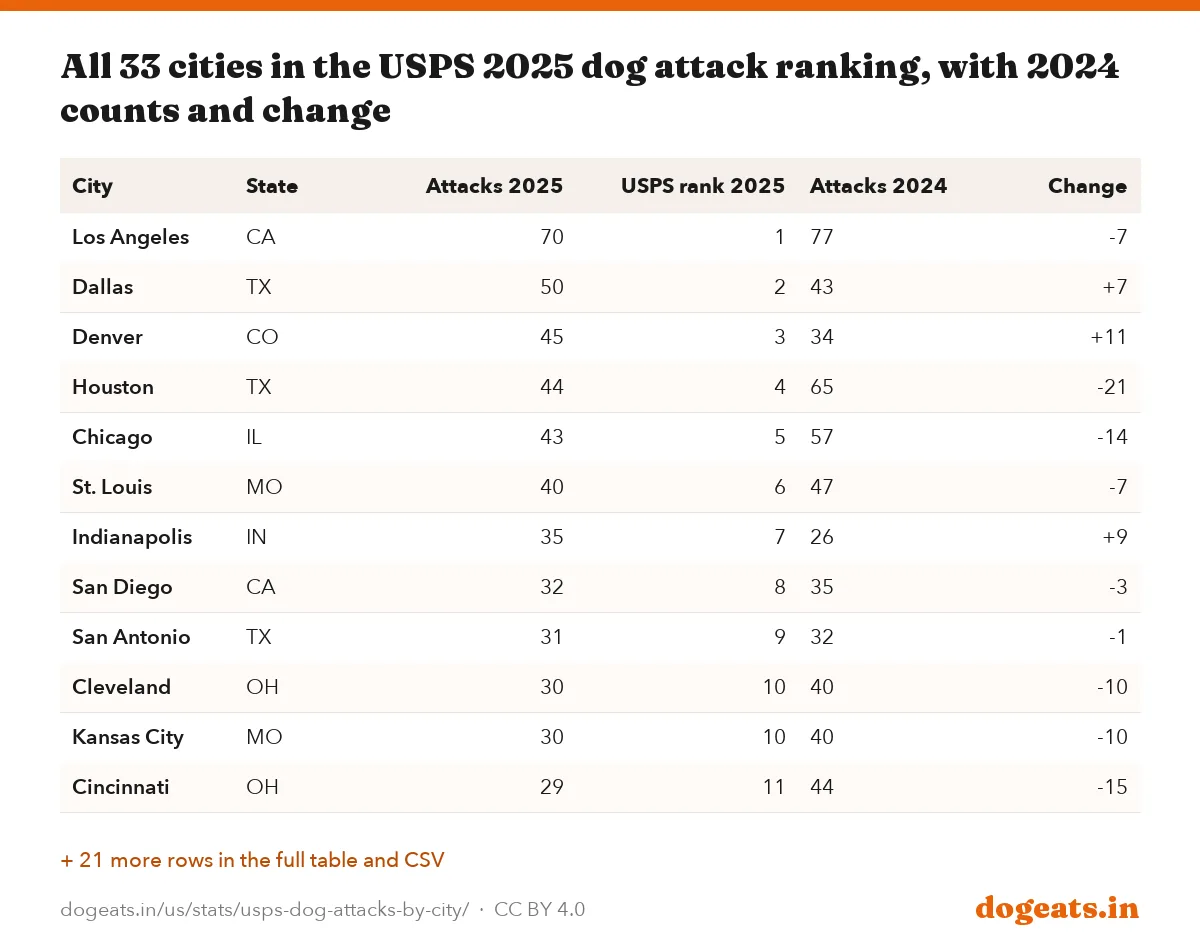
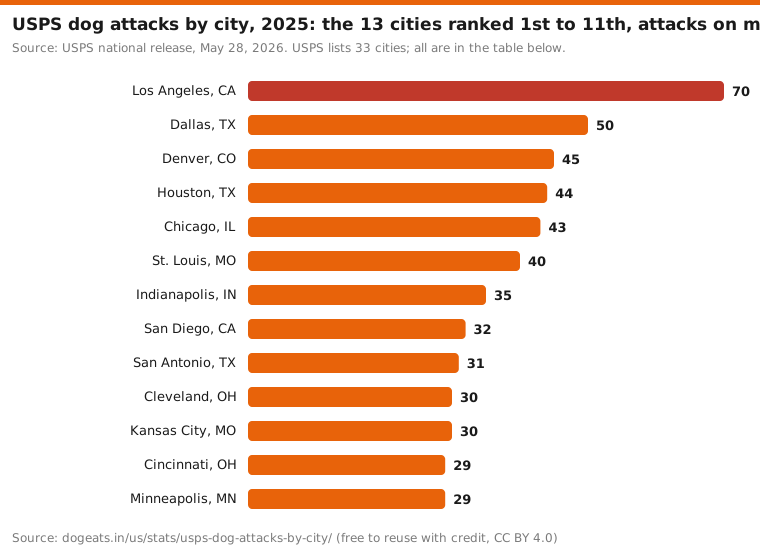
Los Angeles had the most dog attacks on postal employees in 2025, with 70. Dallas was second with 50, Denver third with 45, Houston fourth with 44 and Chicago fifth with 43.
USPS calls its list the top 20, but it holds 33 cities. Tied cities share a rank, so Cleveland and Kansas City, Missouri, are both 10th with 30 attacks.
The 33 cities together reported 922 attacks. That is under 18% of the national total of more than 5,200. Most attacks happen outside the big-city list.
Source: USPS national release, May 28, 2026. USPS lists 33 cities; all are in the table below.
Show the numbers
| Label | attacks |
|---|---|
| Los Angeles, CA | 70 |
| Dallas, TX | 50 |
| Denver, CO | 45 |
| Houston, TX | 44 |
| Chicago, IL | 43 |
| St. Louis, MO | 40 |
| Indianapolis, IN | 35 |
| San Diego, CA | 32 |
| San Antonio, TX | 31 |
| Cleveland, OH | 30 |
| Kansas City, MO | 30 |
| Cincinnati, OH | 29 |
| Minneapolis, MN | 29 |
Embed this chart
| City | State | Attacks 2025 | USPS rank 2025 | Attacks 2024 | Change |
|---|---|---|---|---|---|
| Los Angeles | CA | 70 | 1 | 77 | -7 |
| Dallas | TX | 50 | 2 | 43 | +7 |
| Denver | CO | 45 | 3 | 34 | +11 |
| Houston | TX | 44 | 4 | 65 | -21 |
| Chicago | IL | 43 | 5 | 57 | -14 |
| St. Louis | MO | 40 | 6 | 47 | -7 |
| Indianapolis | IN | 35 | 7 | 26 | +9 |
| San Diego | CA | 32 | 8 | 35 | -3 |
| San Antonio | TX | 31 | 9 | 32 | -1 |
| Cleveland | OH | 30 | 10 | 40 | -10 |
| Kansas City | MO | 30 | 10 | 40 | -10 |
| Cincinnati | OH | 29 | 11 | 44 | -15 |
| Minneapolis | MN | 29 | 11 | 30 | -1 |
| Oakland | CA | 27 | 12 | 18 | +9 |
| Phoenix | AZ | 27 | 12 | 25 | +2 |
| Columbus | OH | 26 | 13 | 32 | -6 |
| Detroit | MI | 24 | 14 | 32 | -8 |
| Louisville | KY | 23 | 15 | 24 | -1 |
| Memphis | TN | 21 | 16 | 25 | -4 |
| Oklahoma City | OK | 21 | 16 | 20 | +1 |
| Pittsburgh | PA | 21 | 16 | 17 | +4 |
| Sacramento | CA | 21 | 16 | 21 | +0 |
| Fort Worth | TX | 20 | 17 | 15 | +5 |
| Long Beach | CA | 20 | 17 | Not listed | |
| Milwaukee | WI | 20 | 17 | 20 | +0 |
| Philadelphia | PA | 20 | 17 | 32 | -12 |
| Portland | OR | 20 | 17 | Not listed | |
| Dayton | OH | 19 | 18 | Not listed | |
| Jacksonville | FL | 19 | 18 | Not listed | |
| Omaha | NE | 17 | 19 | 24 | -7 |
| Miami | FL | 16 | 20 | 17 | -1 |
| Rochester | NY | 16 | 20 | 23 | -7 |
| San Francisco | CA | 16 | 20 | 20 | -4 |
Eleven cities in the 2025 list had 20 attacks or fewer. The last three, Miami, Rochester and San Francisco, had 16 each.
Four cities joined the list in 2025 that were not in the 2024 list: Long Beach, Portland, Dayton and Jacksonville. Nine dropped out, including Toledo, El Paso, Albuquerque and Salt Lake City.
How many mail carriers are attacked by dogs each year?
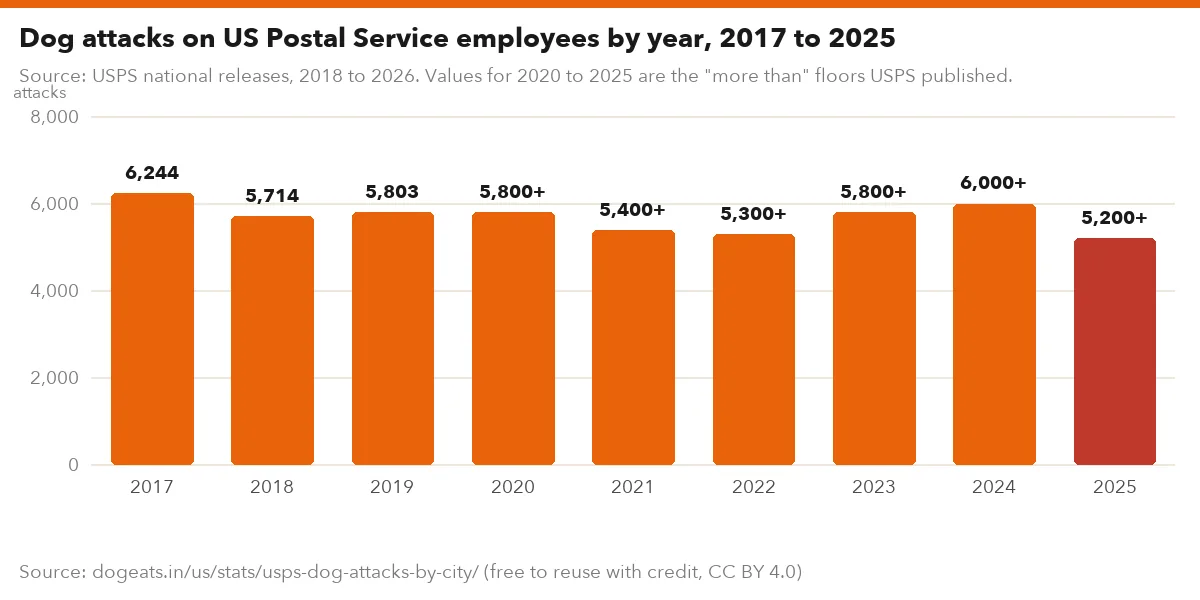
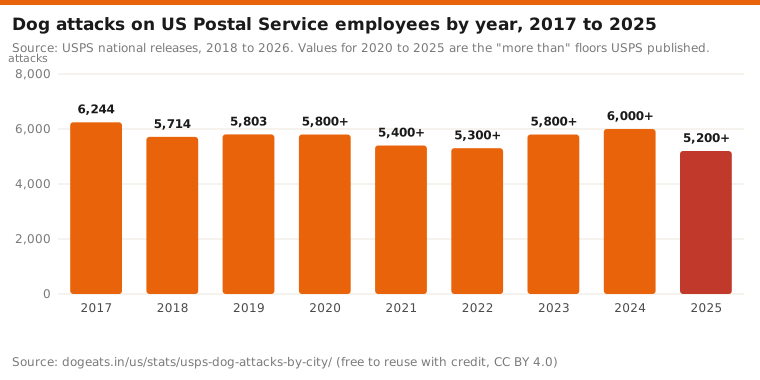
Dogs attacked more than 5,200 US Postal Service employees in 2025, USPS said in its national release of May 28, 2026. The year before, USPS put the count at more than 6,000.
USPS publishes one national figure a year, timed to its annual dog bite awareness campaign. Since 2017 the yearly figure has stayed between about 5,200 and 6,244.
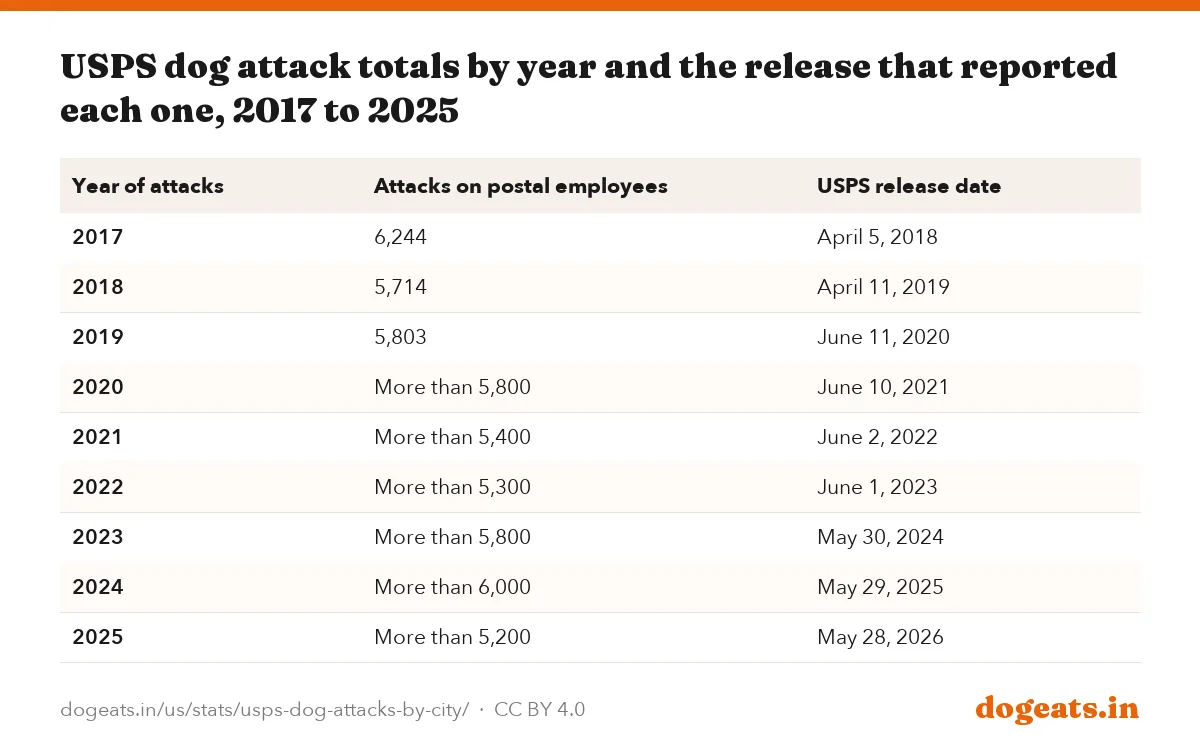
The most precise numbers come from the older releases. USPS gave exact counts of 6,244 for 2017, 5,714 for 2018 and 5,803 for 2019. Since 2020 it has given rounded figures with the words "more than."
Source: USPS national releases, 2018 to 2026. Values for 2020 to 2025 are the "more than" floors USPS published.
Show the numbers
| Label | attacks |
|---|---|
| 2017 | 6,244 |
| 2018 | 5,714 |
| 2019 | 5,803 |
| 2020 | 5,800+ |
| 2021 | 5,400+ |
| 2022 | 5,300+ |
| 2023 | 5,800+ |
| 2024 | 6,000+ |
| 2025 | 5,200+ |
Embed this chart
| Year of attacks | Attacks on postal employees | USPS release date |
|---|---|---|
| 2017 | 6,244 | April 5, 2018 |
| 2018 | 5,714 | April 11, 2019 |
| 2019 | 5,803 | June 11, 2020 |
| 2020 | More than 5,800 | June 10, 2021 |
| 2021 | More than 5,400 | June 2, 2022 |
| 2022 | More than 5,300 | June 1, 2023 |
| 2023 | More than 5,800 | May 30, 2024 |
| 2024 | More than 6,000 | May 29, 2025 |
| 2025 | More than 5,200 | May 28, 2026 |
The 14-a-day average is our division of 5,200 by 365. Because USPS gives a floor, the true daily average is a little higher.
The 2018 release said 2017's 6,244 was more than 500 fewer than in 2016. That puts 2016 above 6,700, but USPS did not print the exact 2016 total in the releases we opened.
Houston fell and Denver rose between 2024 and 2025
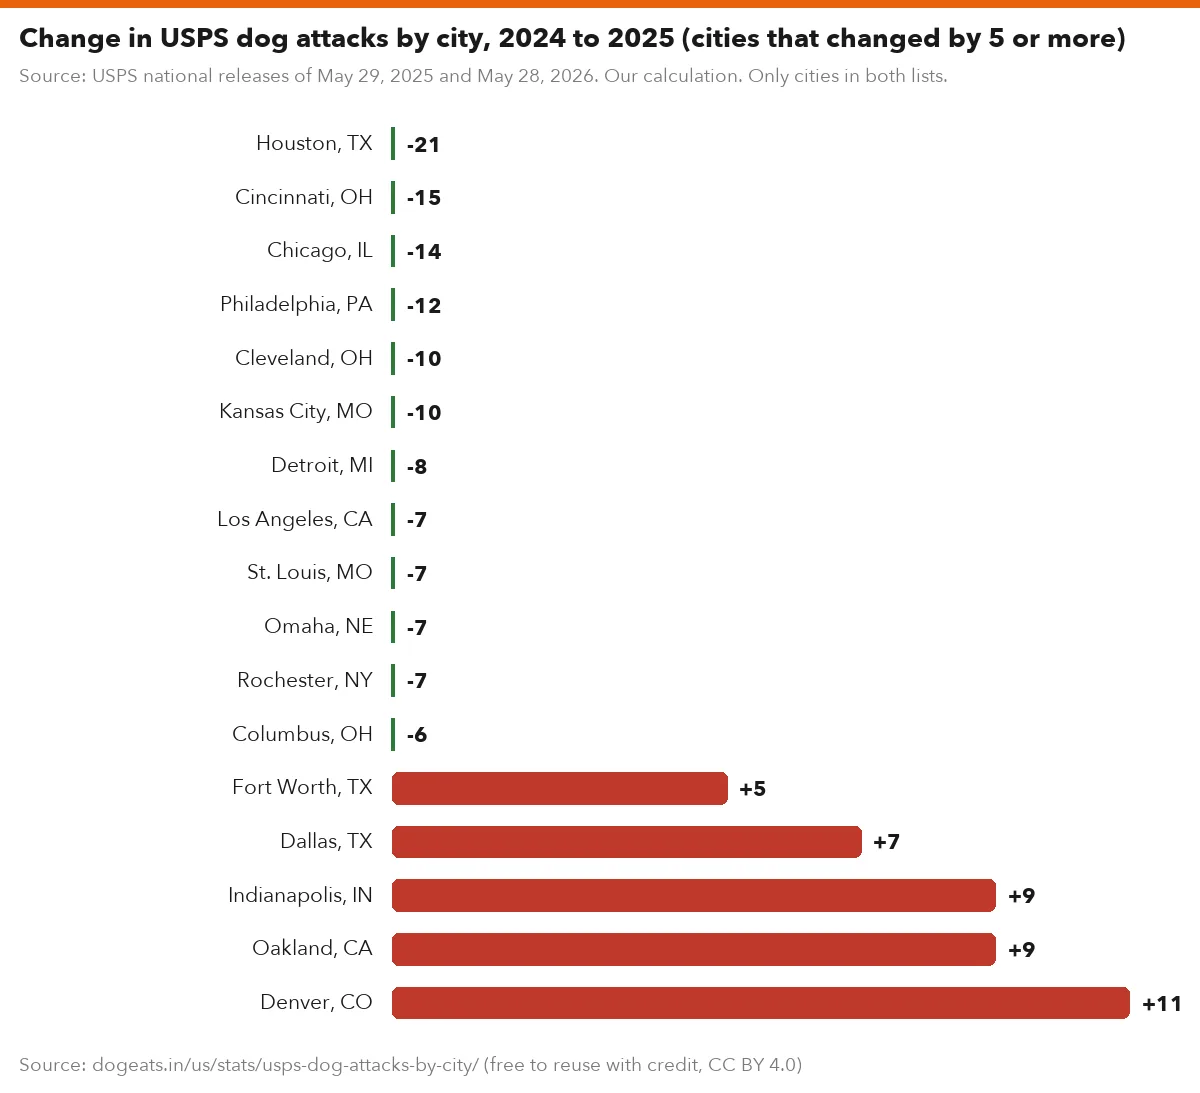
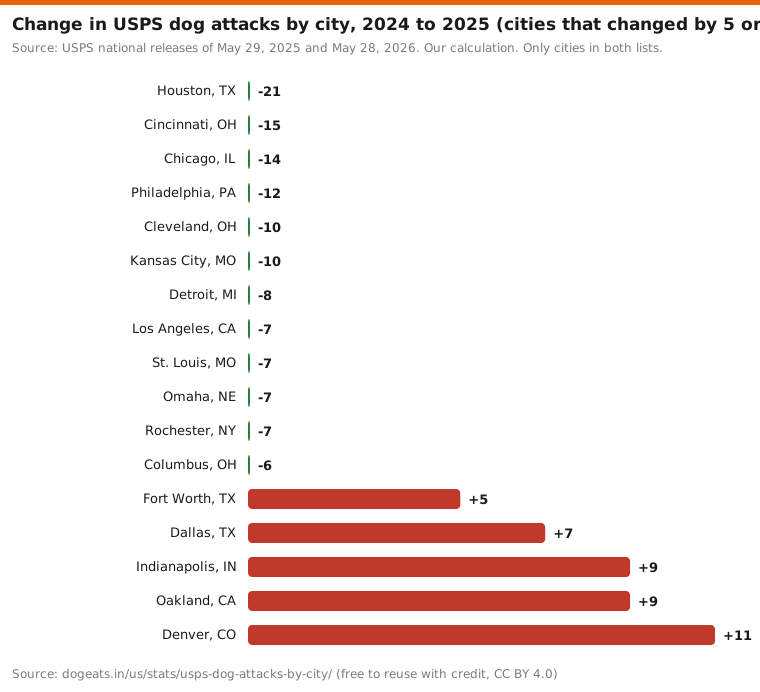
Of the 29 cities that appear in both the 2024 and 2025 lists, 19 reported fewer attacks, 8 reported more and 2 stayed level.
Houston had the biggest fall, from 65 attacks to 44. Cincinnati dropped from 44 to 29 and Chicago from 57 to 43.
Denver had the biggest rise, from 34 to 45, which moved it up to third place. Indianapolis went from 26 to 35, Oakland from 18 to 27 and Dallas from 43 to 50.
Source: USPS national releases of May 29, 2025 and May 28, 2026. Our calculation. Only cities in both lists.
Show the numbers
| Label | attacks |
|---|---|
| Houston, TX | -21 |
| Cincinnati, OH | -15 |
| Chicago, IL | -14 |
| Philadelphia, PA | -12 |
| Cleveland, OH | -10 |
| Kansas City, MO | -10 |
| Detroit, MI | -8 |
| Los Angeles, CA | -7 |
| St. Louis, MO | -7 |
| Omaha, NE | -7 |
| Rochester, NY | -7 |
| Columbus, OH | -6 |
| Fort Worth, TX | +5 |
| Dallas, TX | +7 |
| Indianapolis, IN | +9 |
| Oakland, CA | +9 |
| Denver, CO | +11 |
Embed this chart
Year-to-year swings of 10 or 20 attacks are common in this data. A city's count is small, so a few incidents can move it several places.
Los Angeles has topped the list three years running
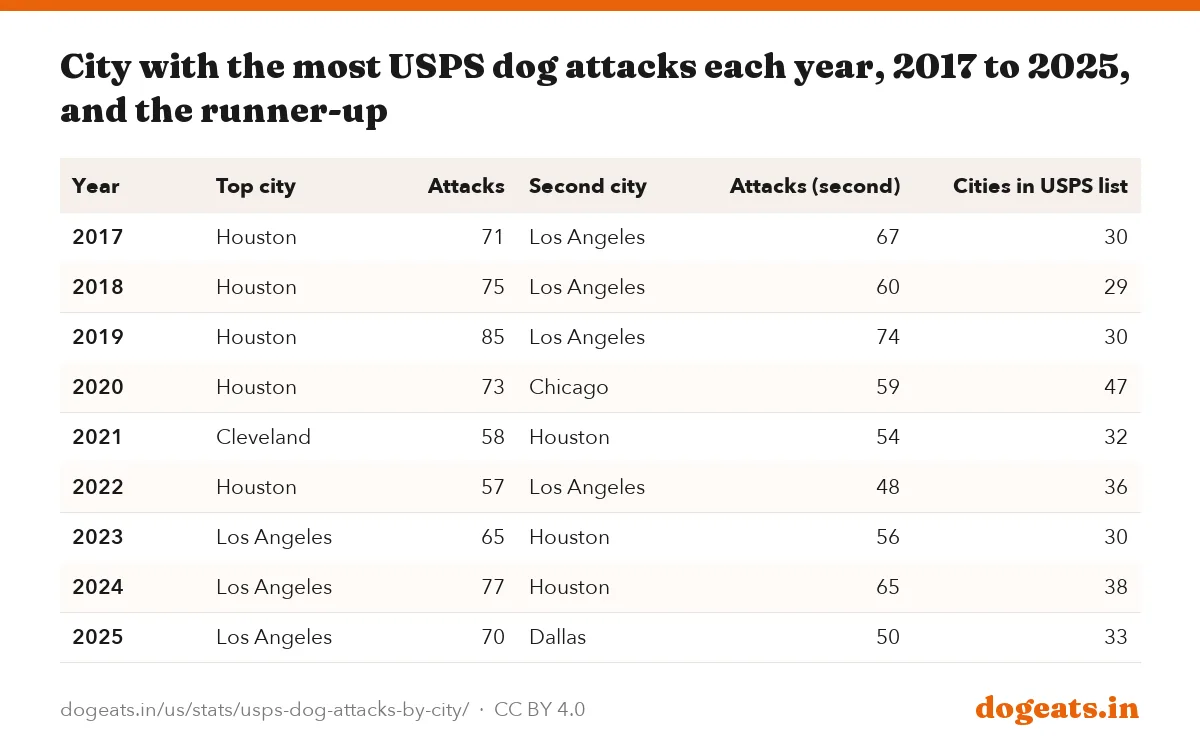
Los Angeles led the USPS city ranking in 2023, 2024 and 2025. Before that, Houston led in every year from 2017 to 2020 and again in 2022, and Cleveland led in 2021 with 58.
Houston's peak was 85 attacks in 2019, the highest single-city count in any release we opened. Its 44 attacks in 2025 were its lowest in that period.
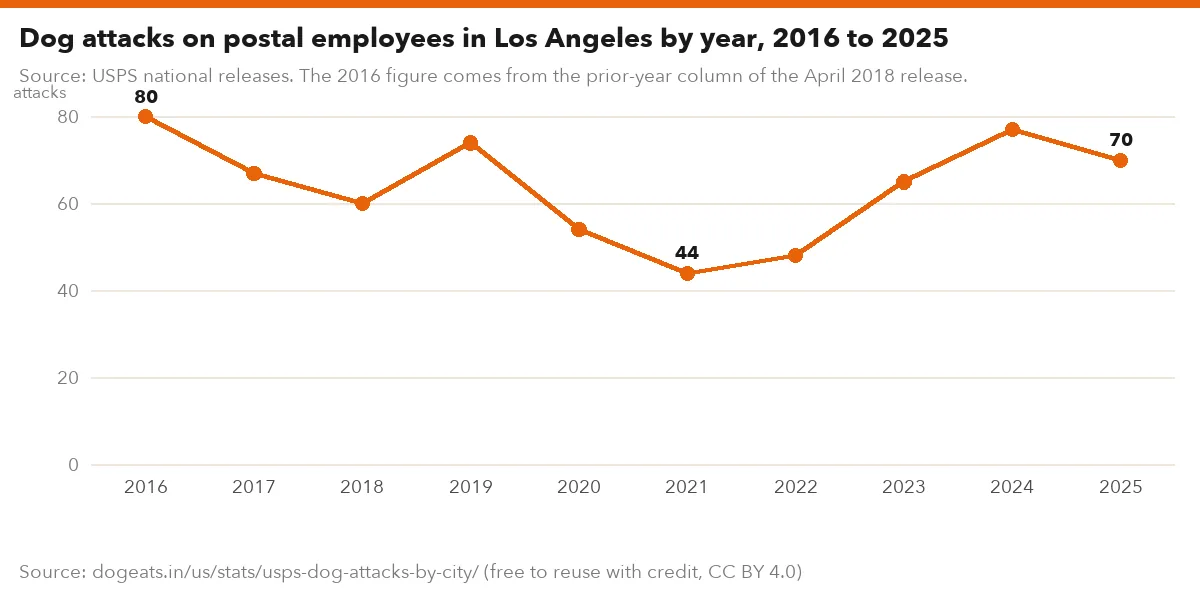
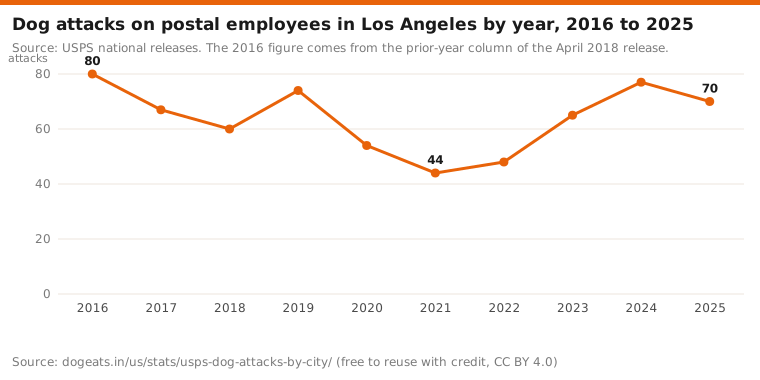
Los Angeles counts have moved in a wide band. They fell from 80 in 2016 to 44 in 2021, then climbed back to 77 in 2024.
Source: USPS national releases. The 2016 figure comes from the prior-year column of the April 2018 release.
Show the numbers
| Label | attacks |
|---|---|
| 2016 | 80 |
| 2017 | 67 |
| 2018 | 60 |
| 2019 | 74 |
| 2020 | 54 |
| 2021 | 44 |
| 2022 | 48 |
| 2023 | 65 |
| 2024 | 77 |
| 2025 | 70 |
Embed this chart
| Year | Top city | Attacks | Second city | Attacks (second) | Cities in USPS list |
|---|---|---|---|---|---|
| 2017 | Houston | 71 | Los Angeles | 67 | 30 |
| 2018 | Houston | 75 | Los Angeles | 60 | 29 |
| 2019 | Houston | 85 | Los Angeles | 74 | 30 |
| 2020 | Houston | 73 | Chicago | 59 | 47 |
| 2021 | Cleveland | 58 | Houston | 54 | 32 |
| 2022 | Houston | 57 | Los Angeles | 48 | 36 |
| 2023 | Los Angeles | 65 | Houston | 56 | 30 |
| 2024 | Los Angeles | 77 | Houston | 65 | 38 |
| 2025 | Los Angeles | 70 | Dallas | 50 | 33 |
| City | 2016 | 2017 | 2018 | 2019 | 2020 | 2021 | 2022 | 2023 | 2024 | 2025 |
|---|---|---|---|---|---|---|---|---|---|---|
| Los Angeles, CA | 80 | 67 | 60 | 74 | 54 | 44 | 48 | 65 | 77 | 70 |
| Houston, TX | 62 | 71 | 75 | 85 | 73 | 54 | 57 | 56 | 65 | 44 |
| Dallas, TX | 41 | 40 | 49 | 40 | 38 | 38 | 44 | 39 | 43 | 50 |
| Chicago, IL | 46 | 38 | 37 | 54 | 59 | 35 | 36 | 48 | 57 | 43 |
| Denver, CO | 47 | 35 | 31 | 30 | 44 | 29 | 19 | 21 | 34 | 45 |
| St. Louis, MO | 31 | 52 | 30 | 22 | 28 | 36 | 34 | 46 | 47 | 40 |
| Cleveland, OH | 60 | 49 | 50 | 51 | 46 | 58 | 43 | 44 | 40 | 30 |
| San Diego, CA | 57 | 46 | 33 | 29 | 35 | 31 | 39 | 41 | 35 | 32 |
| San Antonio, TX | 42 | 44 | 47 | 28 | 36 | 30 | 32 | 26 | 32 | 31 |
| Kansas City, MO | 30 | 32 | 31 | 25 | 32 | 48 | 33 | 32 | 40 | 30 |
| Cincinnati, OH | 24 | 25 | 24 | 26 | 26 | 25 | 22 | 38 | 44 | 29 |
| Columbus, OH | 39 | 43 | 37 | 35 | 37 | 31 | 23 | 33 | 32 | 26 |
| Detroit, MI | 48 | 32 | 34 | 26 | 35 | 34 | 30 | 19 | 32 | 24 |
| Philadelphia, PA | 40 | 27 | 51 | 34 | 26 | 32 | 28 | 34 | 32 | 20 |
| Minneapolis, MN | 43 | 27 | 38 | 20 | 22 | 22 | 22 | 27 | 30 | 29 |
| Louisville, KY | 51 | 39 | 23 | 28 | 34 | 42 | 26 | 28 | 24 | 23 |
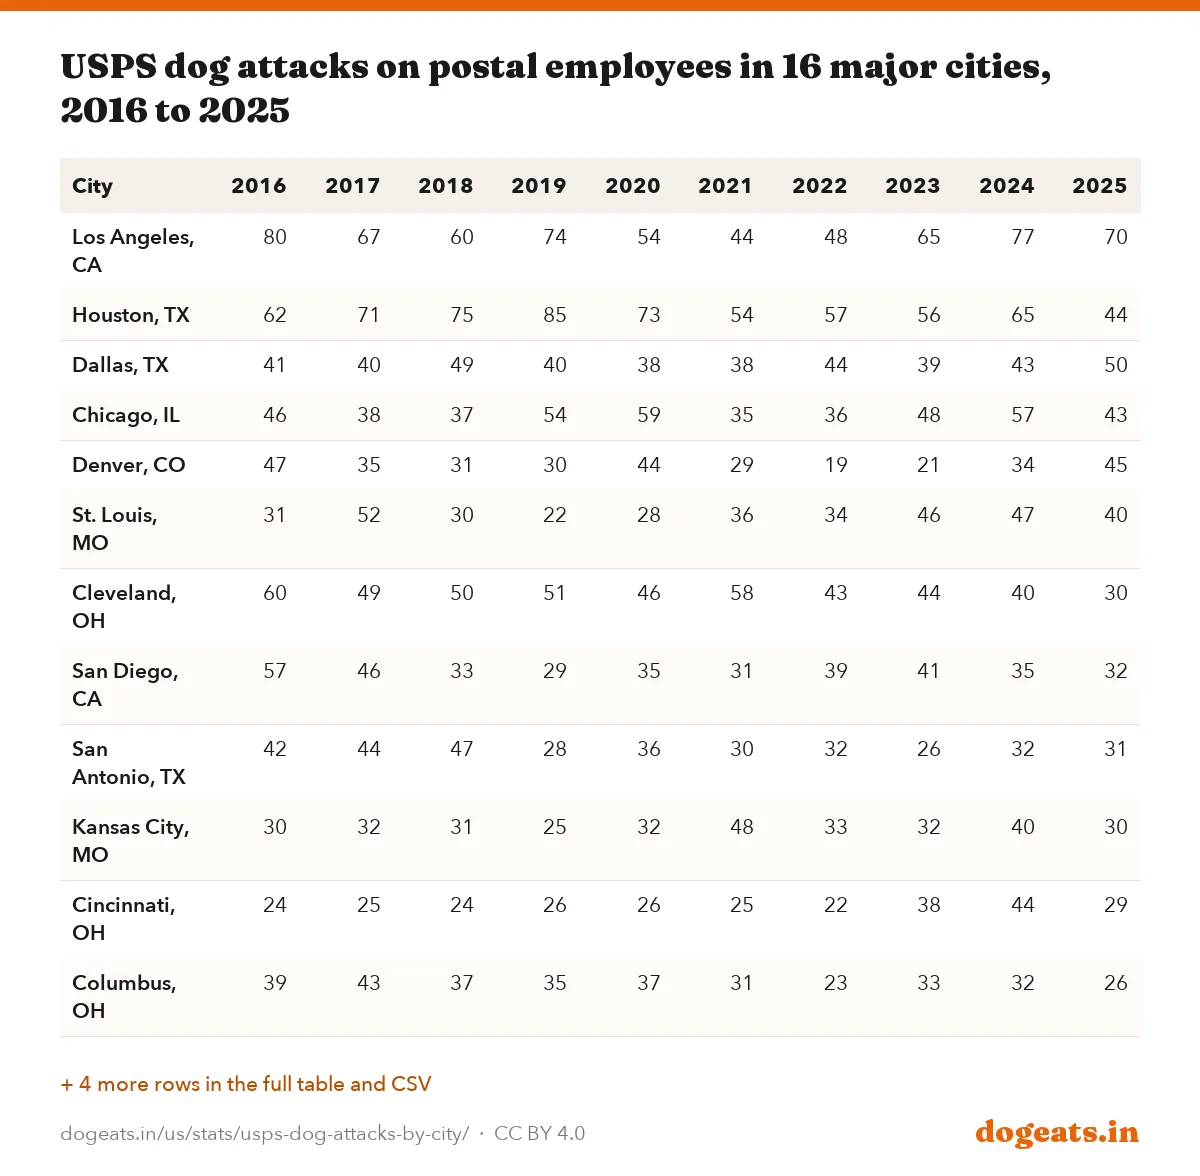
Blank cells mean the city was not in that year's USPS list, so its count was not published. The 2016 column covers only cities that made the 2017 list.
Seventeen cities appear in every USPS list from 2017 to 2025. Cleveland's count has halved, from 60 in 2016 to 30 in 2025.
California, Ohio and Texas fill the city list
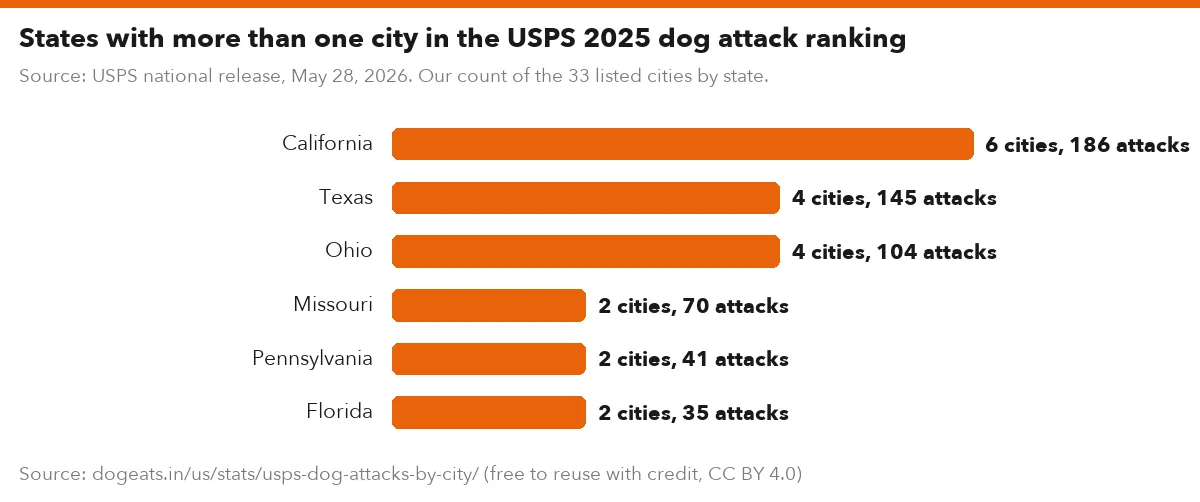
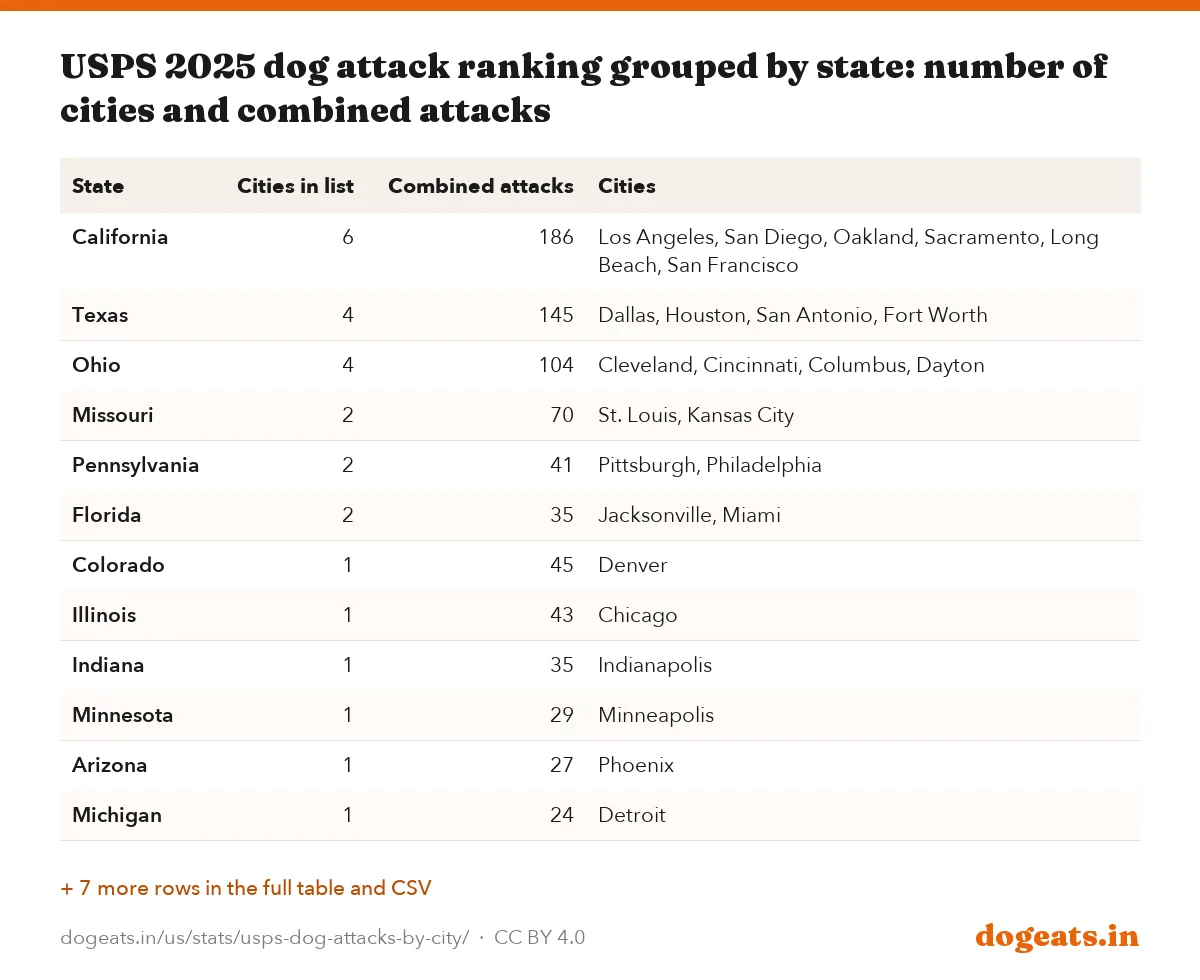
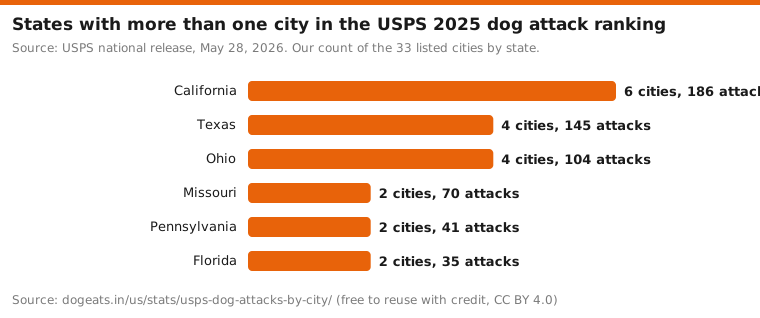
Six of the 33 cities in the 2025 list are in California: Los Angeles, San Diego, Oakland, Sacramento, Long Beach and San Francisco. Together they reported 186 attacks.
Ohio and Texas have four cities each. The Texas four (Dallas, Houston, San Antonio and Fort Worth) reported 145 attacks. The Ohio four (Cleveland, Cincinnati, Columbus and Dayton) reported 104.
Denver is the odd one out. It ranked third among cities, but Colorado was not among the 10 states with the most attacks.
Source: USPS national release, May 28, 2026. Our count of the 33 listed cities by state.
Show the numbers
| Label | cities |
|---|---|
| California | 6 cities, 186 attacks |
| Texas | 4 cities, 145 attacks |
| Ohio | 4 cities, 104 attacks |
| Missouri | 2 cities, 70 attacks |
| Pennsylvania | 2 cities, 41 attacks |
| Florida | 2 cities, 35 attacks |
Embed this chart
| State | Cities in list | Combined attacks | Cities |
|---|---|---|---|
| California | 6 | 186 | Los Angeles, San Diego, Oakland, Sacramento, Long Beach, San Francisco |
| Texas | 4 | 145 | Dallas, Houston, San Antonio, Fort Worth |
| Ohio | 4 | 104 | Cleveland, Cincinnati, Columbus, Dayton |
| Missouri | 2 | 70 | St. Louis, Kansas City |
| Pennsylvania | 2 | 41 | Pittsburgh, Philadelphia |
| Florida | 2 | 35 | Jacksonville, Miami |
| Colorado | 1 | 45 | Denver |
| Illinois | 1 | 43 | Chicago |
| Indiana | 1 | 35 | Indianapolis |
| Minnesota | 1 | 29 | Minneapolis |
| Arizona | 1 | 27 | Phoenix |
| Michigan | 1 | 24 | Detroit |
| Kentucky | 1 | 23 | Louisville |
| Tennessee | 1 | 21 | Memphis |
| Oklahoma | 1 | 21 | Oklahoma City |
| Wisconsin | 1 | 20 | Milwaukee |
| Oregon | 1 | 20 | Portland |
| Nebraska | 1 | 17 | Omaha |
| New York | 1 | 16 | Rochester |
Which states have the most dog attacks on mail carriers?
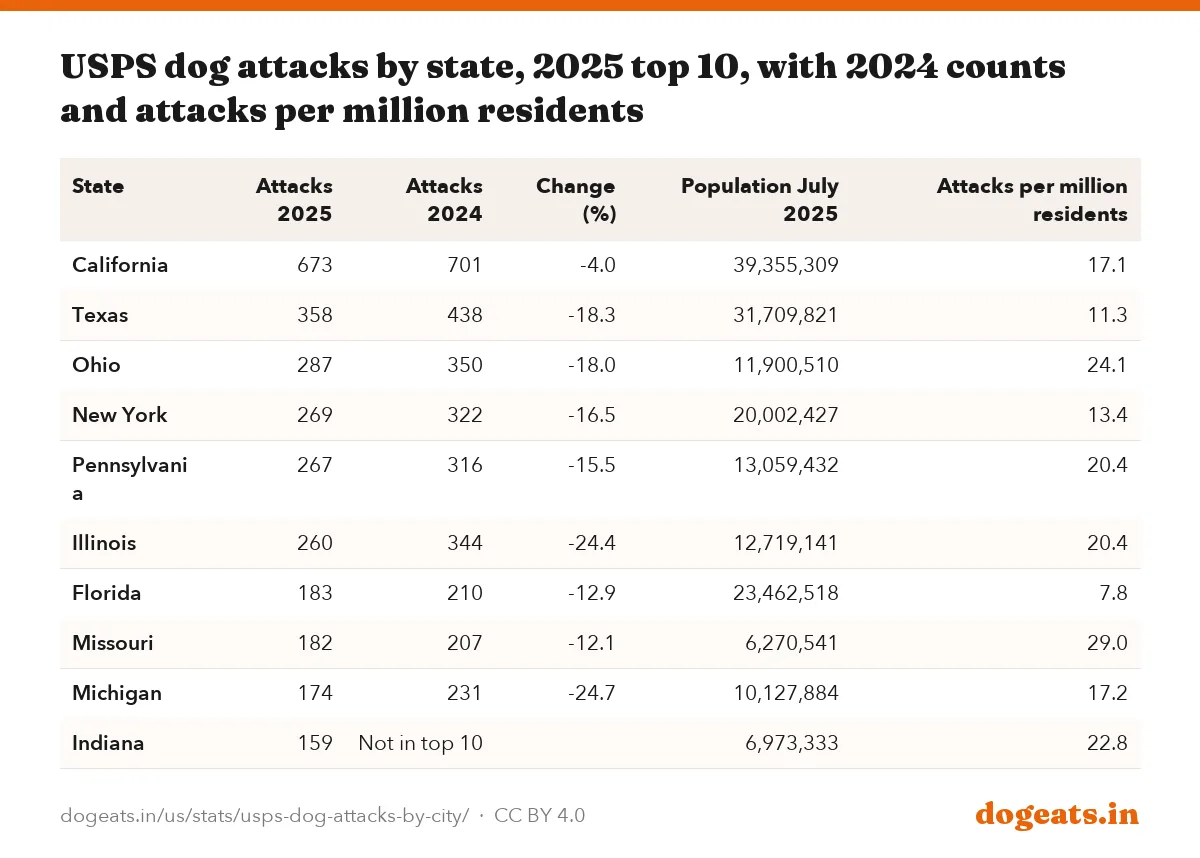
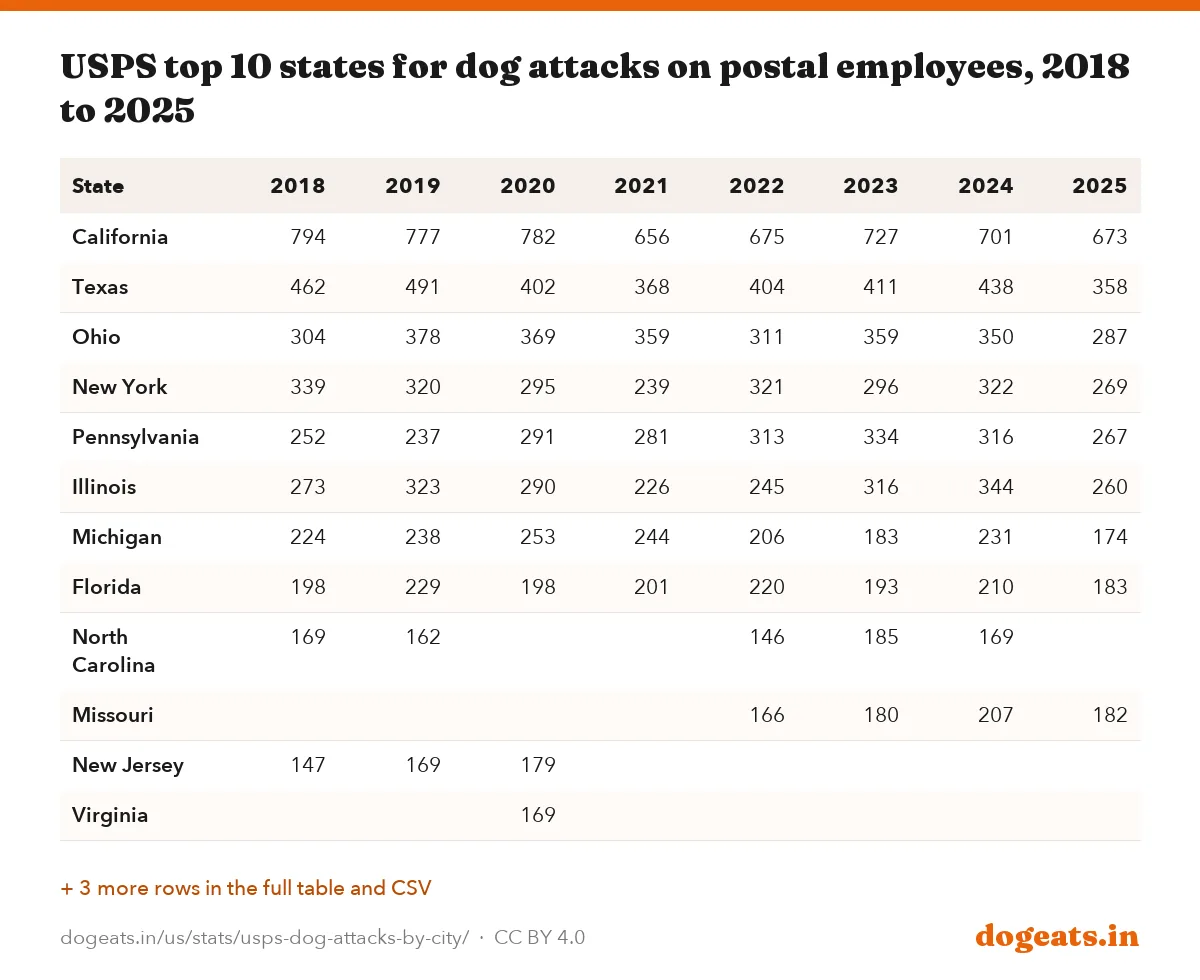
California had 673 dog attacks on postal employees in 2025, the most of any state. Texas had 358, Ohio 287, New York 269 and Pennsylvania 267.
Illinois (260), Florida (183), Missouri (182), Michigan (174) and Indiana (159) completed the top 10. Indiana replaced North Carolina, which was 10th in 2024 with 169.
The 10 states together reported 2,812 attacks in 2025, down from 3,288 for the 2024 top 10. Every state that was in both lists reported fewer attacks.
| State | Attacks 2025 | Attacks 2024 | Change (%) | Population July 2025 | Attacks per million residents |
|---|---|---|---|---|---|
| California | 673 | 701 | -4.0 | 39,355,309 | 17.1 |
| Texas | 358 | 438 | -18.3 | 31,709,821 | 11.3 |
| Ohio | 287 | 350 | -18.0 | 11,900,510 | 24.1 |
| New York | 269 | 322 | -16.5 | 20,002,427 | 13.4 |
| Pennsylvania | 267 | 316 | -15.5 | 13,059,432 | 20.4 |
| Illinois | 260 | 344 | -24.4 | 12,719,141 | 20.4 |
| Florida | 183 | 210 | -12.9 | 23,462,518 | 7.8 |
| Missouri | 182 | 207 | -12.1 | 6,270,541 | 29.0 |
| Michigan | 174 | 231 | -24.7 | 10,127,884 | 17.2 |
| Indiana | 159 | Not in top 10 | 6,973,333 | 22.8 |
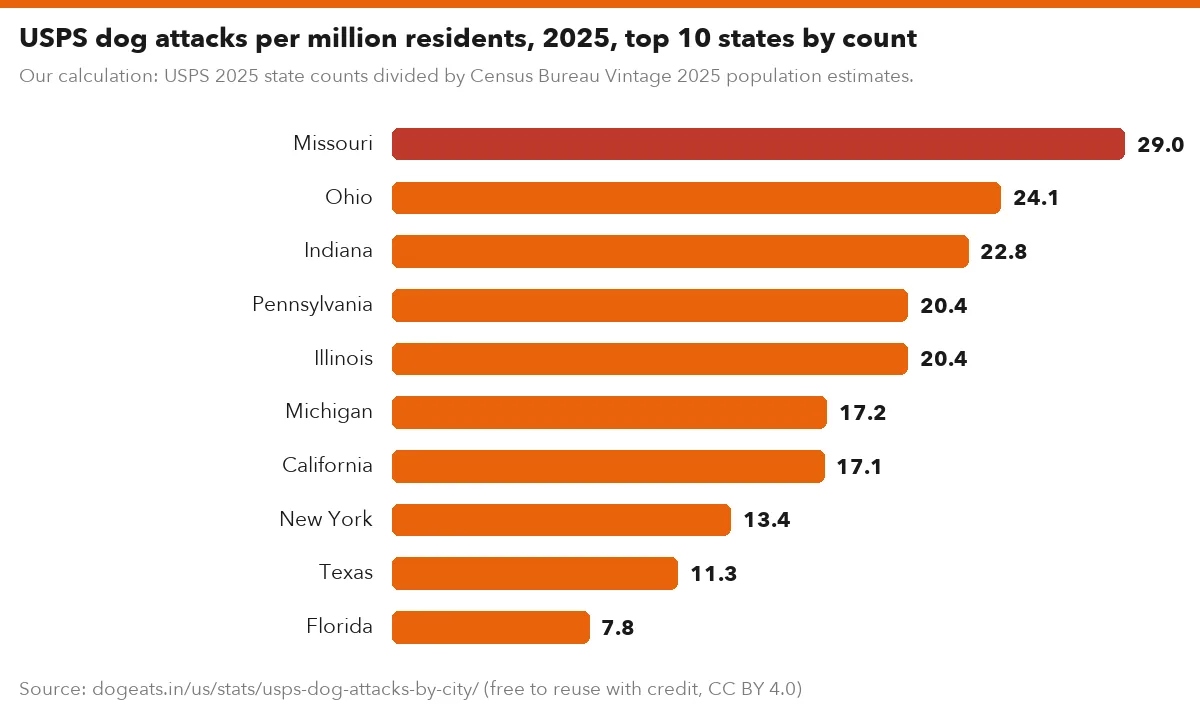
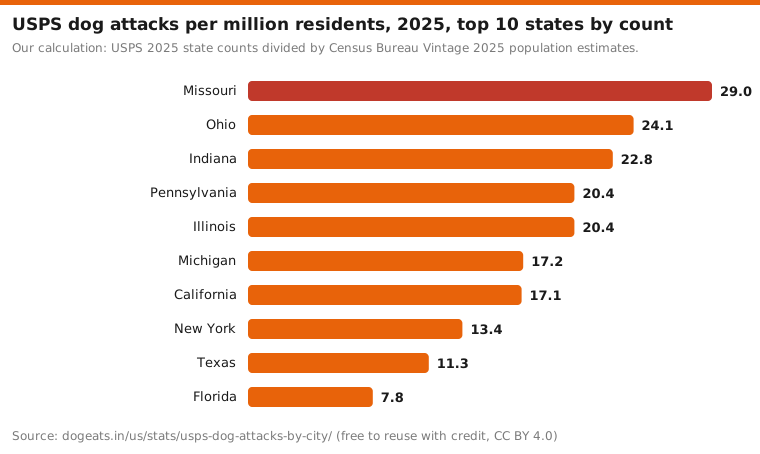
Our calculation: USPS 2025 state counts divided by Census Bureau Vintage 2025 population estimates.
Show the numbers
| Label | per million |
|---|---|
| Missouri | 29.0 |
| Ohio | 24.1 |
| Indiana | 22.8 |
| Pennsylvania | 20.4 |
| Illinois | 20.4 |
| Michigan | 17.2 |
| California | 17.1 |
| New York | 13.4 |
| Texas | 11.3 |
| Florida | 7.8 |
Embed this chart
Raw counts favor big states, so we divided each count by the state's July 2025 population from the Census Bureau. Missouri had the highest rate at 29.0 attacks per million residents, then Ohio at 24.1 and Indiana at 22.8.
Florida had the lowest rate of the 10, at 7.8 per million. Texas had 11.3 and California 17.1. Nationally, more than 5,200 attacks works out to at least 15.2 per million people.
USPS does not publish counts for the other 40 states and DC in its national release. Some local releases do: Mississippi had 48 attacks in 2025, or 16.2 per million residents.
California has led every year since at least 2018
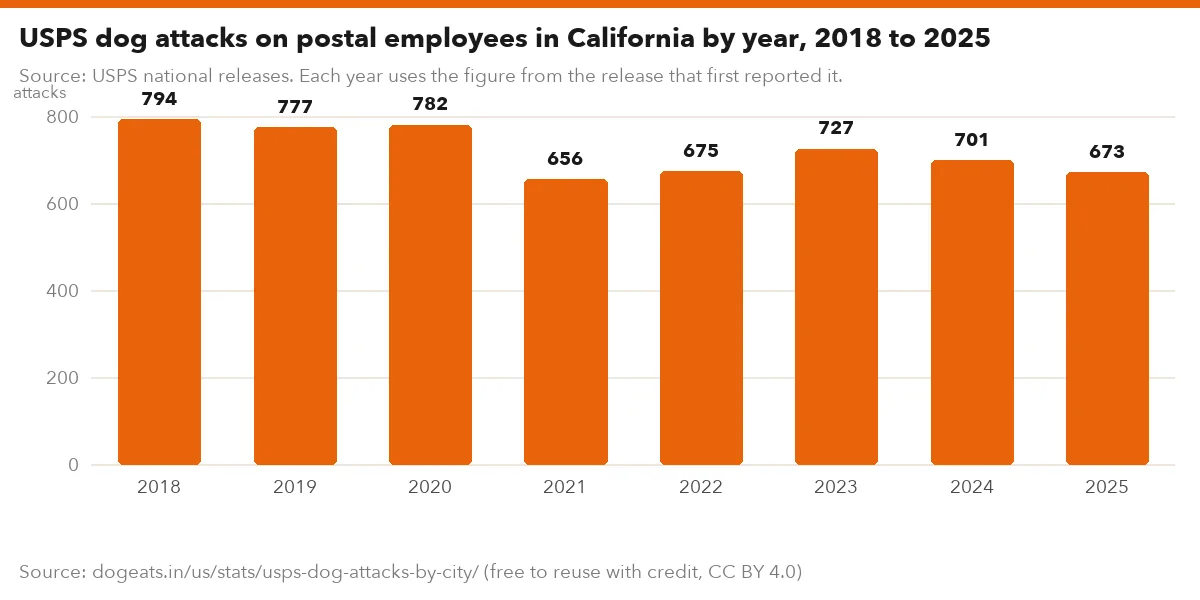
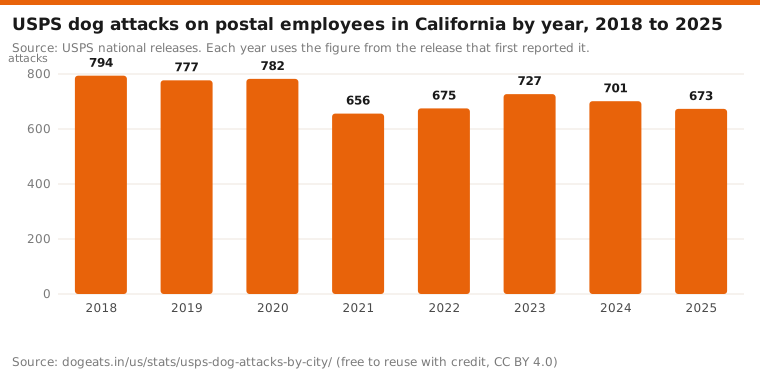
California has topped the USPS state list in every release we opened, with between 656 and 794 attacks a year from 2018 to 2025. Its 2025 count of 673 was 4.0% below 2024.
Texas has been second every year in this period. Its highest count was 491 in 2019 and its lowest was 358 in 2025.
Ohio has been in the top five every year. Its 287 attacks in 2025 were its lowest count in this series.
Source: USPS national releases. Each year uses the figure from the release that first reported it.
Show the numbers
| Label | attacks |
|---|---|
| 2018 | 794 |
| 2019 | 777 |
| 2020 | 782 |
| 2021 | 656 |
| 2022 | 675 |
| 2023 | 727 |
| 2024 | 701 |
| 2025 | 673 |
Embed this chart
| State | 2018 | 2019 | 2020 | 2021 | 2022 | 2023 | 2024 | 2025 |
|---|---|---|---|---|---|---|---|---|
| California | 794 | 777 | 782 | 656 | 675 | 727 | 701 | 673 |
| Texas | 462 | 491 | 402 | 368 | 404 | 411 | 438 | 358 |
| Ohio | 304 | 378 | 369 | 359 | 311 | 359 | 350 | 287 |
| New York | 339 | 320 | 295 | 239 | 321 | 296 | 322 | 269 |
| Pennsylvania | 252 | 237 | 291 | 281 | 313 | 334 | 316 | 267 |
| Illinois | 273 | 323 | 290 | 226 | 245 | 316 | 344 | 260 |
| Michigan | 224 | 238 | 253 | 244 | 206 | 183 | 231 | 174 |
| Florida | 198 | 229 | 198 | 201 | 220 | 193 | 210 | 183 |
| North Carolina | 169 | 162 | 146 | 185 | 169 | |||
| Missouri | 166 | 180 | 207 | 182 | ||||
| New Jersey | 147 | 169 | 179 | |||||
| Virginia | 169 | |||||||
| Indiana | 159 | |||||||
| Washington | 139 | |||||||
| Kentucky | 123 |
A blank cell means the state was not in that year's top 10. The 2018 column comes from the June 2020 release, because the April 2019 release had no state table.
Fifteen states have made at least one top 10 list since 2018 in the releases we used. Eight (California, Texas, Ohio, Pennsylvania, Illinois, New York, Florida and Michigan) made all eight.
USPS releases do not always agree with each other
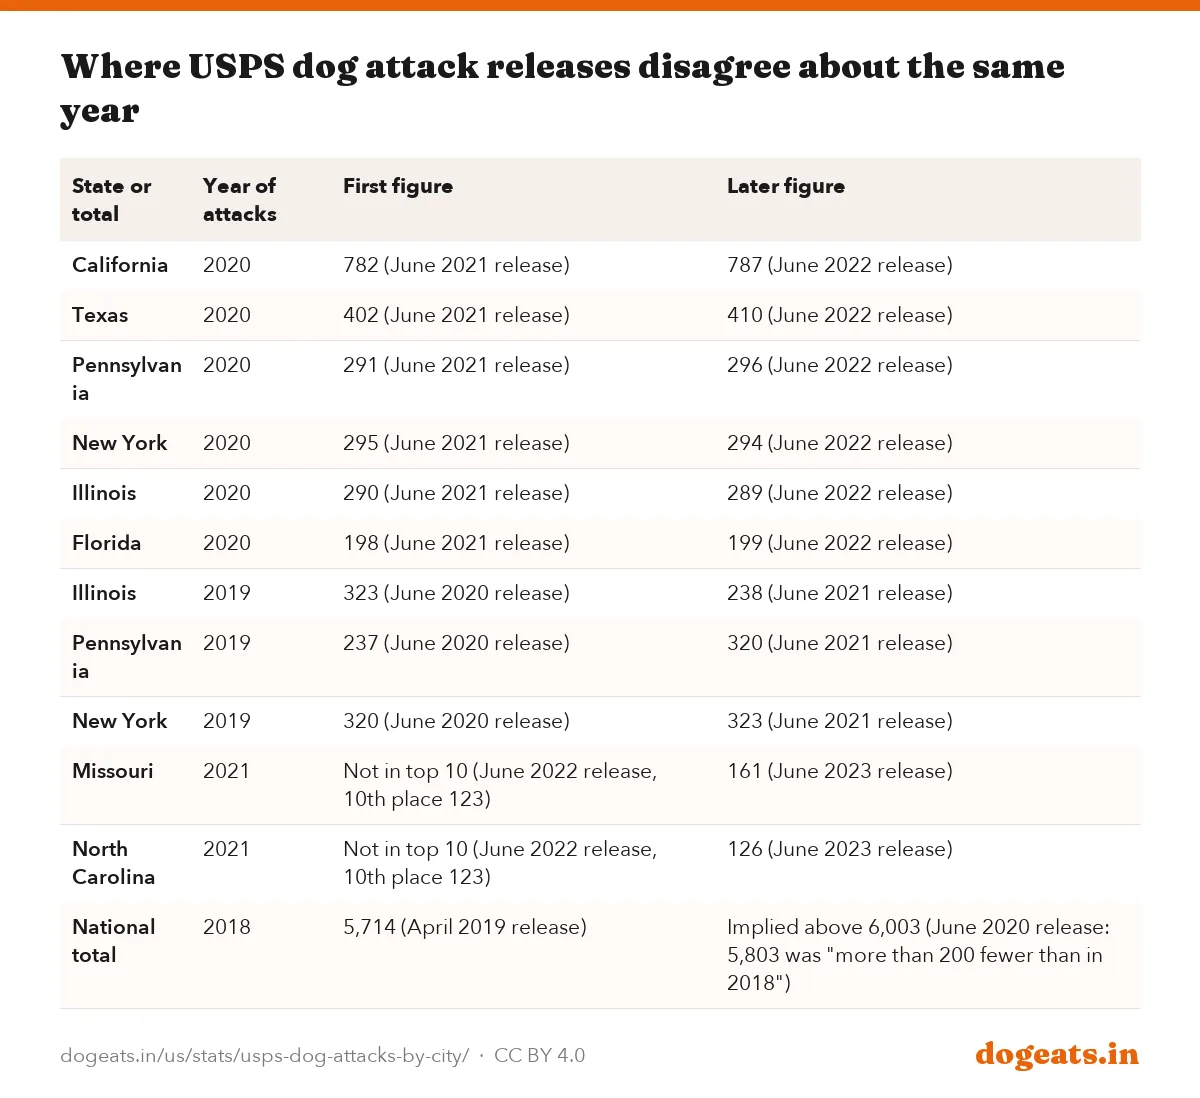
USPS state tables sometimes change from one release to the next. The June 2021 release put California's 2020 count at 782. The June 2022 release put the same year at 787.
Some differences look like errors rather than revisions. The June 2020 release gave Illinois 323 attacks in 2019. The June 2021 release listed 238 for Illinois in 2019 and 320 for Pennsylvania, which had been 237.
The national figures also clash. The April 2019 release said 5,714 employees were attacked in 2018. The June 2020 release said 2019's 5,803 was more than 200 fewer than in 2018.
| State or total | Year of attacks | First figure | Later figure |
|---|---|---|---|
| California | 2020 | 782 (June 2021 release) | 787 (June 2022 release) |
| Texas | 2020 | 402 (June 2021 release) | 410 (June 2022 release) |
| Pennsylvania | 2020 | 291 (June 2021 release) | 296 (June 2022 release) |
| New York | 2020 | 295 (June 2021 release) | 294 (June 2022 release) |
| Illinois | 2020 | 290 (June 2021 release) | 289 (June 2022 release) |
| Florida | 2020 | 198 (June 2021 release) | 199 (June 2022 release) |
| Illinois | 2019 | 323 (June 2020 release) | 238 (June 2021 release) |
| Pennsylvania | 2019 | 237 (June 2020 release) | 320 (June 2021 release) |
| New York | 2019 | 320 (June 2020 release) | 323 (June 2021 release) |
| Missouri | 2021 | Not in top 10 (June 2022 release, 10th place 123) | 161 (June 2023 release) |
| North Carolina | 2021 | Not in top 10 (June 2022 release, 10th place 123) | 126 (June 2023 release) |
| National total | 2018 | 5,714 (April 2019 release) | Implied above 6,003 (June 2020 release: 5,803 was "more than 200 fewer than in 2018") |
The June 2022 release named Washington (139) and Kentucky (123) in the 2021 top 10. The June 2023 release later listed Missouri at 161 and North Carolina at 126 for 2021. Missouri's count would have outranked both, and North Carolina's would have outranked Kentucky.
The June 2020 release said its top 20 held 31 cities, but its table lists 30. These problems are small next to the totals, but they matter for rankings.
What happens when a dog threatens a mail carrier
USPS says carriers can stop delivery to an address when they feel unsafe because of a loose dog. Residents then pick up their mail at the Post Office until delivery resumes.
If the problem is not fixed, USPS says owners can be required to rent a Post Office box. If a carrier judges a whole neighborhood unsafe, residents have to contact their local Post Office supervisor.
Owners can also face costs. The 2026 release says an owner could owe thousands of dollars for a carrier's medical care, lost shifts, clothing and emotional distress.

- Keep the dog in a separate closed room before opening the front door.
- Latch the door firmly if you step outside, and leash the dog if it is outdoors during delivery.
- Do not take mail from the carrier with your dog present, and teach children not to either.
- Use the free Informed Delivery service to see when mail is coming. USPS says over 70 million customers have enrolled since 2017.
| Campaign year | Dates | Theme |
|---|---|---|
| 2021 | June 12 to June 18 | Be Aware: Any Dog Can Bite |
| 2022 | June 5 to June 11 | The USPS Delivers for America, Deliver for Us by Restraining Your Dog |
| 2023 | June 4 to June 10 | Even good dogs have bad days |
| 2024 | June 2 to June 9 | Don't let your dog bite the hand that serves you |
| 2025 | Month of June, from June 1 | Secure Your Dog, Keep Deliveries on Track |
| 2026 | Month of June, from June 1 | Don't turn your back on dog bite prevention |
Carriers are trained to make a noise before entering a yard, keep their eyes on any dog and block outward-swinging doors with a foot. Handheld scanners have built-in dog warning alerts, and warning cards in sorting cases flag addresses with a dog.
For the wider picture of bites, see our dog bite statistics report. Insurance costs by state are in dog bite insurance claims by state.
What the USPS dog attack numbers can and cannot show
USPS counts incidents involving its own employees, not bites to the public. The 2026 release labels its tables "Dog Bite/Dog Incident Data," and local releases call them dog bite and dog-related incidents.
City names in the USPS tables are postal localities. They may not match city limits, so we did not compute city rates per resident.
The counts also depend on how many routes and deliveries each place has. USPS does not publish attacks per carrier or per delivery point. For how dog injuries compare with other causes, see our dog-related injuries report, and for deaths, fatal dog attacks by breed.
Frequently asked questions
How many USPS workers were attacked by dogs in 2025?
USPS says its employees suffered more than 5,200 dog attacks in 2025. That was down from more than 6,000 in 2024 and more than 5,800 in 2023. USPS released the figure on May 28, 2026.
Which city has the most dog attacks on mail carriers?
Los Angeles, with 70 attacks on postal employees in 2025. It also led in 2023 with 65 and in 2024 with 77. Dallas was second in 2025 with 50 and Denver third with 45.
Which state has the most USPS dog bites?
California, with 673 attacks in 2025. Texas had 358 and Ohio 287. California has led every USPS state list from 2018 to 2025.
Which state has the highest rate of dog attacks on mail carriers?
Among the 10 states USPS named for 2025, Missouri had the highest rate, at 29.0 attacks per million residents by our calculation. Ohio had 24.1 and Indiana 22.8. USPS does not publish counts for every state, so a full ranking is not possible.
Are dog attacks on mail carriers going up or down?
Down in 2025. USPS counted more than 5,200, after more than 6,000 in 2024. Over 2017 to 2025 the yearly figure moved between about 5,200 and 6,244, with no steady trend.
Can USPS stop delivering mail because of my dog?
Yes. USPS says a carrier can suspend delivery when a loose dog makes it unsafe, and you would collect mail at the Post Office. If the problem continues, USPS says you can be required to rent a Post Office box.
Do USPS figures count only bites?
No. The 2025 and 2026 releases label the data as dog bite and dog incident data. Local releases describe the counts as dog bite and dog-related incidents involving mail carriers.
When does USPS release its dog attack rankings?
Since 2022 USPS has released them between May 28 and June 2, before its June awareness campaign. The 2018 and 2019 releases came out in April. The 2026 rankings came out on May 28, 2026.
Methodology and limitations
We opened every USPS national dog attack release from April 2018 to May 2026 on about.usps.com. We extracted the city and state tables with Python. The nine release dates are listed in the first table of this report.
Each year's figures come from the release that first reported that year. The 2016 city figures and the 2018 state figures come from the prior-year columns of the next release.
Changes, sums, city counts by state and leader tables are our calculations from the USPS tables. Rates per million residents divide USPS state counts by Census Bureau Vintage 2025 population estimates for July 1, 2025.
Where USPS gives a total as "more than" a figure, we chart that figure as a floor. The Mississippi count of 48 comes from the USPS Mississippi local release of May 29, 2026.
Sources
- US Postal Service, Postal Service Names Top Cities and States for Dog Attacks on Mail Carriers, May 28, 2026, 2025 national total, 33-city ranking, top 10 states, safety guidance
- US Postal Service, U.S. Postal Service Releases Dog Bite National Rankings, May 29, 2025, 2024 total, 38-city ranking, top 10 states
- US Census Bureau, Vintage 2025 state population estimates, July 1, 2025 state and US populations for rates
- Also consulted: US Postal Service, dog bite national rankings, May 30, 2024, US Postal Service, dog bite national rankings, June 1, 2023, US Postal Service, dog attack national rankings, June 2, 2022, US Postal Service, dog attack national rankings, June 10, 2021, US Postal Service, dog attack national rankings, June 11, 2020, US Postal Service, dog attack national rankings, April 11, 2019, US Postal Service, annual dog attack city rankings, April 5, 2018, US Postal Service, Mississippi release, May 29, 2026, US Postal Service, Texas release, May 29, 2026.
Cite, embed and download
This report, its data and its images are free to reuse under a Creative Commons Attribution 4.0 licence. Credit dogeats.in with a link to this page. Every chart has its own embed code, every table has a CSV and an image download, and the images below are ready for social posts, slides and articles.
Cite this report
Link to this report
Every chart and table as an image