Ranking · Updated October 2026
The most dog-friendly states and cities in the US: a 2026 index built from public data
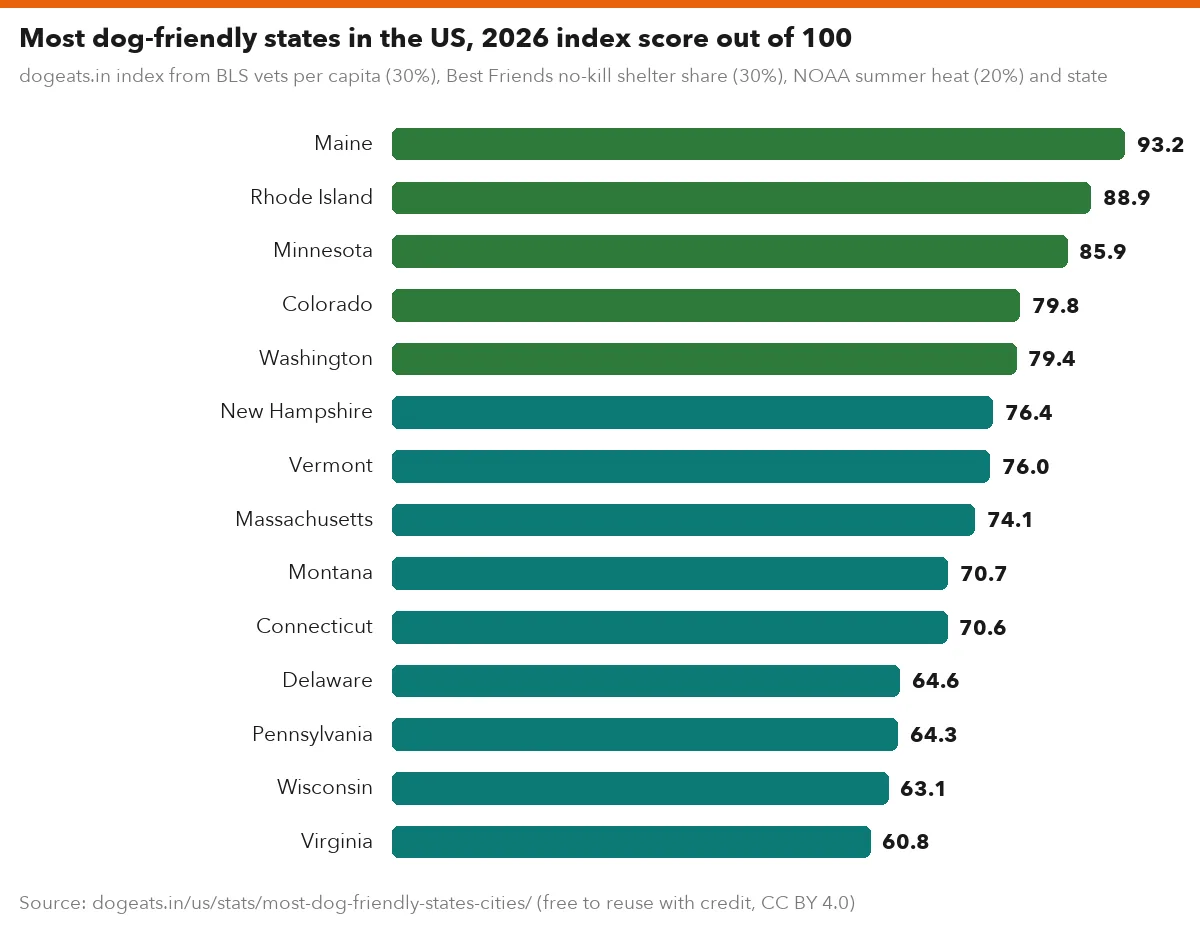
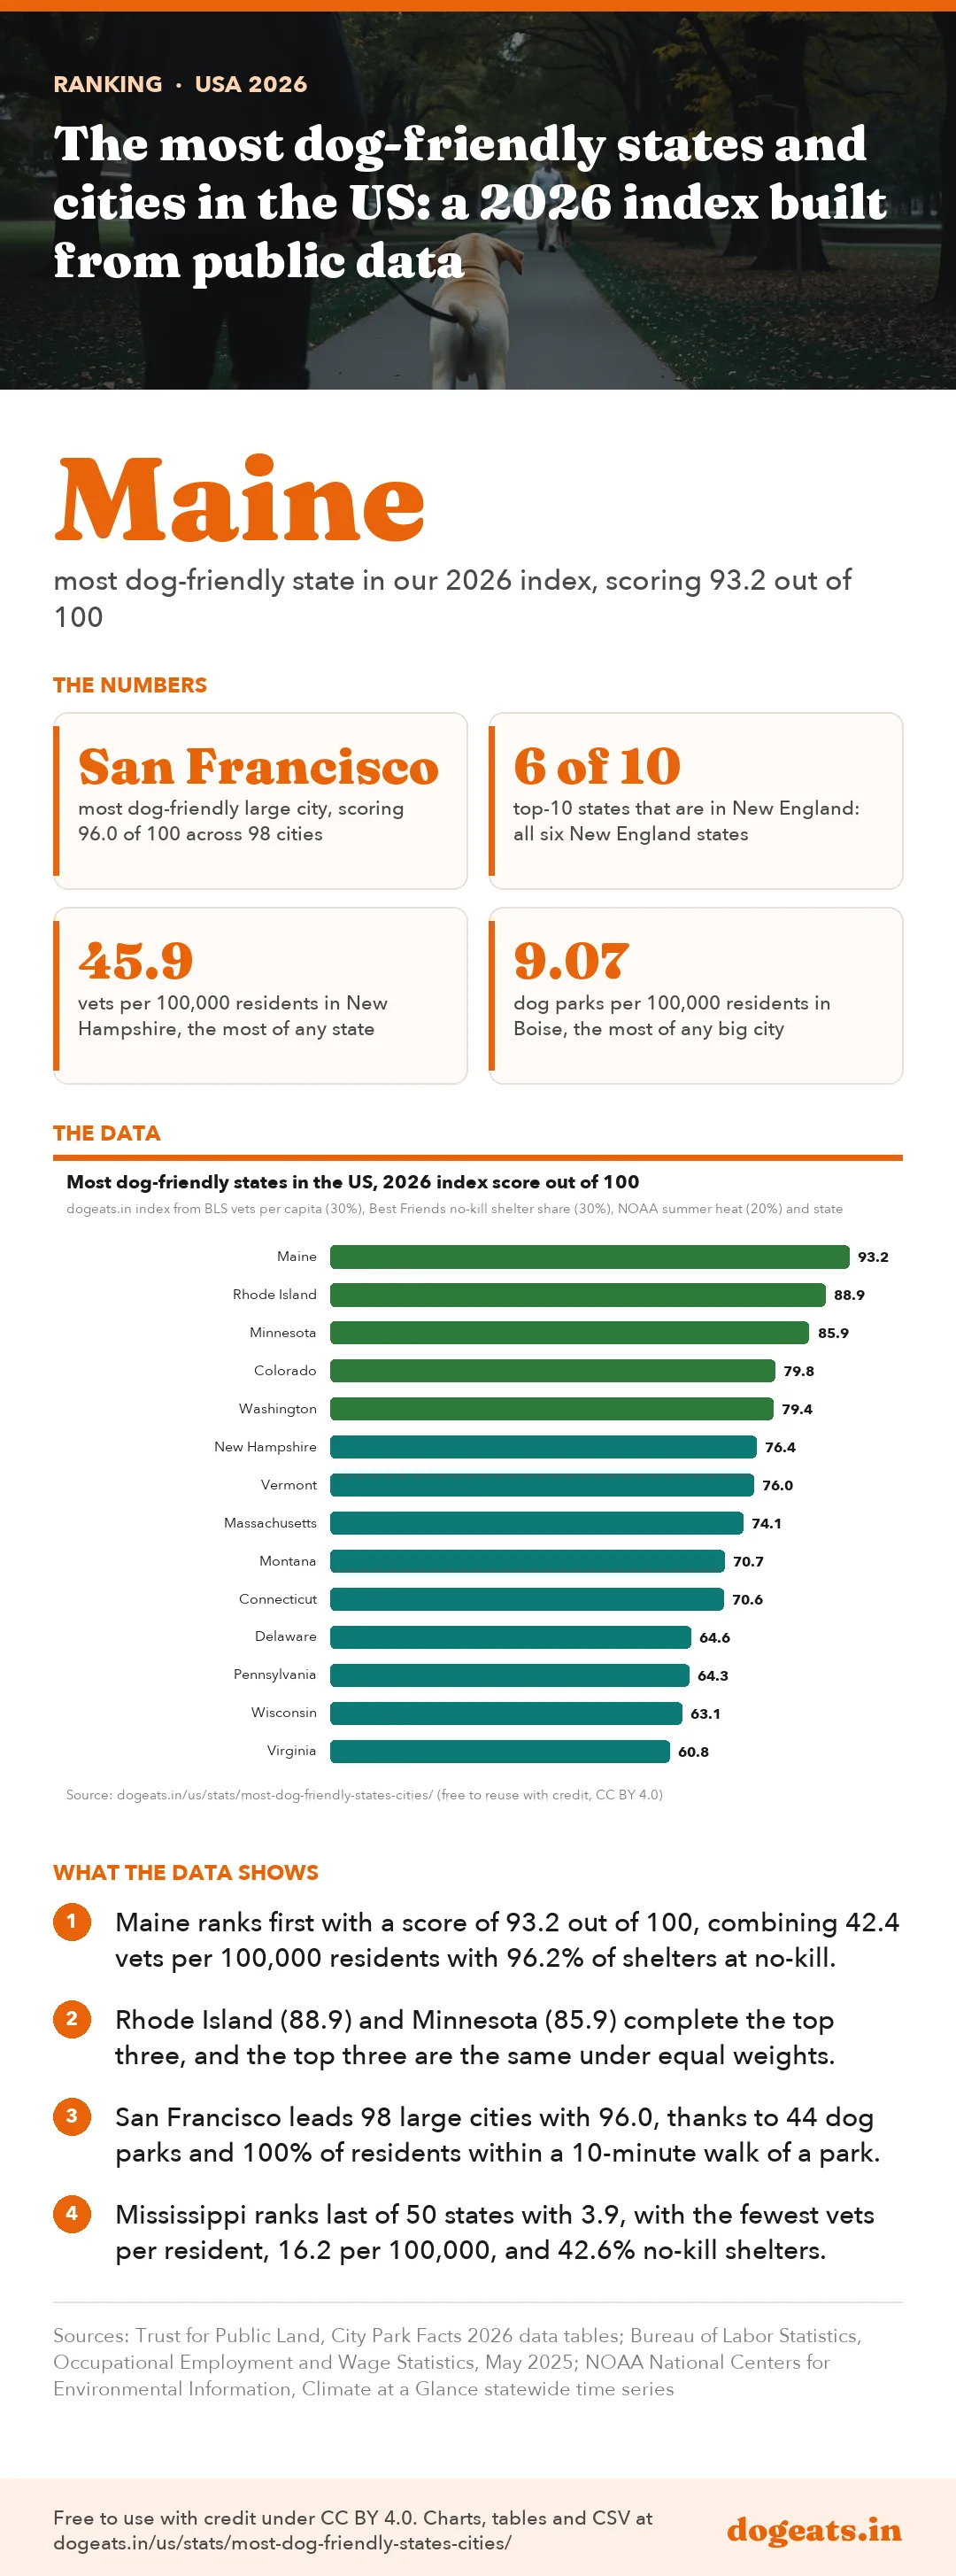
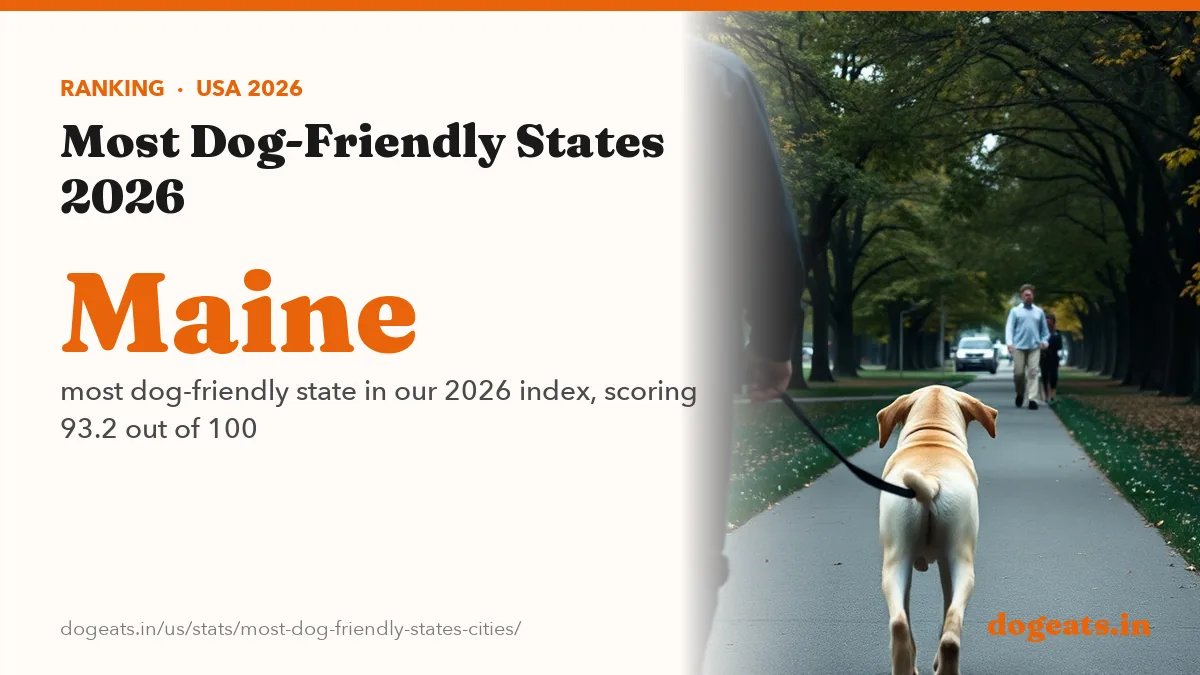
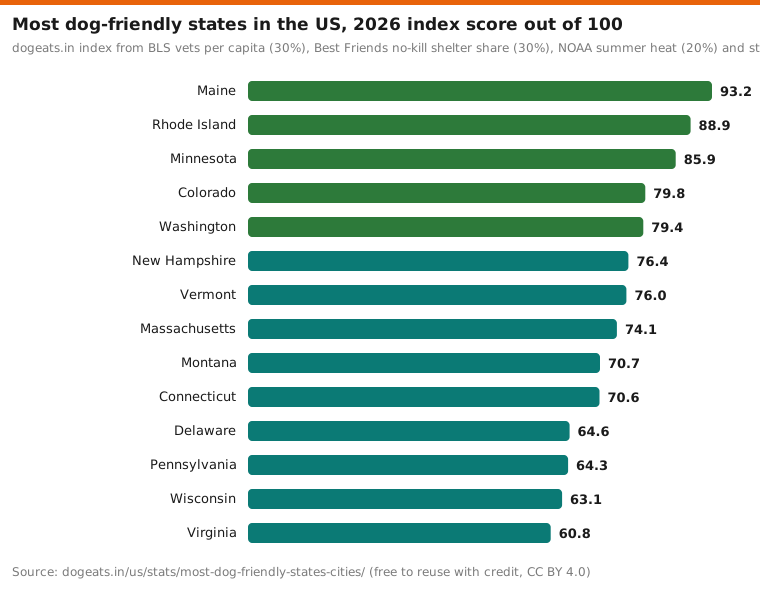
Maine is the most dog-friendly state in the US in our 2026 index, followed by Rhode Island and Minnesota. San Francisco tops 98 large cities, ahead of Washington, DC and Albuquerque. The index uses only public data: vets per resident, no-kill shelters, summer heat and breed-law limits for states, and dog parks and park access for cities.

Key findings
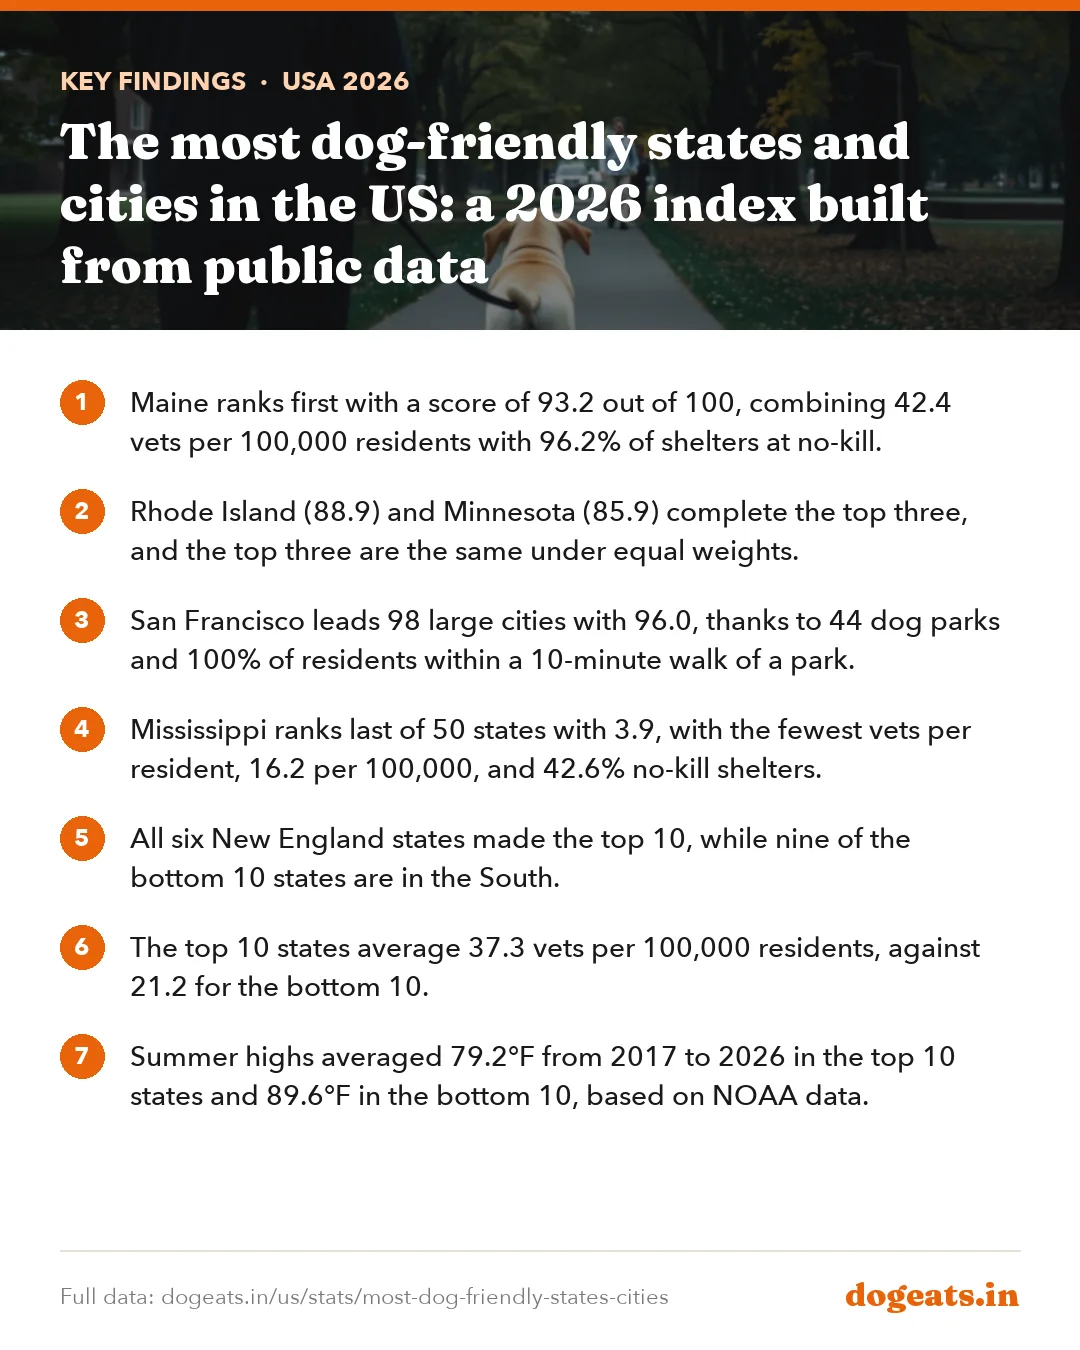
- Maine ranks first with a score of 93.2 out of 100, combining 42.4 vets per 100,000 residents with 96.2% of shelters at no-kill.
- Rhode Island (88.9) and Minnesota (85.9) complete the top three, and the top three are the same under equal weights.
- San Francisco leads 98 large cities with 96.0, thanks to 44 dog parks and 100% of residents within a 10-minute walk of a park.
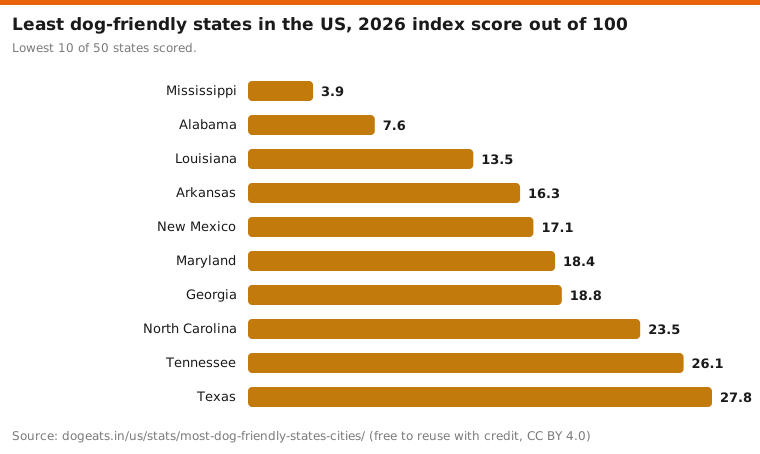
- Mississippi ranks last of 50 states with 3.9, with the fewest vets per resident, 16.2 per 100,000, and 42.6% no-kill shelters.
- All six New England states made the top 10, while nine of the bottom 10 states are in the South.
- The top 10 states average 37.3 vets per 100,000 residents, against 21.2 for the bottom 10.
- Summer highs averaged 79.2°F from 2017 to 2026 in the top 10 states and 89.6°F in the bottom 10, based on NOAA data.
- Oklahoma City ranks last of the 98 cities, with 3 dog parks for 718,231 residents and 41% walkable park access.
- Among the 15 cities with a million or more residents, New York ranks highest at 18th and Fort Worth lowest at 91st.
- Seven of the top 10 states have a state law limiting breed-specific dog rules, against one of the bottom 10.
What is the most dog-friendly state in the US?
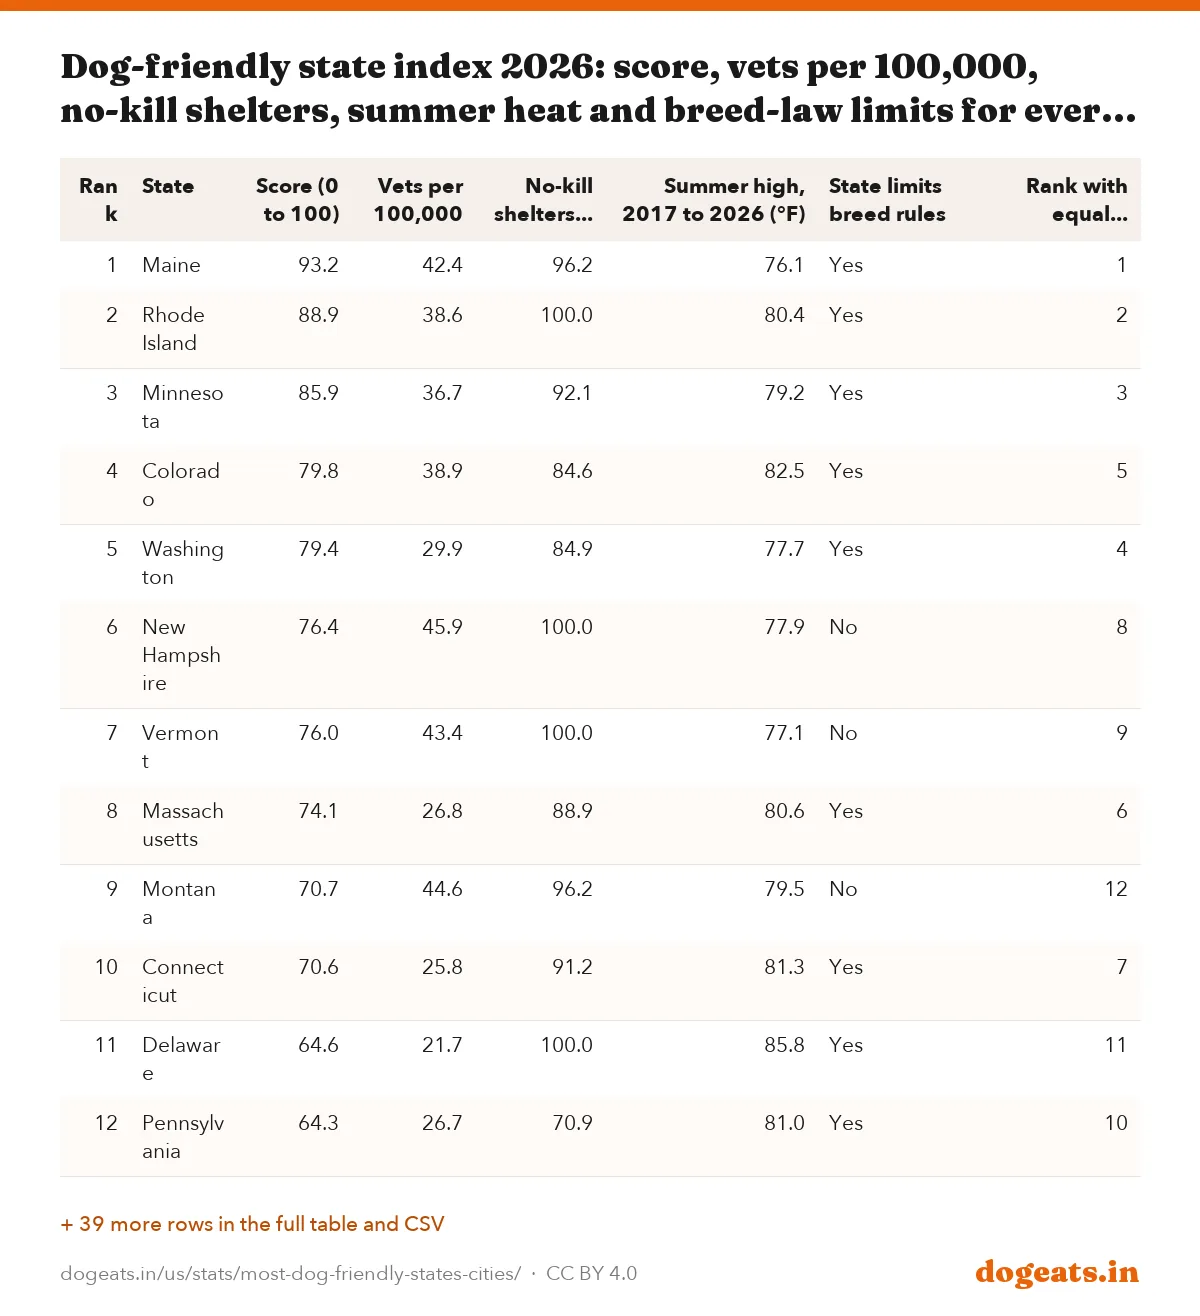
Maine is the most dog-friendly state in our 2026 index, with a score of 93.2 out of 100. It has 42.4 veterinarians per 100,000 residents, 96.2% of its shelters at no-kill, mild summers and a state law limiting breed-specific rules.
Rhode Island is second at 88.9 and Minnesota third at 85.9. Colorado (79.8) and Washington (79.4) complete the top five.
The index scores all 50 states on four public measures. The District of Columbia is not scored because we found no NOAA statewide summer temperature series for it.
dogeats.in index from BLS vets per capita (30%), Best Friends no-kill shelter share (30%), NOAA summer heat (20%) and state breed-law limits (20%).
Show the numbers
| Label | score |
|---|---|
| Maine | 93.2 |
| Rhode Island | 88.9 |
| Minnesota | 85.9 |
| Colorado | 79.8 |
| Washington | 79.4 |
| New Hampshire | 76.4 |
| Vermont | 76.0 |
| Massachusetts | 74.1 |
| Montana | 70.7 |
| Connecticut | 70.6 |
| Delaware | 64.6 |
| Pennsylvania | 64.3 |
| Wisconsin | 63.1 |
| Virginia | 60.8 |
Embed this chart
| Rank | State | Score (0 to 100) | Vets per 100,000 | No-kill shelters (%) | Summer high, 2017 to 2026 (°F) | State limits breed rules | Rank with equal weights |
|---|---|---|---|---|---|---|---|
| 1 | Maine | 93.2 | 42.4 | 96.2 | 76.1 | Yes | 1 |
| 2 | Rhode Island | 88.9 | 38.6 | 100.0 | 80.4 | Yes | 2 |
| 3 | Minnesota | 85.9 | 36.7 | 92.1 | 79.2 | Yes | 3 |
| 4 | Colorado | 79.8 | 38.9 | 84.6 | 82.5 | Yes | 5 |
| 5 | Washington | 79.4 | 29.9 | 84.9 | 77.7 | Yes | 4 |
| 6 | New Hampshire | 76.4 | 45.9 | 100.0 | 77.9 | No | 8 |
| 7 | Vermont | 76.0 | 43.4 | 100.0 | 77.1 | No | 9 |
| 8 | Massachusetts | 74.1 | 26.8 | 88.9 | 80.6 | Yes | 6 |
| 9 | Montana | 70.7 | 44.6 | 96.2 | 79.5 | No | 12 |
| 10 | Connecticut | 70.6 | 25.8 | 91.2 | 81.3 | Yes | 7 |
| 11 | Delaware | 64.6 | 21.7 | 100.0 | 85.8 | Yes | 11 |
| 12 | Pennsylvania | 64.3 | 26.7 | 70.9 | 81.0 | Yes | 10 |
| 13 | Wisconsin | 63.1 | 30.6 | 91.2 | 79.1 | No | 15 |
| 14 | Virginia | 60.8 | 30.4 | 66.9 | 85.0 | Yes | 13 |
| 15 | Idaho | 60.5 | 26.6 | 100.0 | 79.9 | No | 18 |
| 16 | North Dakota | 59.4 | 33.8 | 87.5 | 80.9 | No | 21 |
| 17 | South Dakota | 59.0 | 29.9 | 62.5 | 84.1 | Yes | 14 |
| 18 | Oregon | 58.6 | 38.8 | 76.9 | 80.7 | No | 22 |
| 19 | Wyoming | 56.4 | 23.8 | 100.0 | 79.9 | No | 24 |
| 20 | Arizona | 54.9 | 27.3 | 76.4 | 95.5 | Yes | 23 |
| 21 | Utah | 54.3 | 18.1 | 96.6 | 86.9 | Yes | 19 |
| 22 | Nevada | 54.1 | 20.7 | 89.3 | 88.1 | Yes | 20 |
| 23 | New Jersey | 53.7 | 20.0 | 84.1 | 84.4 | Yes | 17 |
| 24 | New York | 51.6 | 16.9 | 70.4 | 78.4 | Yes | 16 |
| 25 | Nebraska | 48.8 | 38.7 | 71.0 | 85.8 | No | 30 |
| 26 | Iowa | 47.1 | 30.9 | 70.2 | 83.1 | No | 29 |
| 27 | Missouri | 46.1 | 30.6 | 81.4 | 86.9 | No | 33 |
| 28 | Oklahoma | 45.3 | 27.9 | 55.6 | 92.5 | Yes | 26 |
| 29 | Kansas | 44.7 | 33.6 | 76.8 | 89.8 | No | 34 |
| 30 | Alaska | 43.9 | 21.7 | 72.2 | 60.2 | No | 27 |
| 31 | Illinois | 41.6 | 18.3 | 66.9 | 84.7 | Yes | 25 |
| 32 | Florida | 41.2 | 22.8 | 64.9 | 91.7 | Yes | 31 |
| 33 | South Carolina | 41.0 | 24.8 | 45.6 | 89.5 | Yes | 28 |
| 34 | West Virginia | 40.2 | 22.1 | 81.6 | 82.5 | No | 35 |
| 35 | California | 39.6 | 23.3 | 56.1 | 90.4 | Yes | 32 |
| 36 | Ohio | 39.6 | 28.8 | 64.1 | 82.9 | No | 38 |
| 37 | Michigan | 37.6 | 20.0 | 73.3 | 79.1 | No | 37 |
| 38 | Hawaii | 36.3 | 25.8 | 44.4 | 76.5 | No | 36 |
| 39 | Kentucky | 34.3 | 25.8 | 67.3 | 85.9 | No | 39 |
| 40 | Indiana | 29.6 | 21.5 | 69.3 | 83.8 | No | 41 |
| 41 | Texas | 27.8 | 19.8 | 48.9 | 95.1 | Yes | 40 |
| 42 | Tennessee | 26.1 | 23.6 | 60.0 | 86.8 | No | 42 |
| 43 | North Carolina | 23.5 | 26.3 | 39.7 | 86.6 | No | 43 |
| 44 | Georgia | 18.8 | 23.6 | 50.6 | 90.0 | No | 45 |
| 45 | Maryland | 18.4 | 22.8 | 37.8 | 85.4 | No | 44 |
| 46 | New Mexico | 17.1 | 21.6 | 55.3 | 89.2 | No | 46 |
| 47 | Arkansas | 16.3 | 17.3 | 67.0 | 89.8 | No | 47 |
| 48 | Louisiana | 13.5 | 20.6 | 56.5 | 91.7 | No | 48 |
| 49 | Alabama | 7.6 | 19.6 | 40.2 | 89.9 | No | 49 |
| 50 | Mississippi | 3.9 | 16.2 | 42.6 | 90.9 | No | 50 |
| n/a | District of Columbia | n/a | 27.4 | n/a | n/a | No | n/a |
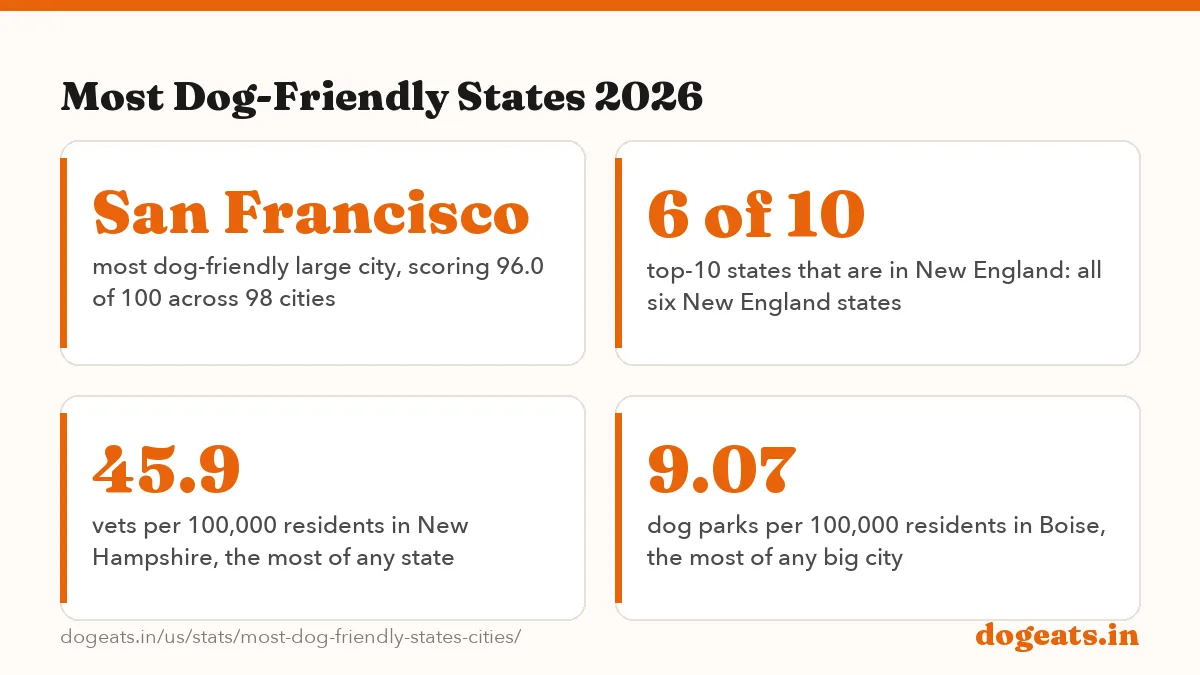
Six of the top 10 are New England states: Maine, Rhode Island, New Hampshire, Vermont, Massachusetts and Connecticut. Minnesota, Colorado, Washington and Montana fill the rest.
New Hampshire has the most vets per resident, 45.9 per 100,000, but ranks sixth because it scores 0 on the breed-law measure. Montana ranks ninth with 44.6 vets per 100,000.
Scores are relative. A state scoring 50 sits near the middle of the 50 states on our measures, not halfway to a perfect place for dogs.
The least dog-friendly states are mostly in the hot South
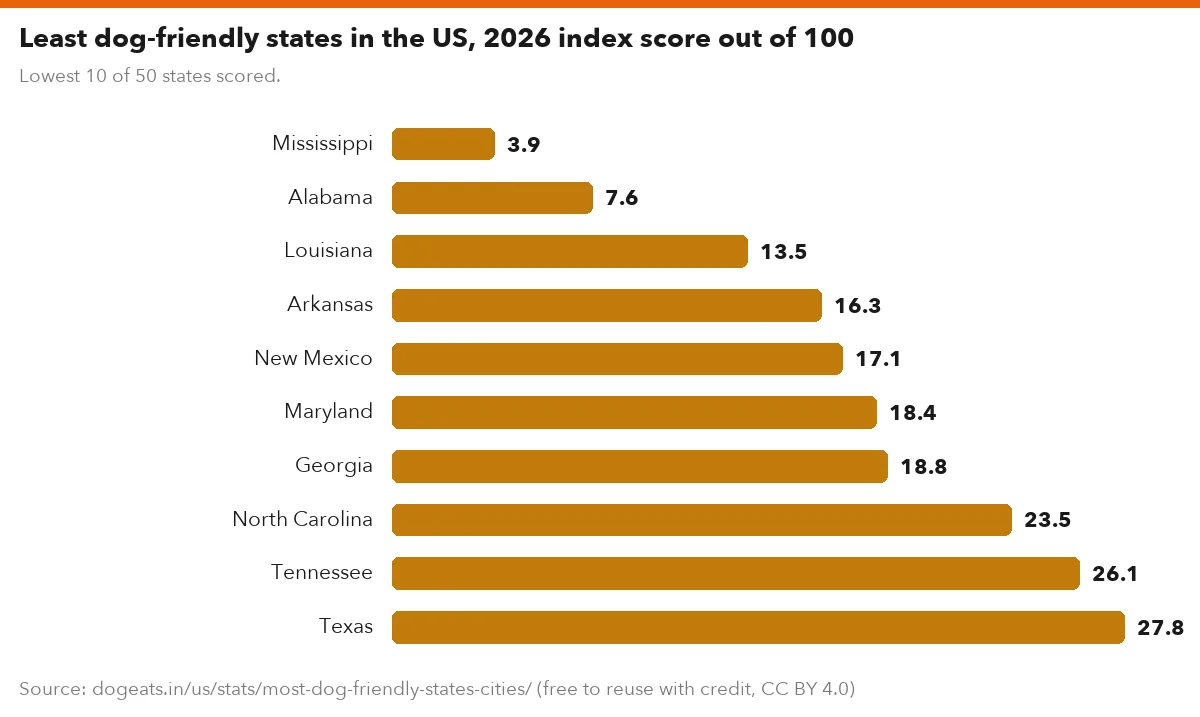
Mississippi ranks last with a score of 3.9. It has the fewest vets per resident of any state, 16.2 per 100,000, and 42.6% of its shelters at no-kill.
Alabama (7.6) and Louisiana (13.5) are next from the bottom. Nine of the 10 lowest-ranked states are in the Census Bureau's South region; the other is New Mexico.
Heat is one reason. The bottom 10 states averaged a summer high of 89.6°F from 2017 to 2026, about 10 degrees warmer than the top 10.
Lowest 10 of 50 states scored.
Show the numbers
| Label | score |
|---|---|
| Mississippi | 3.9 |
| Alabama | 7.6 |
| Louisiana | 13.5 |
| Arkansas | 16.3 |
| New Mexico | 17.1 |
| Maryland | 18.4 |
| Georgia | 18.8 |
| North Carolina | 23.5 |
| Tennessee | 26.1 |
| Texas | 27.8 |
Embed this chart
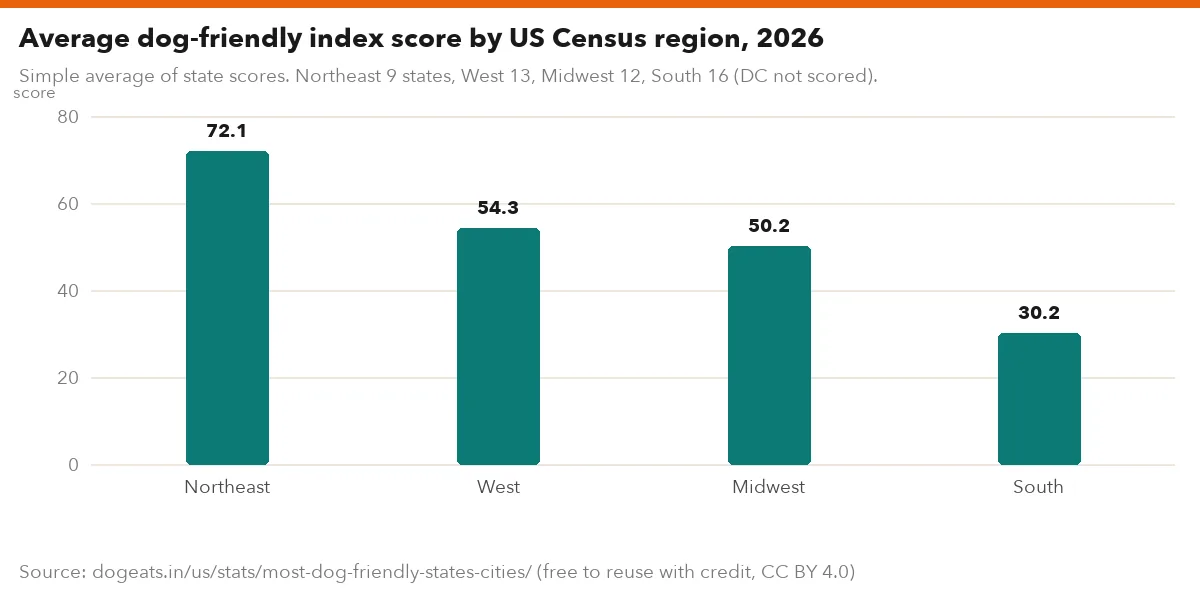
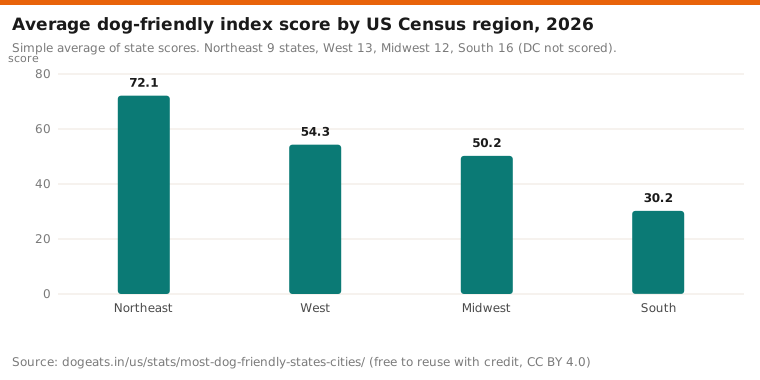
Simple average of state scores. Northeast 9 states, West 13, Midwest 12, South 16 (DC not scored).
Show the numbers
| Label | score |
|---|---|
| Northeast | 72.1 |
| West | 54.3 |
| Midwest | 50.2 |
| South | 30.2 |
Embed this chart
By region, Northeast states average 72.1, Western states 54.3, Midwestern states 50.2 and Southern states 30.2. Delaware is the highest-ranked Southern state, at 11th.
Texas ranks 41st even though it limits breed-based dangerous dog rules. Its average summer high of 95.1°F and a 48.9% no-kill shelter share pull it down.
For more on how shelters perform state by state, see our report on shelter euthanasia by state.
The four state measures: vets, shelters, heat and breed laws
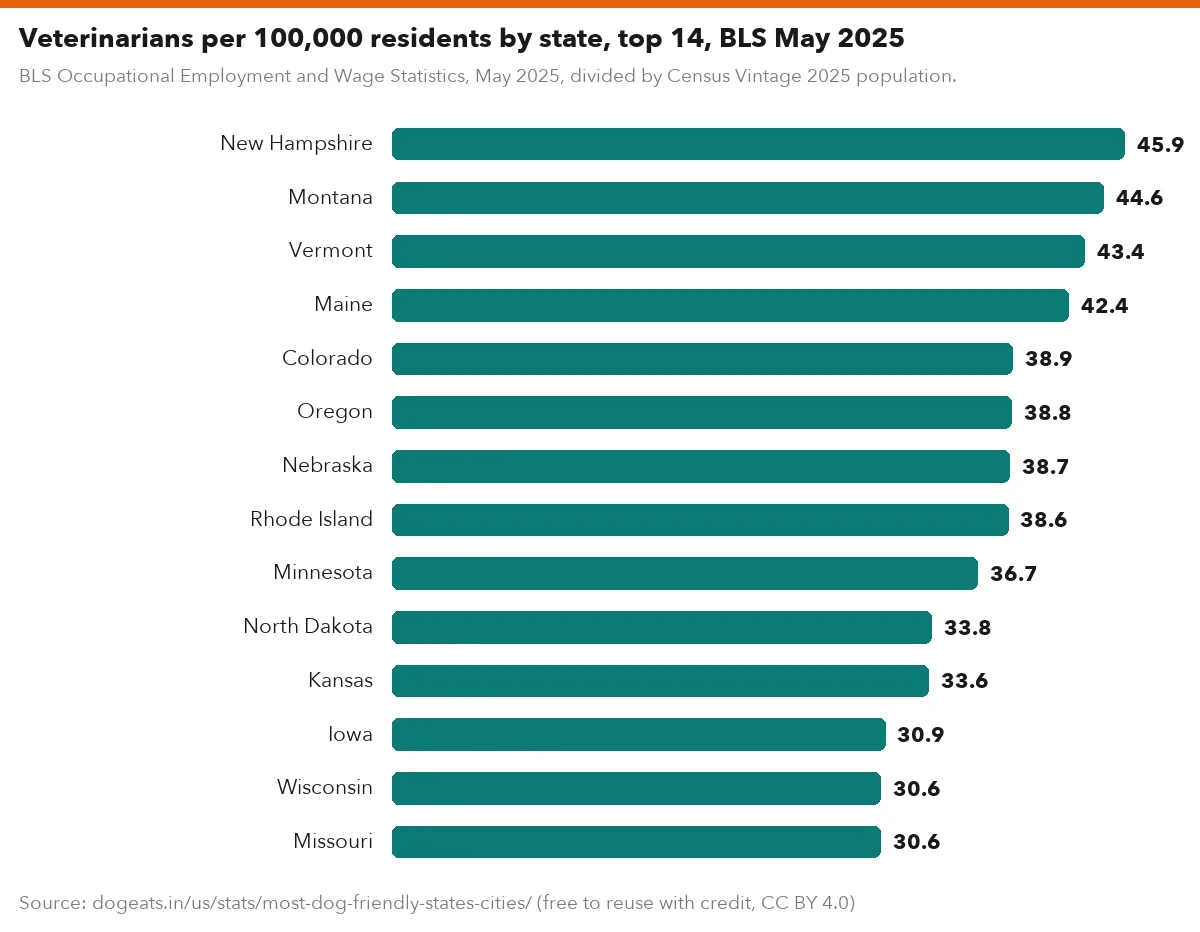
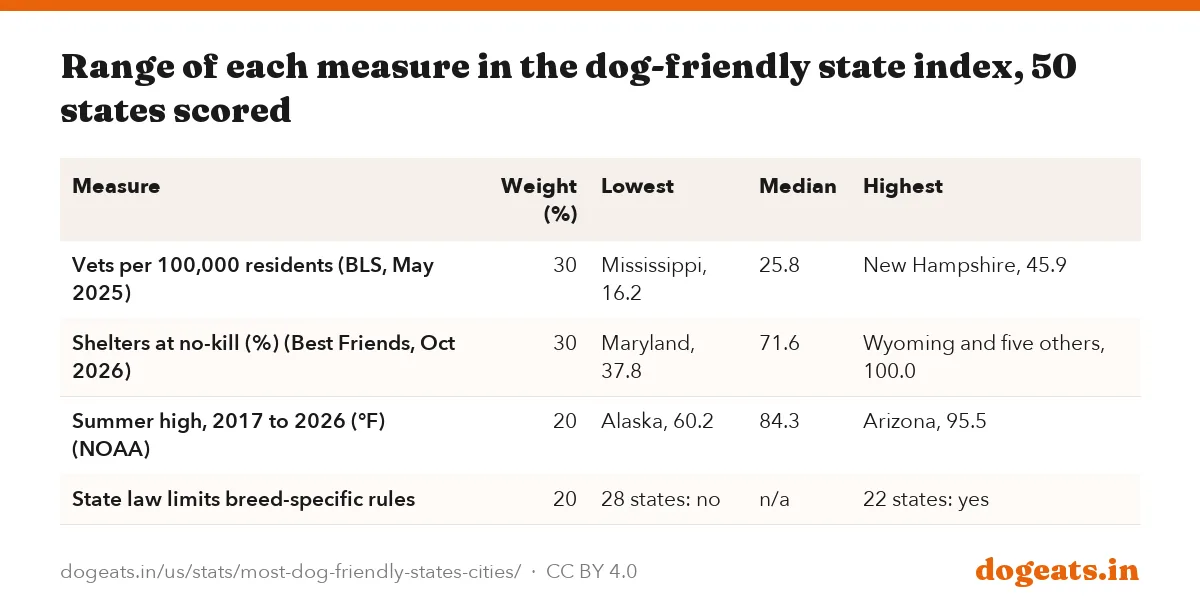
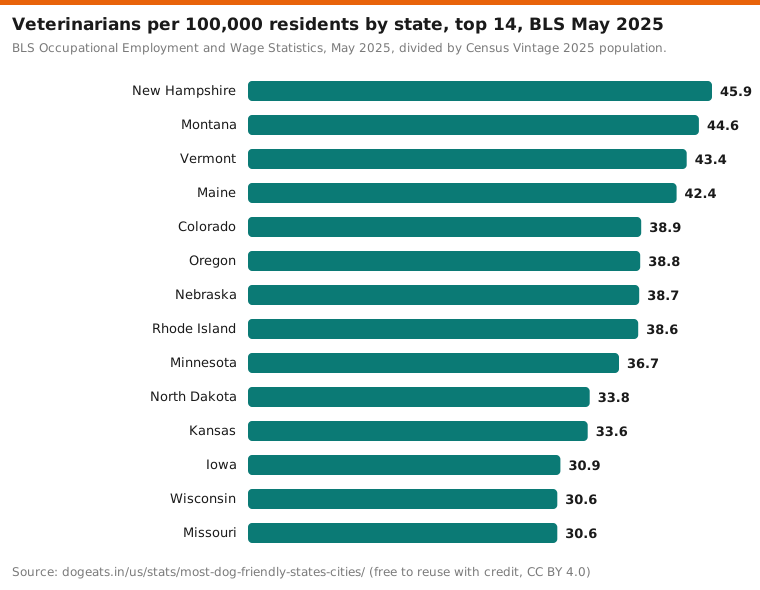
Veterinary access carries 30% of the score. The US had 24.5 vets per 100,000 residents in May 2025, based on federal wage survey counts, ranging from 45.9 in New Hampshire to 16.2 in Mississippi.
Shelter outcomes carry another 30%. We use the share of each state's shelters that save at least 90% of animals, from Best Friends Animal Society's dashboard. Wyoming, Delaware, Idaho, New Hampshire, Rhode Island and Vermont are at 100%, and Maryland is lowest at 37.8%.
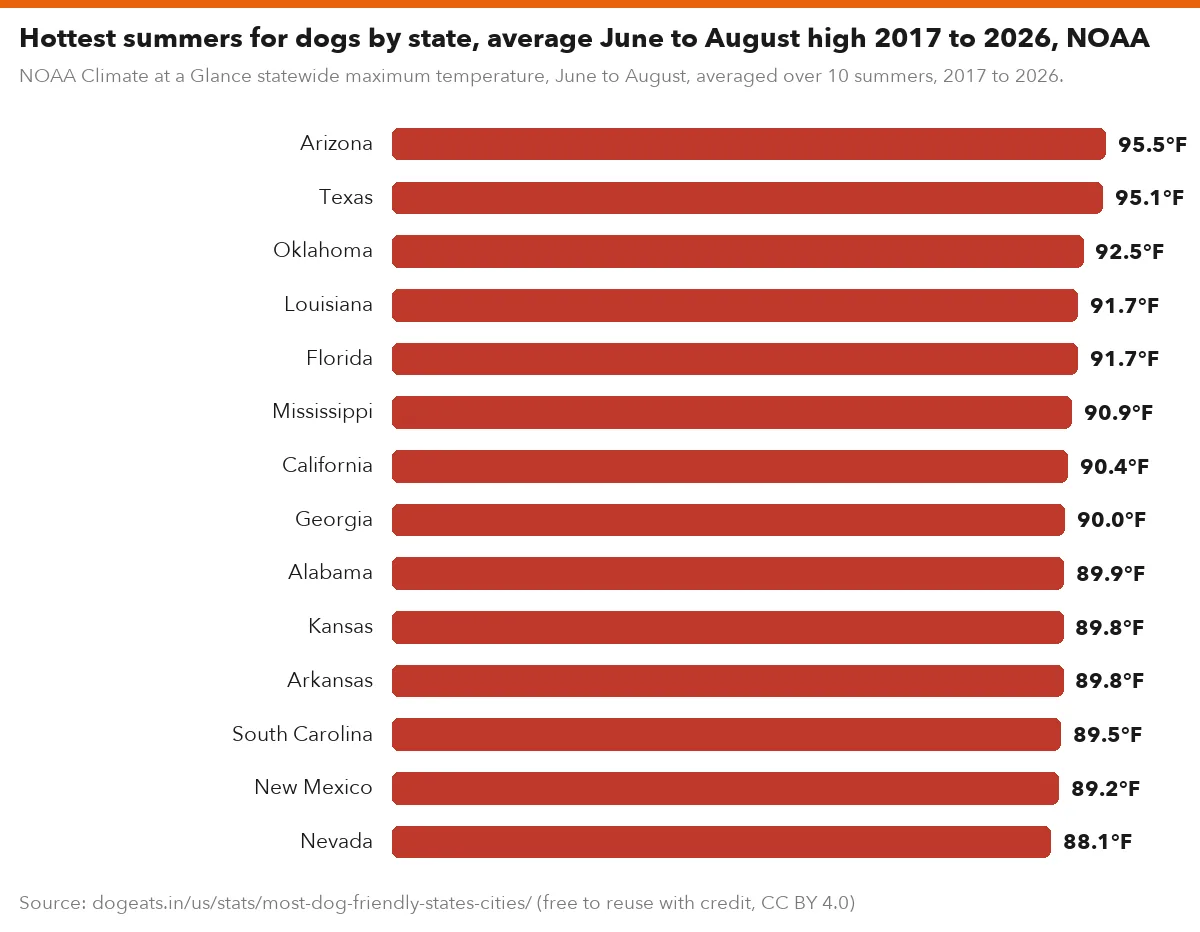
Summer heat carries 20%. Heatstroke is a known risk for dogs, so cooler states score higher. We use NOAA's statewide average June to August maximum temperature, averaged over 2017 to 2026.
BLS Occupational Employment and Wage Statistics, May 2025, divided by Census Vintage 2025 population.
Show the numbers
| Label | per 100,000 |
|---|---|
| New Hampshire | 45.9 |
| Montana | 44.6 |
| Vermont | 43.4 |
| Maine | 42.4 |
| Colorado | 38.9 |
| Oregon | 38.8 |
| Nebraska | 38.7 |
| Rhode Island | 38.6 |
| Minnesota | 36.7 |
| North Dakota | 33.8 |
| Kansas | 33.6 |
| Iowa | 30.9 |
| Wisconsin | 30.6 |
| Missouri | 30.6 |
Embed this chart
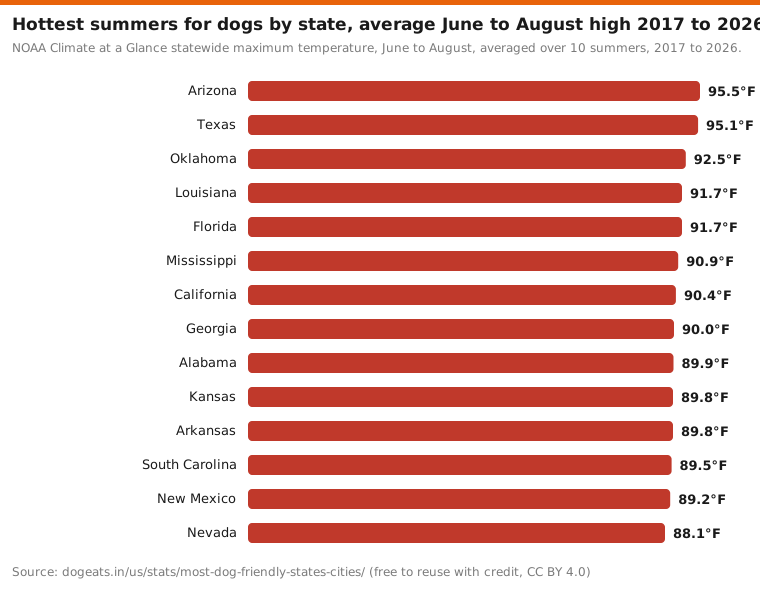
NOAA Climate at a Glance statewide maximum temperature, June to August, averaged over 10 summers, 2017 to 2026.
Show the numbers
| Label | °F |
|---|---|
| Arizona | 95.5°F |
| Texas | 95.1°F |
| Oklahoma | 92.5°F |
| Louisiana | 91.7°F |
| Florida | 91.7°F |
| Mississippi | 90.9°F |
| California | 90.4°F |
| Georgia | 90.0°F |
| Alabama | 89.9°F |
| Kansas | 89.8°F |
| Arkansas | 89.8°F |
| South Carolina | 89.5°F |
| New Mexico | 89.2°F |
| Nevada | 88.1°F |
Embed this chart
| Measure | Weight (%) | Lowest | Median | Highest |
|---|---|---|---|---|
| Vets per 100,000 residents (BLS, May 2025) | 30 | Mississippi, 16.2 | 25.8 | New Hampshire, 45.9 |
| Shelters at no-kill (%) (Best Friends, Oct 2026) | 30 | Maryland, 37.8 | 71.6 | Wyoming and five others, 100.0 |
| Summer high, 2017 to 2026 (°F) (NOAA) | 20 | Alaska, 60.2 | 84.3 | Arizona, 95.5 |
| State law limits breed-specific rules | 20 | 28 states: no | n/a | 22 states: yes |
Breed laws carry the last 20%. Twenty-two states have a law that limits cities and counties from regulating dogs by breed, and those states score 100 on this measure while the rest score 0.
Arizona had the hottest summers, averaging 95.5°F, followed by Texas at 95.1°F and Oklahoma at 92.5°F. In summer 2026 alone, Arizona averaged 96.8°F and Alaska 59.7°F.
We did not find a current, public state-level measure of dog ownership, so ownership is not part of the index.
What are the most dog-friendly cities in the US?
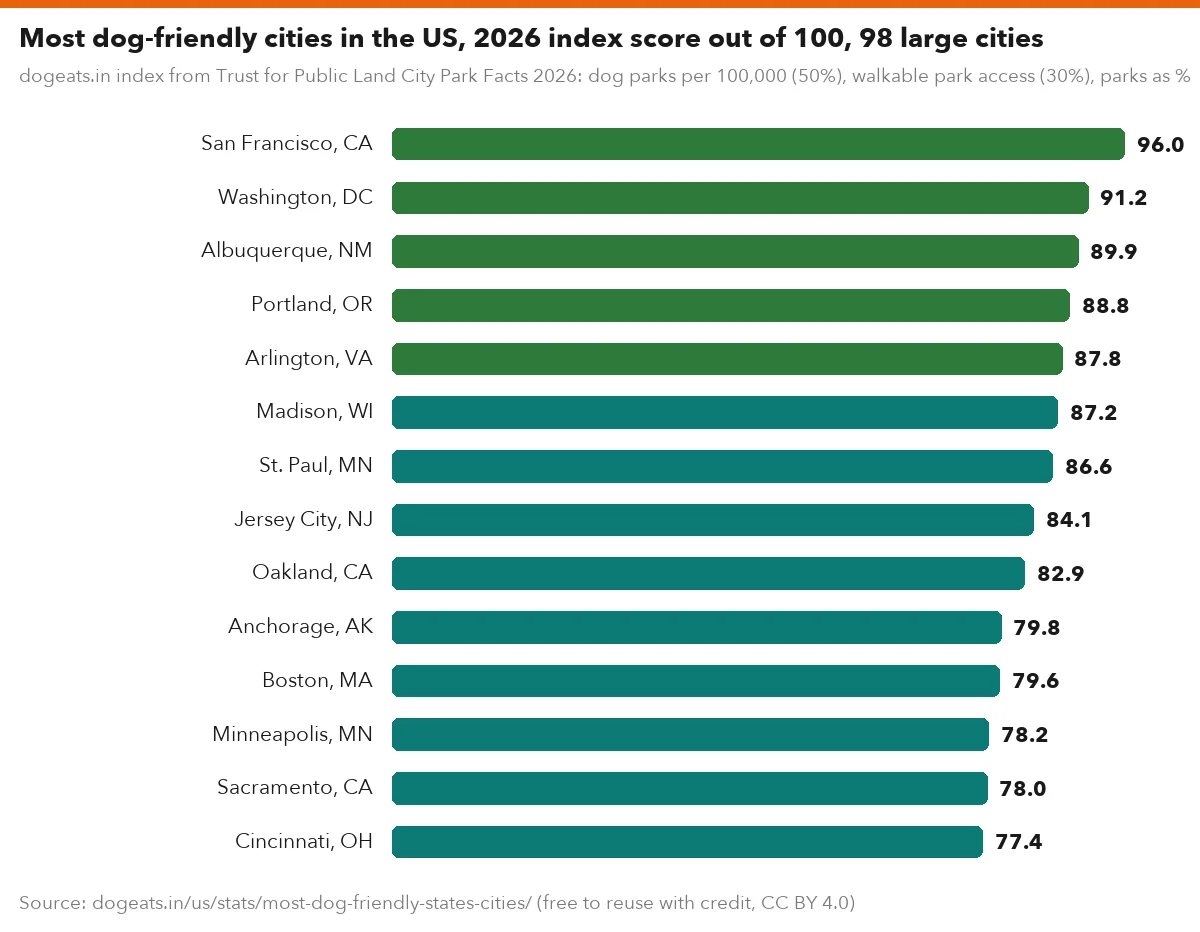
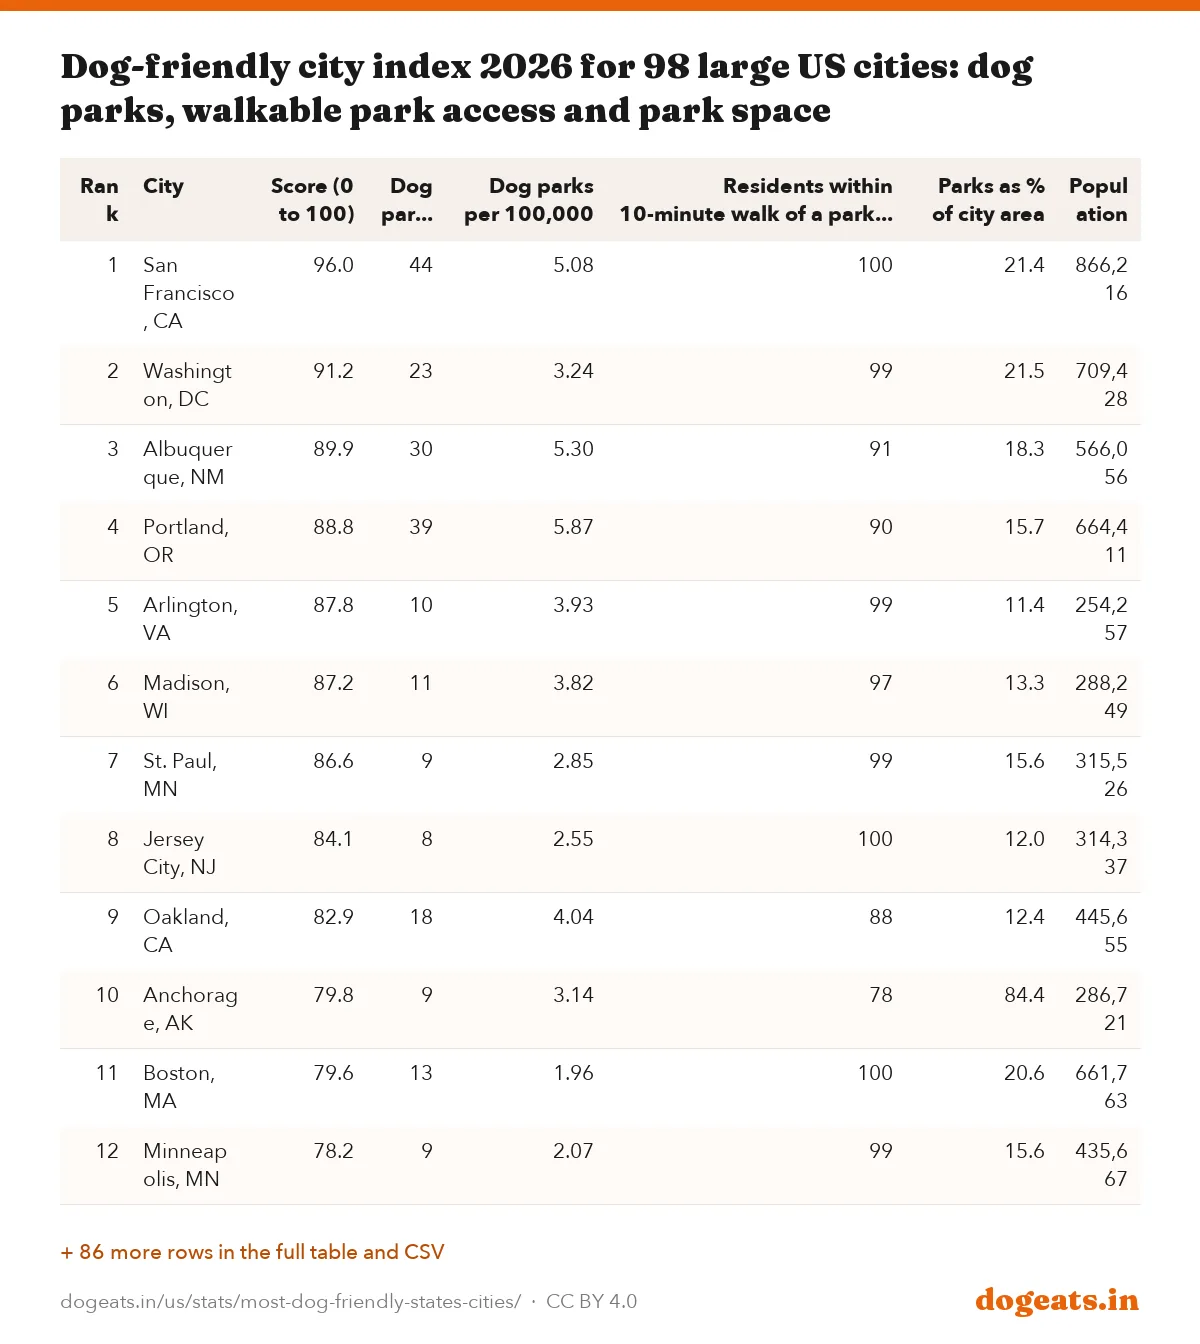
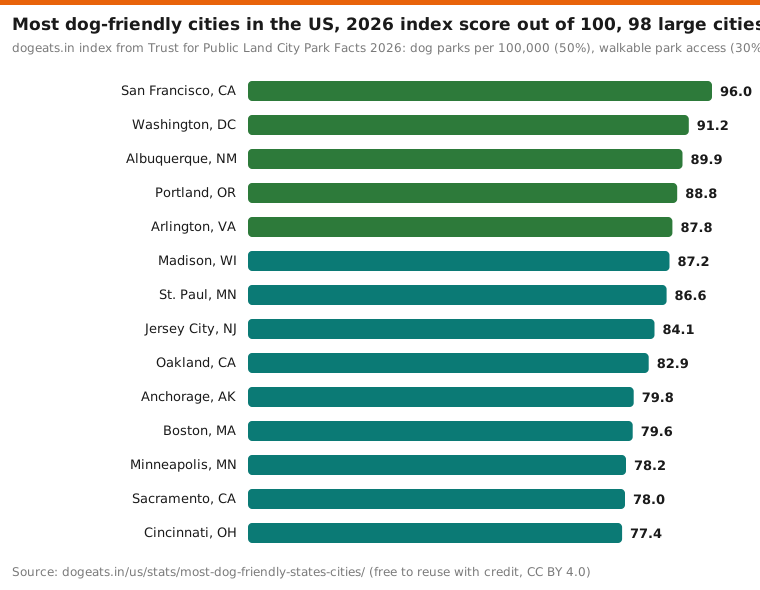
San Francisco is the most dog-friendly large city in our index, scoring 96.0. It has 44 dog parks, or 5.08 per 100,000 residents, and 100% of residents live within a 10-minute walk of a park.
Washington, DC is second at 91.2, Albuquerque third at 89.9 and Portland, Oregon fourth at 88.8. Arlington, Virginia rounds out the top five at 87.8.
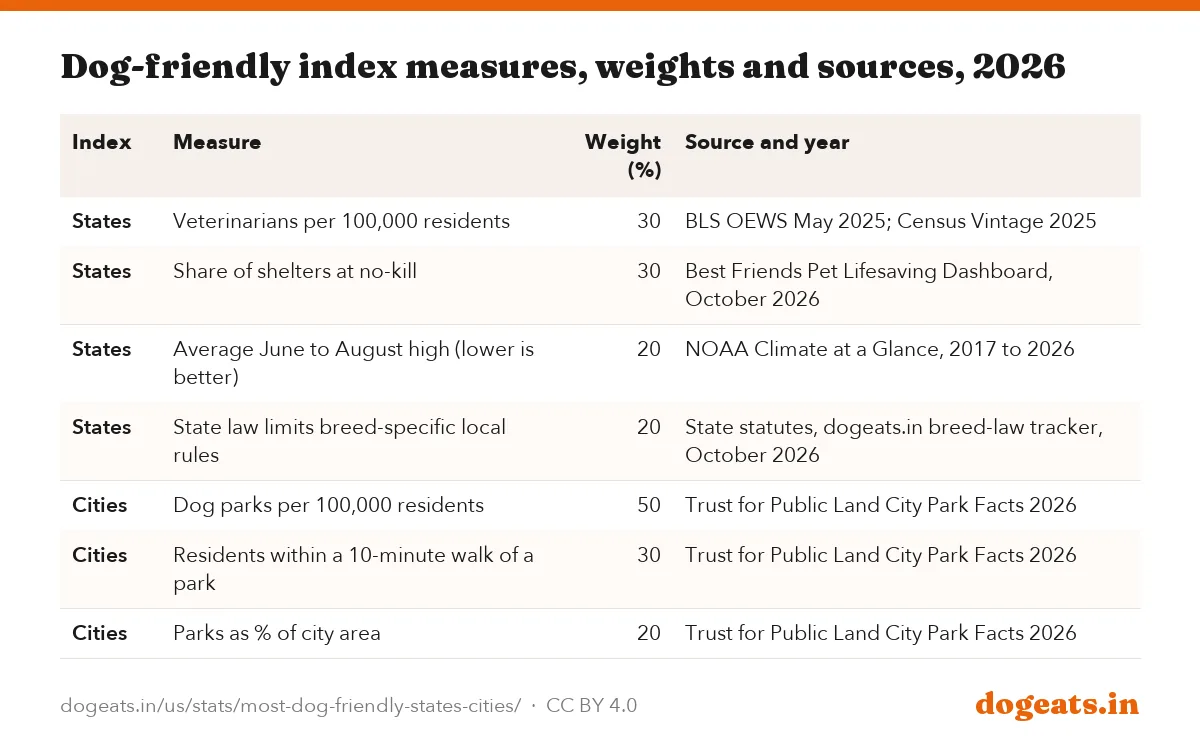
The city index covers 98 of the 100 largest US cities using Trust for Public Land's 2026 City Park Facts. Dog parks per resident carry 50%, walkable park access 30% and park space as a share of city area 20%.

dogeats.in index from Trust for Public Land City Park Facts 2026: dog parks per 100,000 (50%), walkable park access (30%), parks as % of city area (20%).
Show the numbers
| Label | score |
|---|---|
| San Francisco, CA | 96.0 |
| Washington, DC | 91.2 |
| Albuquerque, NM | 89.9 |
| Portland, OR | 88.8 |
| Arlington, VA | 87.8 |
| Madison, WI | 87.2 |
| St. Paul, MN | 86.6 |
| Jersey City, NJ | 84.1 |
| Oakland, CA | 82.9 |
| Anchorage, AK | 79.8 |
| Boston, MA | 79.6 |
| Minneapolis, MN | 78.2 |
| Sacramento, CA | 78.0 |
| Cincinnati, OH | 77.4 |
Embed this chart
| Rank | City | Score (0 to 100) | Dog parks | Dog parks per 100,000 | Residents within 10-minute walk of a park (%) | Parks as % of city area | Population |
|---|---|---|---|---|---|---|---|
| 1 | San Francisco, CA | 96.0 | 44 | 5.08 | 100 | 21.4 | 866,216 |
| 2 | Washington, DC | 91.2 | 23 | 3.24 | 99 | 21.5 | 709,428 |
| 3 | Albuquerque, NM | 89.9 | 30 | 5.30 | 91 | 18.3 | 566,056 |
| 4 | Portland, OR | 88.8 | 39 | 5.87 | 90 | 15.7 | 664,411 |
| 5 | Arlington, VA | 87.8 | 10 | 3.93 | 99 | 11.4 | 254,257 |
| 6 | Madison, WI | 87.2 | 11 | 3.82 | 97 | 13.3 | 288,249 |
| 7 | St. Paul, MN | 86.6 | 9 | 2.85 | 99 | 15.6 | 315,526 |
| 8 | Jersey City, NJ | 84.1 | 8 | 2.55 | 100 | 12.0 | 314,337 |
| 9 | Oakland, CA | 82.9 | 18 | 4.04 | 88 | 12.4 | 445,655 |
| 10 | Anchorage, AK | 79.8 | 9 | 3.14 | 78 | 84.4 | 286,721 |
| 11 | Boston, MA | 79.6 | 13 | 1.96 | 100 | 20.6 | 661,763 |
| 12 | Minneapolis, MN | 78.2 | 9 | 2.07 | 99 | 15.6 | 435,667 |
| 13 | Sacramento, CA | 78.0 | 17 | 3.15 | 89 | 10.6 | 539,961 |
| 14 | Cincinnati, OH | 77.4 | 7 | 2.20 | 91 | 17.1 | 317,536 |
| 15 | Pittsburgh, PA | 77.1 | 7 | 2.27 | 93 | 12.6 | 308,545 |
| 16 | Boise, ID | 76.1 | 22 | 9.07 | 75 | 9.8 | 242,489 |
| 17 | Henderson, NV | 75.4 | 20 | 5.70 | 85 | 6.9 | 350,828 |
| 18 | New York, NY | 75.1 | 158 | 1.82 | 99 | 17.4 | 8,688,336 |
| 19 | Denver, CO | 74.3 | 17 | 2.23 | 96 | 10.3 | 762,261 |
| 20 | St. Louis, MO | 72.4 | 6 | 2.16 | 98 | 9.1 | 277,903 |
| 21 | San Diego, CA | 71.9 | 29 | 2.09 | 82 | 21.0 | 1,384,281 |
| 22 | Miami, FL | 71.5 | 16 | 3.44 | 89 | 6.0 | 465,603 |
| 23 | Seattle, WA | 71.5 | 14 | 1.81 | 99 | 12.2 | 773,833 |
| 24 | San Jose, CA | 68.2 | 21 | 2.08 | 79 | 17.0 | 1,007,904 |
| 25 | Long Beach, CA | 68.0 | 11 | 2.44 | 82 | 9.1 | 450,339 |
| 26 | St. Petersburg, FL | 67.7 | 6 | 2.28 | 78 | 11.4 | 263,134 |
| 27 | Norfolk, VA | 67.6 | 8 | 3.41 | 79 | 6.7 | 234,596 |
| 28 | Fremont, CA | 67.0 | 5 | 2.11 | 70 | 42.8 | 237,191 |
| 29 | Tampa, FL | 65.3 | 16 | 3.91 | 64 | 9.3 | 408,696 |
| 30 | Chula Vista, CA | 61.6 | 8 | 2.84 | 70 | 8.6 | 281,855 |
| 31 | Atlanta, GA | 61.2 | 11 | 2.06 | 85 | 8.1 | 534,033 |
| 32 | Chicago, IL | 58.9 | 35 | 1.33 | 98 | 9.1 | 2,635,574 |
| 33 | Austin, TX | 56.5 | 19 | 1.85 | 76 | 9.5 | 1,028,149 |
| 34 | Lincoln, NE | 56.1 | 5 | 1.66 | 89 | 6.9 | 300,613 |
| 35 | Colorado Springs, CO | 55.3 | 8 | 1.58 | 77 | 11.1 | 507,798 |
| 36 | Chesapeake, VA | 55.0 | 5 | 1.94 | 48 | 29.0 | 258,308 |
| 37 | Detroit, MI | 54.5 | 12 | 1.92 | 85 | 5.7 | 625,512 |
| 38 | Richmond, VA | 54.5 | 4 | 1.71 | 83 | 8.0 | 233,928 |
| 39 | North Las Vegas, NV | 53.1 | 4 | 1.37 | 69 | 25.1 | 293,010 |
| 40 | Tucson, AZ | 51.9 | 13 | 2.38 | 69 | 4.3 | 547,288 |
| 41 | Spokane, WA | 51.9 | 3 | 1.25 | 86 | 9.3 | 239,389 |
| 42 | Fresno, CA | 51.0 | 13 | 2.35 | 71 | 2.7 | 552,888 |
| 43 | Milwaukee, WI | 49.4 | 5 | 0.89 | 96 | 9.7 | 563,343 |
| 44 | Laredo, TX | 49.4 | 8 | 3.09 | 59 | 2.8 | 259,225 |
| 45 | Buffalo, NY | 49.1 | 3 | 1.07 | 91 | 8.8 | 280,445 |
| 46 | Houston, TX | 48.8 | 33 | 1.46 | 65 | 12.2 | 2,267,722 |
| 47 | Honolulu County, HI | 48.7 | 11 | 1.07 | 76 | 17.4 | 1,030,625 |
| 48 | Lexington-Fayette County, KY | 48.1 | 8 | 2.45 | 61 | 2.9 | 325,983 |
| 49 | New Orleans, LA | 47.9 | 3 | 0.80 | 81 | 28.8 | 376,001 |
| 50 | Plano, TX | 47.5 | 3 | 1.03 | 85 | 10.5 | 290,698 |
| 51 | Baltimore, MD | 47.0 | 5 | 0.89 | 91 | 9.2 | 563,225 |
| 52 | Bakersfield, CA | 45.7 | 10 | 2.39 | 41 | 6.1 | 417,614 |
| 53 | Anaheim, CA | 45.0 | 4 | 1.17 | 65 | 14.5 | 342,462 |
| 54 | Irvine, CA | 44.8 | 1 | 0.31 | 94 | 25.3 | 324,586 |
| 55 | Philadelphia, PA | 44.8 | 8 | 0.50 | 97 | 13.6 | 1,590,580 |
| 56 | Reno, NV | 44.7 | 5 | 1.76 | 74 | 4.0 | 284,270 |
| 57 | Raleigh, NC | 43.4 | 8 | 1.64 | 41 | 12.4 | 489,209 |
| 58 | Scottsdale, AZ | 42.7 | 3 | 1.20 | 42 | 30.5 | 249,257 |
| 59 | Glendale, AZ | 42.3 | 4 | 1.54 | 72 | 4.9 | 259,019 |
| 60 | Aurora, CO | 42.2 | 3 | 0.73 | 90 | 9.7 | 411,009 |
| 61 | Santa Clarita, CA | 41.9 | 3 | 1.30 | 53 | 13.3 | 231,478 |
| 62 | Port St. Lucie, FL | 40.8 | 5 | 2.05 | 28 | 8.3 | 243,412 |
| 63 | Virginia Beach, VA | 40.5 | 5 | 1.09 | 69 | 11.4 | 456,754 |
| 64 | Nashville-Davidson County, TN | 40.4 | 10 | 1.37 | 44 | 12.1 | 730,276 |
| 65 | Cleveland, OH | 39.7 | 3 | 0.82 | 88 | 6.9 | 367,331 |
| 66 | Wichita, KS | 39.6 | 8 | 1.99 | 52 | 4.3 | 402,497 |
| 67 | Kansas City, MO | 38.4 | 5 | 0.96 | 72 | 9.4 | 521,818 |
| 68 | San Antonio, TX | 37.8 | 21 | 1.45 | 47 | 9.1 | 1,450,229 |
| 69 | El Paso, TX | 36.9 | 5 | 0.75 | 66 | 19.6 | 670,285 |
| 70 | Greensboro, NC | 36.4 | 4 | 1.30 | 59 | 8.5 | 306,925 |
| 71 | Dallas, TX | 36.3 | 9 | 0.68 | 81 | 11.0 | 1,319,030 |
| 72 | Toledo, OH | 34.5 | 2 | 0.76 | 83 | 6.6 | 264,251 |
| 73 | Omaha, NE | 34.1 | 3 | 0.61 | 81 | 10.4 | 493,472 |
| 74 | Chandler, AZ | 32.4 | 4 | 1.41 | 59 | 3.9 | 284,403 |
| 75 | Arlington, TX | 31.0 | 3 | 0.75 | 71 | 9.3 | 402,662 |
| 76 | Orlando, FL | 30.8 | 3 | 0.89 | 71 | 6.3 | 337,174 |
| 77 | Phoenix, AZ | 30.8 | 13 | 0.77 | 50 | 15.5 | 1,680,720 |
| 78 | Irving, TX | 29.9 | 3 | 1.16 | 63 | 5.7 | 259,715 |
| 79 | Stockton, CA | 29.5 | 3 | 0.93 | 74 | 3.1 | 323,667 |
| 80 | Newark, NJ | 28.9 | 1 | 0.32 | 91 | 6.0 | 313,217 |
| 81 | Durham, NC | 28.2 | 4 | 1.31 | 45 | 4.4 | 304,921 |
| 82 | Frisco, TX | 26.1 | 2 | 0.85 | 69 | 5.2 | 236,070 |
| 83 | Charlotte-Mecklenburg County, NC | 26.1 | 14 | 1.16 | 40 | 6.7 | 1,206,110 |
| 84 | Corpus Christi, TX | 25.8 | 2 | 0.63 | 75 | 6.4 | 318,339 |
| 85 | Louisville-Jefferson County, KY | 25.7 | 7 | 1.10 | 38 | 8.1 | 636,226 |
| 86 | Jacksonville, FL | 25.1 | 7 | 0.69 | 35 | 19.0 | 1,008,868 |
| 87 | Lubbock, TX | 24.1 | 3 | 1.11 | 50 | 3.5 | 269,205 |
| 88 | Los Angeles, CA | 23.7 | 15 | 0.39 | 62 | 13.4 | 3,814,386 |
| 89 | Tulsa, OK | 23.1 | 3 | 0.71 | 64 | 7.0 | 425,469 |
| 90 | Winston-Salem, NC | 22.7 | 3 | 1.16 | 36 | 4.5 | 258,120 |
| 91 | Fort Worth, TX | 22.7 | 6 | 0.59 | 73 | 6.4 | 1,009,355 |
| 92 | Gilbert, AZ | 19.3 | 2 | 0.69 | 63 | 6.3 | 289,542 |
| 93 | Memphis, TN | 18.9 | 5 | 0.81 | 45 | 6.3 | 614,450 |
| 94 | Garland, TX | 17.6 | 1 | 0.40 | 63 | 8.3 | 252,488 |
| 95 | Riverside, CA | 16.3 | 2 | 0.63 | 48 | 8.0 | 318,983 |
| 96 | Santa Ana, CA | 15.3 | 0 | 0.00 | 74 | 3.2 | 307,387 |
| 97 | Mesa, AZ | 11.7 | 3 | 0.57 | 63 | 2.8 | 523,187 |
| 98 | Oklahoma City, OK | 7.1 | 3 | 0.42 | 41 | 4.6 | 718,231 |
Boise has the most dog parks per resident of any big city, 9.07 per 100,000. It ranks 16th overall because only 75% of residents live within a 10-minute walk of a park.
Nine cities reach 99% or 100% walkable park access: San Francisco, Washington, Arlington, St. Paul, Jersey City, Boston, Minneapolis, New York and Seattle.
The median city among the 98 has 1.43 dog parks per 100,000 residents, 75% walkable park access and 9.3% of its land in parks. For the full dog park ranking, see our report on dog parks by city.
How the biggest US cities rank for dogs
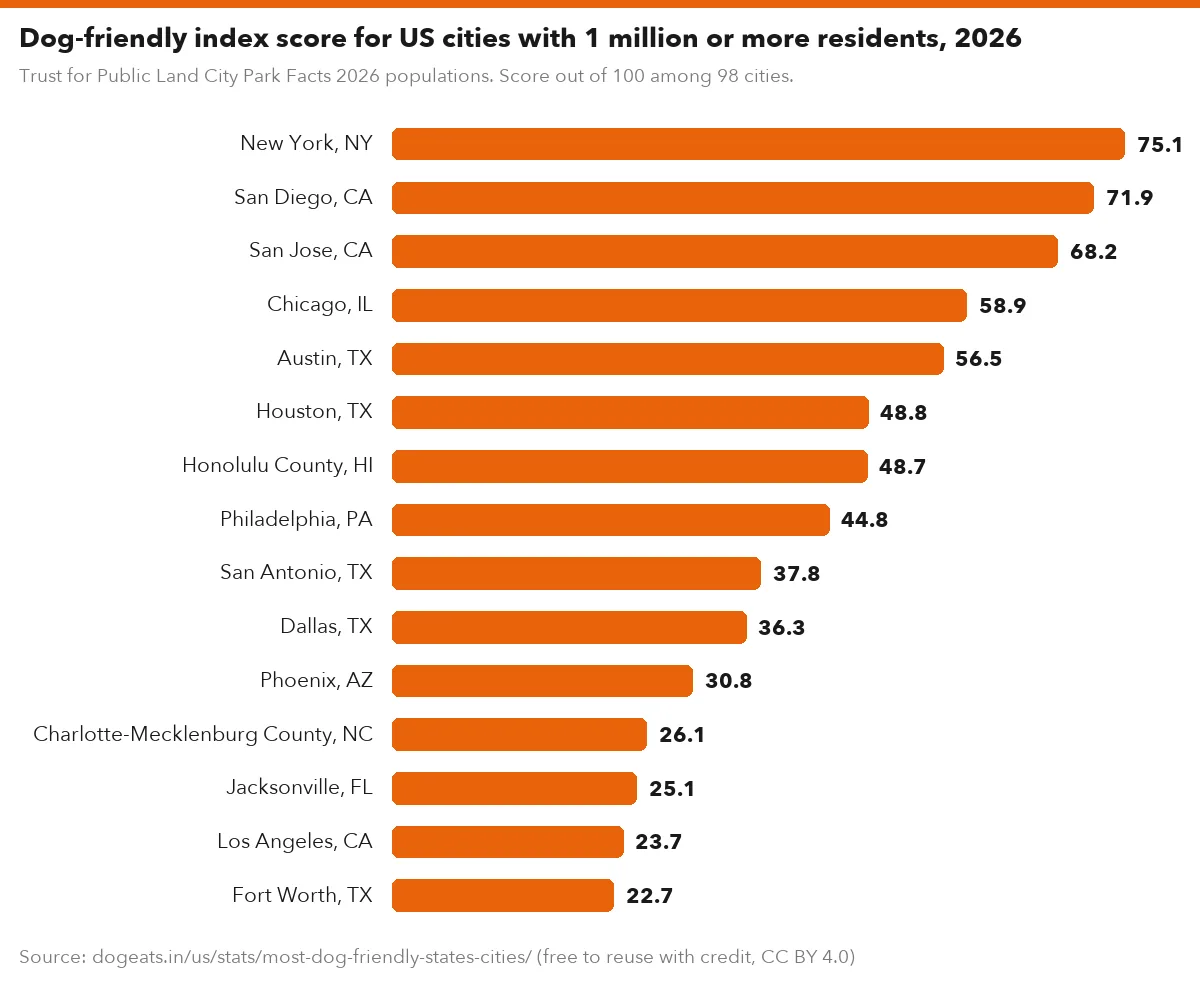
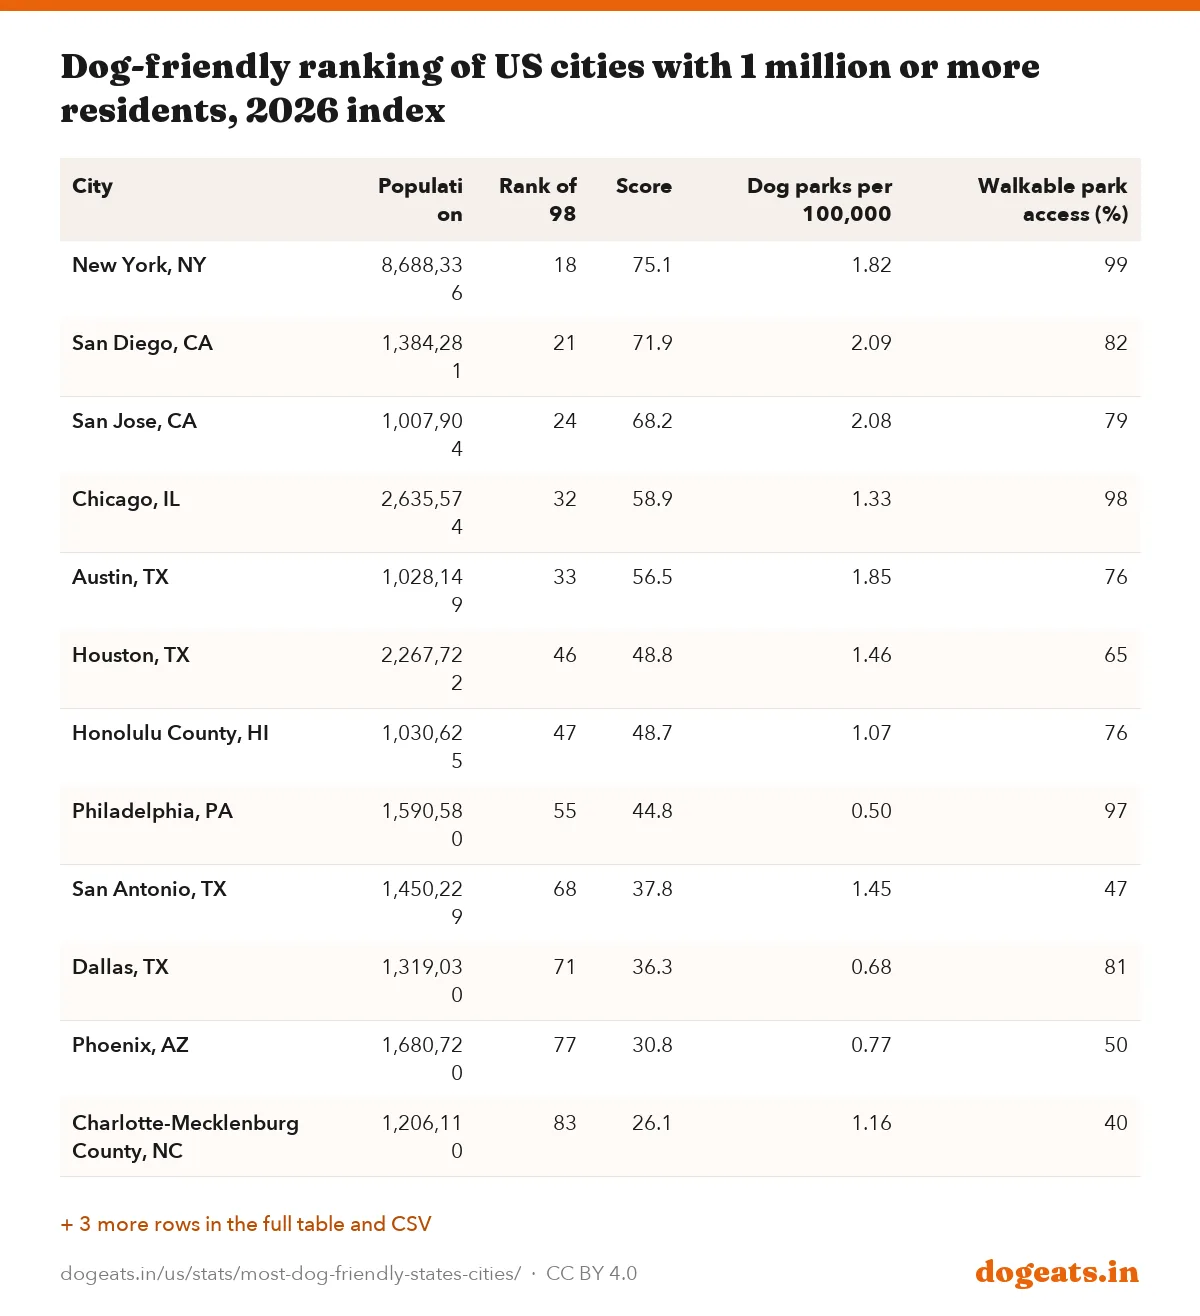
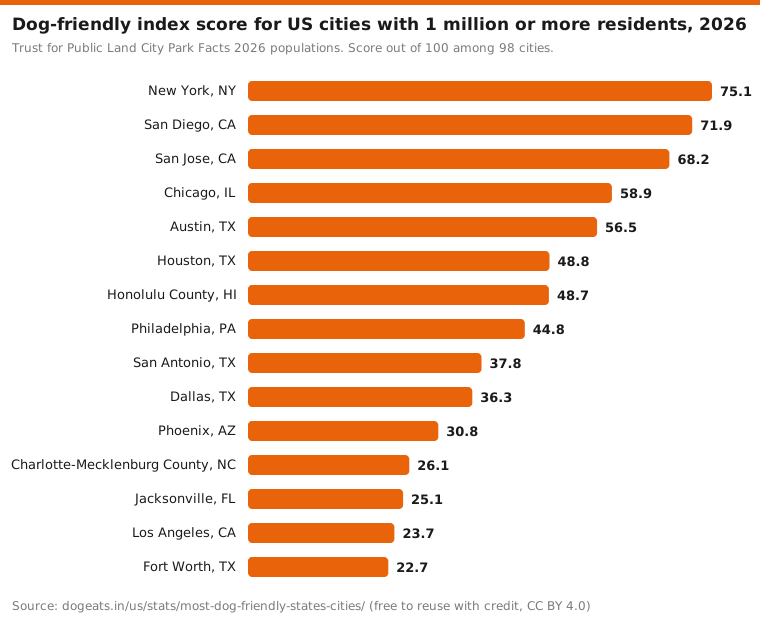
New York is the highest-ranked city with a million or more residents, at 18th. It has 158 dog parks, the most of any city, and 99% walkable park access.
San Diego ranks 21st and San Jose 24th. Los Angeles ranks 88th, with 15 dog parks for 3,814,386 residents, or 0.39 per 100,000.
Texas has 14 cities in the 98 and none in the top 30. Austin ranks highest at 33rd, and Fort Worth ranks 91st.
Trust for Public Land City Park Facts 2026 populations. Score out of 100 among 98 cities.
Show the numbers
| Label | score |
|---|---|
| New York, NY | 75.1 |
| San Diego, CA | 71.9 |
| San Jose, CA | 68.2 |
| Chicago, IL | 58.9 |
| Austin, TX | 56.5 |
| Houston, TX | 48.8 |
| Honolulu County, HI | 48.7 |
| Philadelphia, PA | 44.8 |
| San Antonio, TX | 37.8 |
| Dallas, TX | 36.3 |
| Phoenix, AZ | 30.8 |
| Charlotte-Mecklenburg County, NC | 26.1 |
| Jacksonville, FL | 25.1 |
| Los Angeles, CA | 23.7 |
| Fort Worth, TX | 22.7 |
Embed this chart
| City | Population | Rank of 98 | Score | Dog parks per 100,000 | Walkable park access (%) |
|---|---|---|---|---|---|
| New York, NY | 8,688,336 | 18 | 75.1 | 1.82 | 99 |
| San Diego, CA | 1,384,281 | 21 | 71.9 | 2.09 | 82 |
| San Jose, CA | 1,007,904 | 24 | 68.2 | 2.08 | 79 |
| Chicago, IL | 2,635,574 | 32 | 58.9 | 1.33 | 98 |
| Austin, TX | 1,028,149 | 33 | 56.5 | 1.85 | 76 |
| Houston, TX | 2,267,722 | 46 | 48.8 | 1.46 | 65 |
| Honolulu County, HI | 1,030,625 | 47 | 48.7 | 1.07 | 76 |
| Philadelphia, PA | 1,590,580 | 55 | 44.8 | 0.50 | 97 |
| San Antonio, TX | 1,450,229 | 68 | 37.8 | 1.45 | 47 |
| Dallas, TX | 1,319,030 | 71 | 36.3 | 0.68 | 81 |
| Phoenix, AZ | 1,680,720 | 77 | 30.8 | 0.77 | 50 |
| Charlotte-Mecklenburg County, NC | 1,206,110 | 83 | 26.1 | 1.16 | 40 |
| Jacksonville, FL | 1,008,868 | 86 | 25.1 | 0.69 | 35 |
| Los Angeles, CA | 3,814,386 | 88 | 23.7 | 0.39 | 62 |
| Fort Worth, TX | 1,009,355 | 91 | 22.7 | 0.59 | 73 |
Florida's big cities split. Miami ranks 22nd, St. Petersburg 26th and Tampa 29th, while Jacksonville ranks 86th.
California has 17 cities in the index, from San Francisco in first place to Santa Ana in 96th. Santa Ana is the only city of the 98 with zero dog parks in the Trust for Public Land count.
Cities with the fewest dog parks and least park access
Oklahoma City ranks last of the 98 cities, scoring 7.1. It has 3 dog parks for 718,231 residents, or 0.42 per 100,000, and 41% of residents live within a 10-minute walk of a park.
Mesa, Arizona is 97th with 3 dog parks and 2.8% of city land in parks. Santa Ana, California is 96th with zero dog parks.
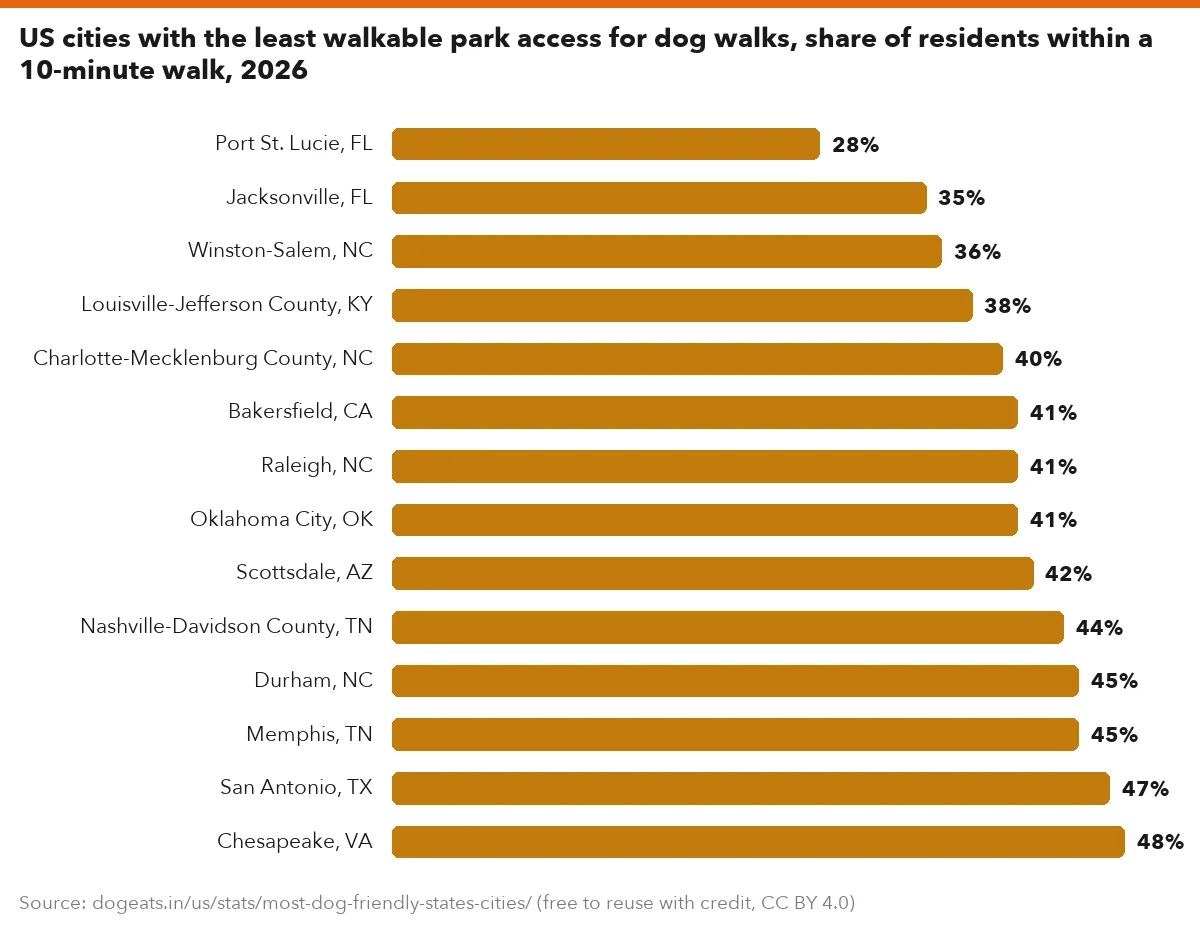
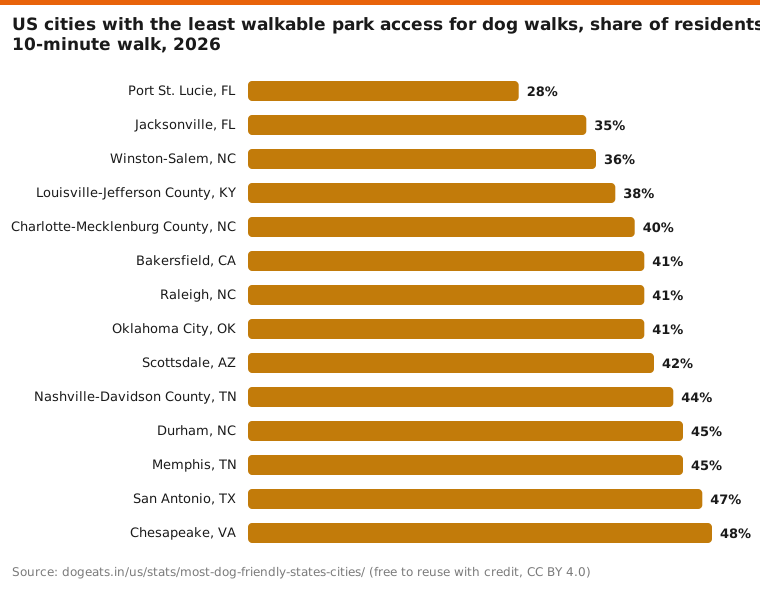
Low walkable access hurts several Southern and Sun Belt cities. Port St. Lucie, Florida has the lowest share of residents near a park, at 28%, followed by Jacksonville at 35% and Winston-Salem at 36%.
Trust for Public Land City Park Facts 2026, walkable park access.
Show the numbers
| Label | % |
|---|---|
| Port St. Lucie, FL | 28% |
| Jacksonville, FL | 35% |
| Winston-Salem, NC | 36% |
| Louisville-Jefferson County, KY | 38% |
| Charlotte-Mecklenburg County, NC | 40% |
| Bakersfield, CA | 41% |
| Raleigh, NC | 41% |
| Oklahoma City, OK | 41% |
| Scottsdale, AZ | 42% |
| Nashville-Davidson County, TN | 44% |
| Durham, NC | 45% |
| Memphis, TN | 45% |
| San Antonio, TX | 47% |
| Chesapeake, VA | 48% |
Embed this chart
Walkable park access matters for daily dog walks. In the median large city, 75% of residents live within a 10-minute walk of a park.
Trust for Public Land counts 1,063 dog parks across the 98 cities in our index, an average of 10.8 per city.
How the dog-friendly index works and how stable it is
Each measure is converted to a percentile score from 0 to 100, so a state or city is scored by its place among the others. This keeps outliers, such as Anchorage's 84.4% parkland, from swamping the index.
We then take a weighted average. Weights are our editorial choice, so we also show each ranking with equal weights.
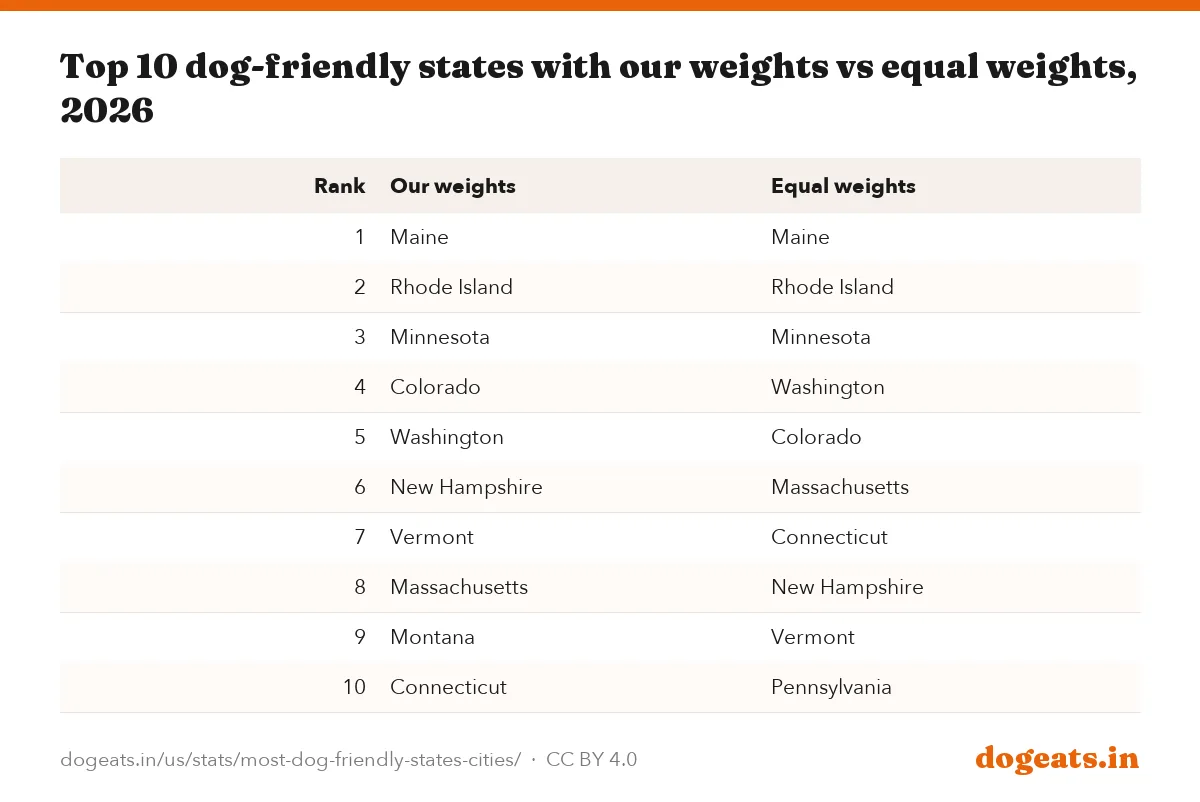
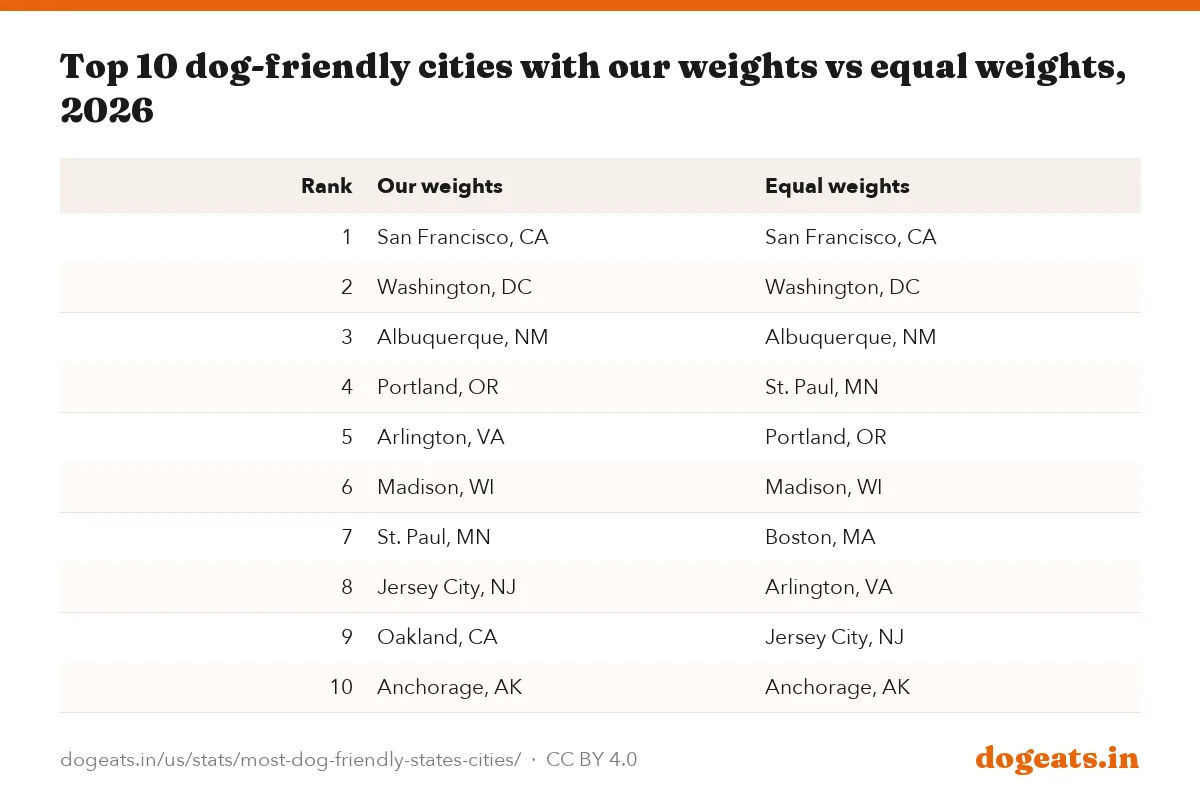
The rankings are fairly stable. With equal weights, the top three states and the top three cities do not change.
| Index | Measure | Weight (%) | Source and year |
|---|---|---|---|
| States | Veterinarians per 100,000 residents | 30 | BLS OEWS May 2025; Census Vintage 2025 |
| States | Share of shelters at no-kill | 30 | Best Friends Pet Lifesaving Dashboard, October 2026 |
| States | Average June to August high (lower is better) | 20 | NOAA Climate at a Glance, 2017 to 2026 |
| States | State law limits breed-specific local rules | 20 | State statutes, dogeats.in breed-law tracker, October 2026 |
| Cities | Dog parks per 100,000 residents | 50 | Trust for Public Land City Park Facts 2026 |
| Cities | Residents within a 10-minute walk of a park | 30 | Trust for Public Land City Park Facts 2026 |
| Cities | Parks as % of city area | 20 | Trust for Public Land City Park Facts 2026 |
| Rank | Our weights | Equal weights |
|---|---|---|
| 1 | Maine | Maine |
| 2 | Rhode Island | Rhode Island |
| 3 | Minnesota | Minnesota |
| 4 | Colorado | Washington |
| 5 | Washington | Colorado |
| 6 | New Hampshire | Massachusetts |
| 7 | Vermont | Connecticut |
| 8 | Massachusetts | New Hampshire |
| 9 | Montana | Vermont |
| 10 | Connecticut | Pennsylvania |
| Rank | Our weights | Equal weights |
|---|---|---|
| 1 | San Francisco, CA | San Francisco, CA |
| 2 | Washington, DC | Washington, DC |
| 3 | Albuquerque, NM | Albuquerque, NM |
| 4 | Portland, OR | St. Paul, MN |
| 5 | Arlington, VA | Portland, OR |
| 6 | Madison, WI | Madison, WI |
| 7 | St. Paul, MN | Boston, MA |
| 8 | Jersey City, NJ | Arlington, VA |
| 9 | Oakland, CA | Jersey City, NJ |
| 10 | Anchorage, AK | Anchorage, AK |
Among the top 10 states, Montana moves most, from ninth with our weights to 12th with equal weights, and Pennsylvania enters the equal-weight top 10. Among cities, Arlington, Virginia moves from fifth to eighth and Oakland from ninth to 14th.
For costs that vary by state, such as vet bills, see our cost of owning a dog report and our veterinarians by state data.
Frequently asked questions
What is the most dog-friendly state in the US?
Maine, in our 2026 index, with a score of 93.2 out of 100. It combines 42.4 vets per 100,000 residents, 96.2% no-kill shelters, mild summers and a state limit on breed-specific rules. Rhode Island and Minnesota rank second and third.
What is the most dog-friendly city in the US?
San Francisco, scoring 96.0 among 98 large cities. It has 44 dog parks and 100% of residents within a 10-minute walk of a park. Washington, DC and Albuquerque follow.
What is the least dog-friendly state?
Mississippi ranks last of 50 states with 3.9. It has the fewest vets per resident, 16.2 per 100,000, and hot summers. Alabama and Louisiana are next from the bottom.
Which city has the most dog parks?
New York has the most, 158. Per resident, Boise leads with 9.07 dog parks per 100,000 people, followed by Portland, Oregon and Henderson, Nevada, according to Trust for Public Land's 2026 data.
Which big US city is best for dogs?
Among cities with a million or more residents, New York ranks highest at 18th of 98, followed by San Diego at 21st and San Jose at 24th. Fort Worth ranks lowest at 91st.
Is Texas a dog-friendly state?
Texas ranks 41st of 50 states in our index. It limits breed-based dangerous dog rules, but it has hot summers averaging 95.1°F, 19.8 vets per 100,000 residents and 48.9% of shelters at no-kill. Austin is its highest-ranked city, at 33rd.
How was the dog-friendly index calculated?
States are scored on vets per resident (30%), no-kill shelter share (30%), summer heat (20%) and state breed-law limits (20%). Cities are scored on dog parks per resident (50%), walkable park access (30%) and park space (20%). Each measure is a percentile score from 0 to 100.
Why is Washington, DC not in the state ranking?
We found no NOAA statewide summer temperature series for DC, and Best Friends lists a single, estimated shelter there. DC does appear in the city index, where it ranks second of 98 large cities.
Methodology and limitations
State index: veterinarian employment for May 2025 comes from BLS Occupational Employment and Wage Statistics (occupation 29-1131). We pulled it from the BLS public API on October 11, 2026 and divided it by Census Vintage 2025 population. The share of shelters at no-kill is the state figure in Best Friends Animal Society's dashboard file, downloaded October 11, 2026.
Summer heat is NOAA's statewide June to August average maximum temperature for each year 2017 to 2026, averaged over the 10 years. Breed-law status comes from our breed-specific laws tracker, which reads each state statute.
City index: dog parks per 100,000 residents, walkable park access and parks as a share of adjusted city area come from Trust for Public Land's 2026 City Park Facts tables. Huntsville, Alabama lacks a parkland figure in the 2026 tables and Trust for Public Land lists 99 cities with dog park data, so 98 cities are scored.
Each measure becomes a percentile score from 0 to 100, with ties averaged; the breed-law measure is 100 or 0. Scores are weighted averages. Weights are dogeats.in editorial choices, and we publish equal-weight rankings for comparison.
Sources
- Trust for Public Land, City Park Facts 2026 data tables, Dog parks, walkable park access and park area for 98 cities
- Bureau of Labor Statistics, Occupational Employment and Wage Statistics, May 2025, Veterinarians employed by state
- NOAA National Centers for Environmental Information, Climate at a Glance statewide time series, June to August maximum temperature, 2017 to 2026
- Also consulted: Best Friends Animal Society, Pet Lifesaving Dashboard (advocacy group data), US Census Bureau, Vintage 2025 state population estimates, BLS public data API, OEWS series OEUS state 29-1131, Trust for Public Land, City Park Facts data archive 2010 to 2026, Michigan State University Animal Legal and Historical Center, states that prohibit breed-specific legislation.
Cite, embed and download
This report, its data and its images are free to reuse under a Creative Commons Attribution 4.0 licence. Credit dogeats.in with a link to this page. Every chart has its own embed code, every table has a CSV and an image download, and the images below are ready for social posts, slides and articles.
Cite this report
Link to this report
Every chart and table as an image