Ranking · Updated October 2026
Which US cities have the most dog parks? Boise leads the 2026 rankings by a wide margin
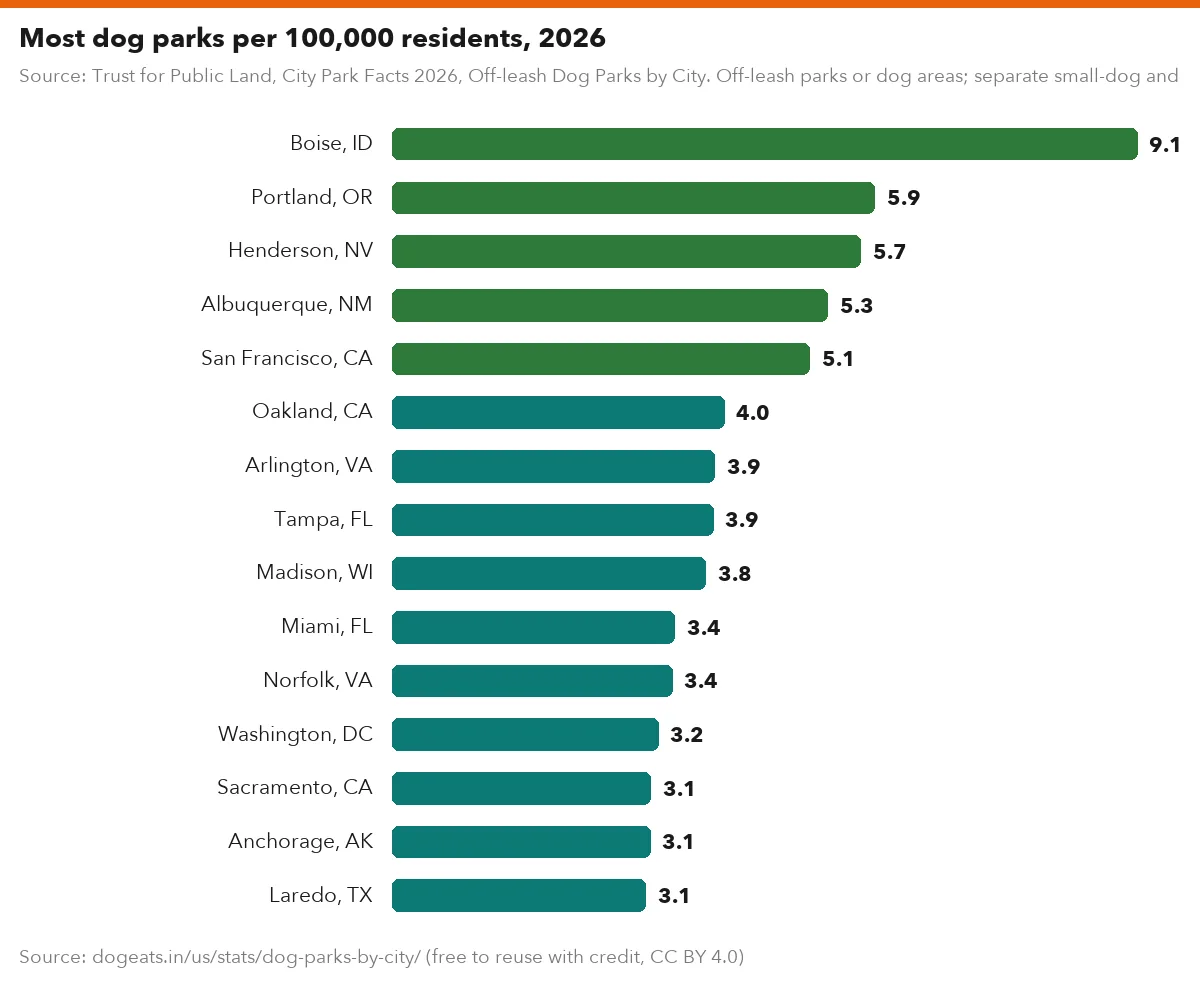
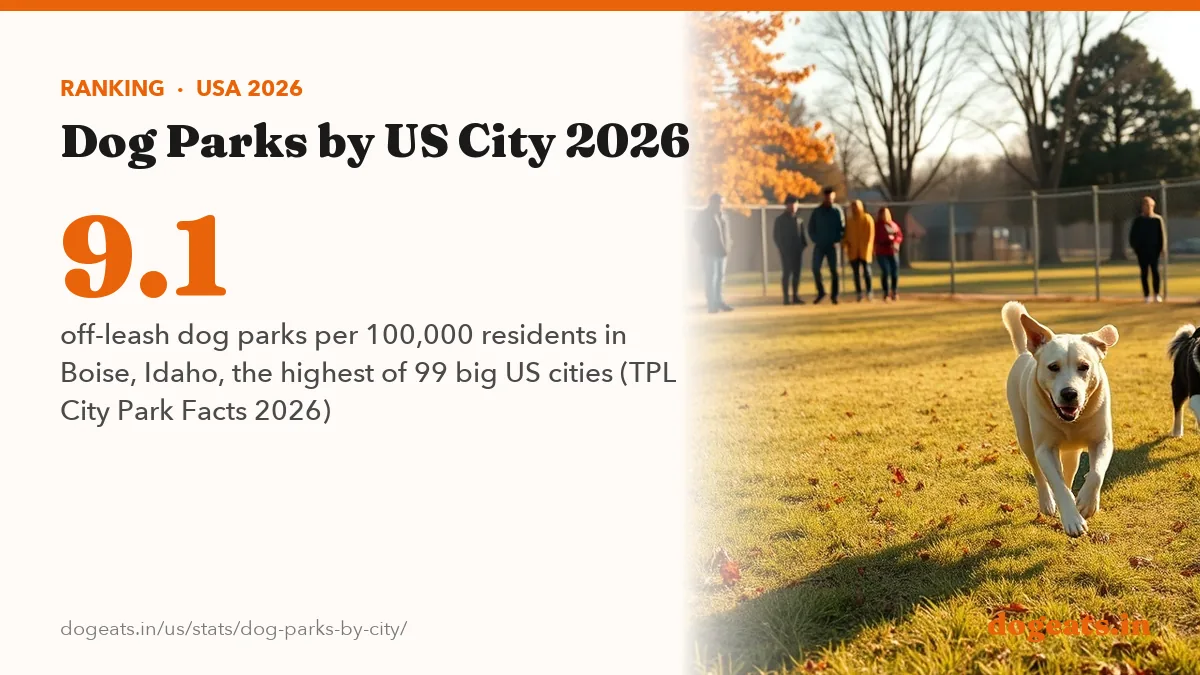
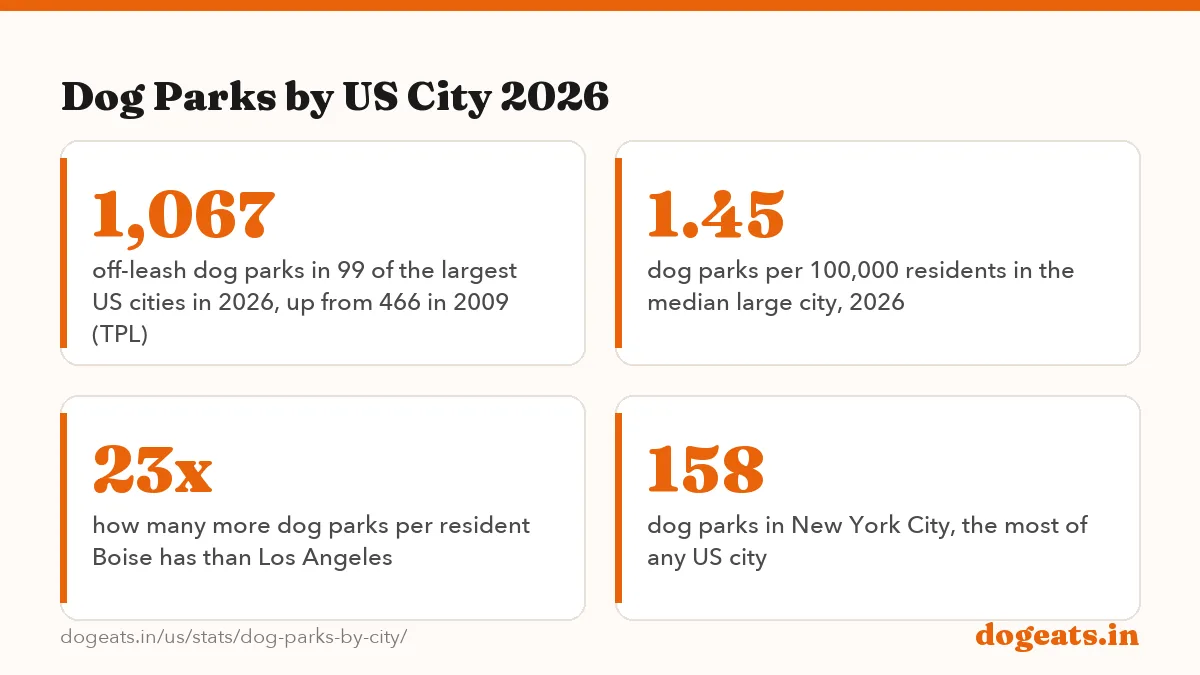
Boise, Idaho has the most dog parks per resident of any big US city, with 22 off-leash parks or 9.1 per 100,000 people in Trust for Public Land's 2026 data. Portland, Henderson, Albuquerque and San Francisco follow. Across 99 large cities the count reached 1,067, up from 466 in 2009.
Key findings
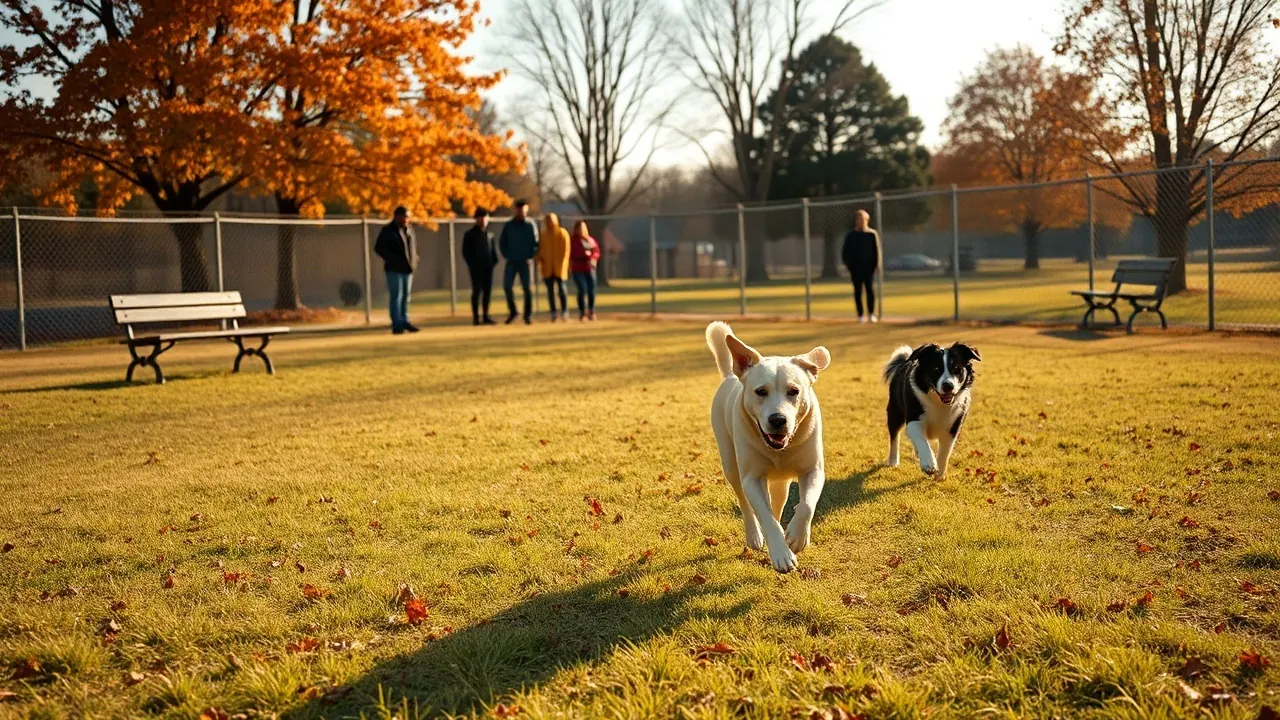
- Boise, Idaho has 9.1 off-leash dog parks per 100,000 residents, the highest rate among 99 large US cities in Trust for Public Land's 2026 City Park Facts.
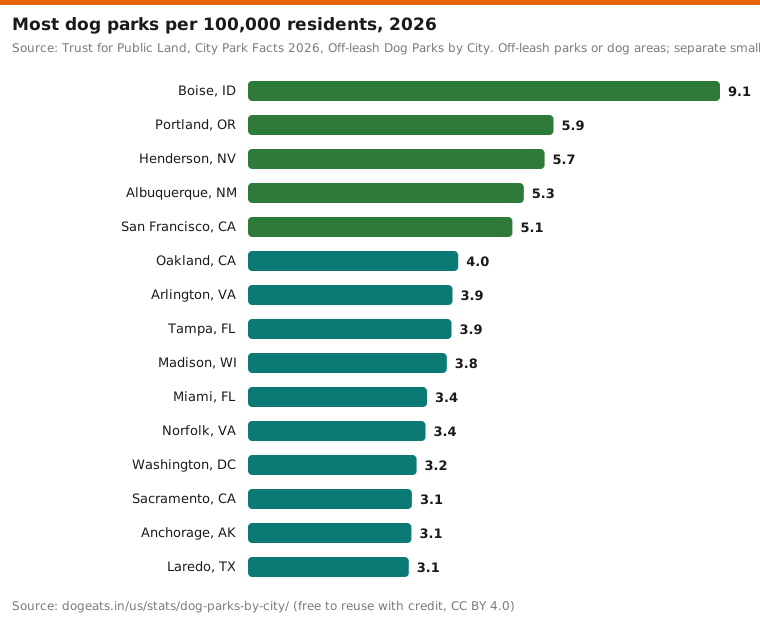
- Portland (5.9), Henderson (5.7), Albuquerque (5.3) and San Francisco (5.1) complete the top five.
- Los Angeles has 15 dog parks for 3.8 million people, or 0.39 per 100,000, which means one dog park for every 254,292 residents.
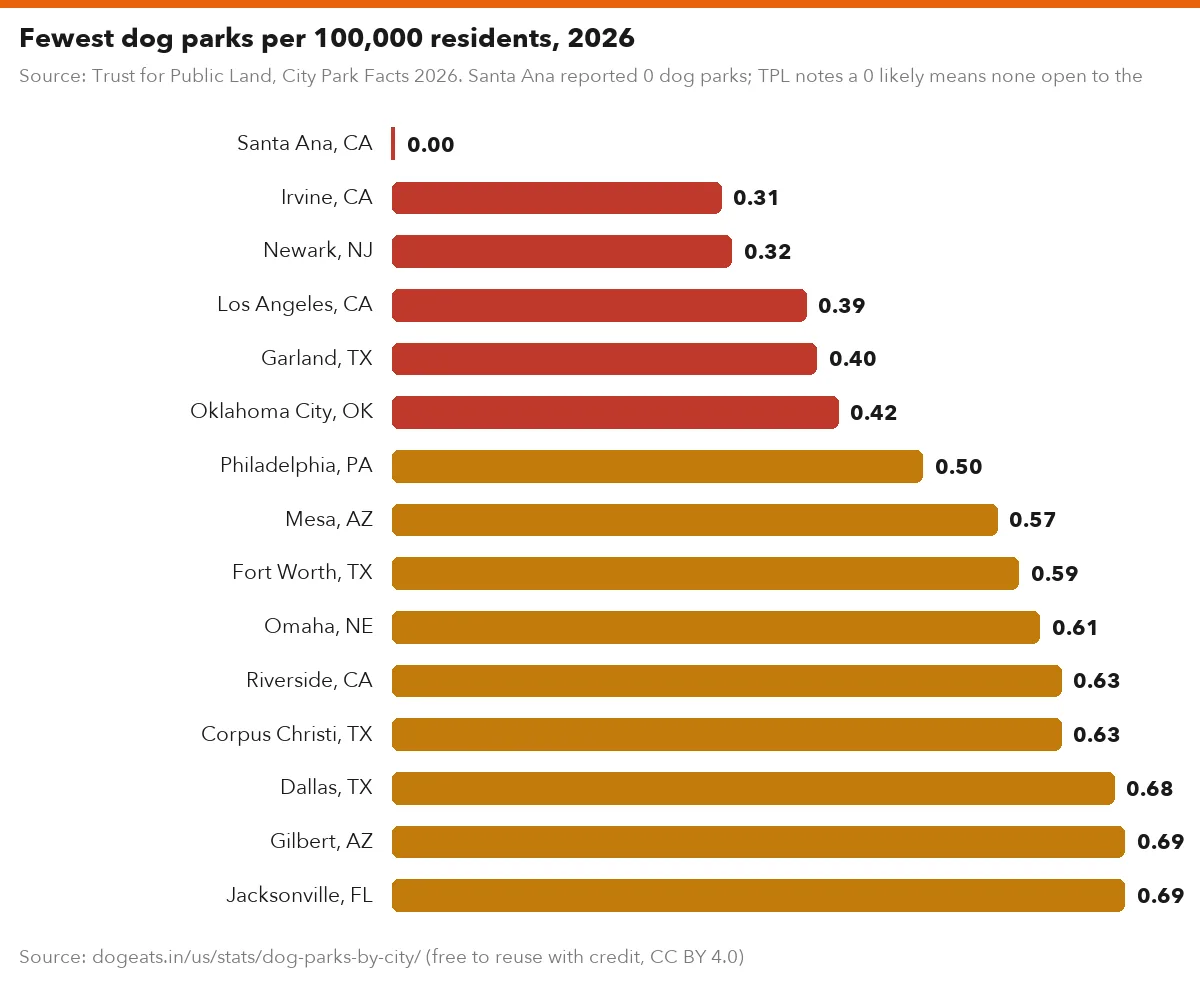
- Santa Ana, California reported no public dog parks, and Irvine and Newark reported one each.
- The 100 largest cities had 466 dog parks in 2009 and 1,067 in the 2026 data, a rise of 129%.
- Among 92 cities in both the 2015 and 2026 tables, the count rose 70%, from 610 to 1,035 parks, and only two cities reported fewer.
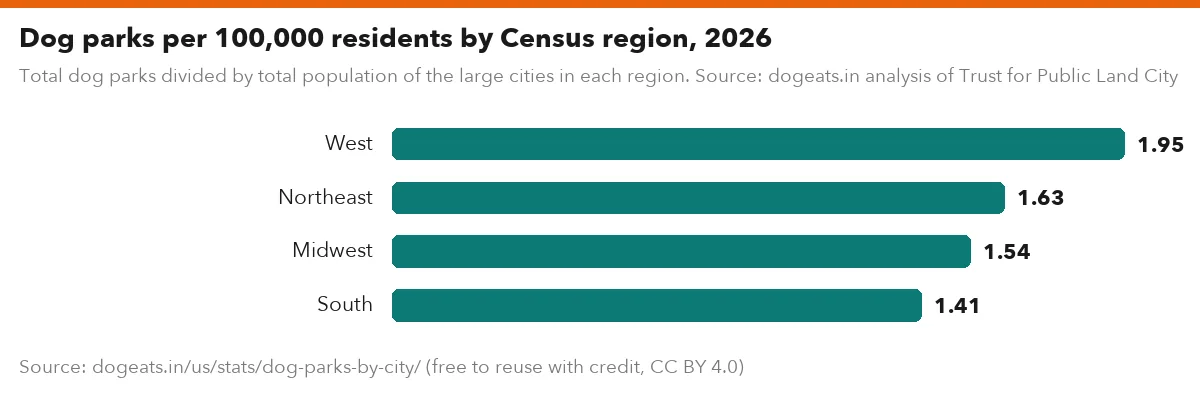
- Western cities have the most dog parks per resident, at 1.95 per 100,000 overall, while Southern cities have the fewest, at 1.41.
- Texas has 14 of the largest cities but only 1.18 dog parks per 100,000 residents across them, with Garland, Fort Worth and Dallas near the bottom.
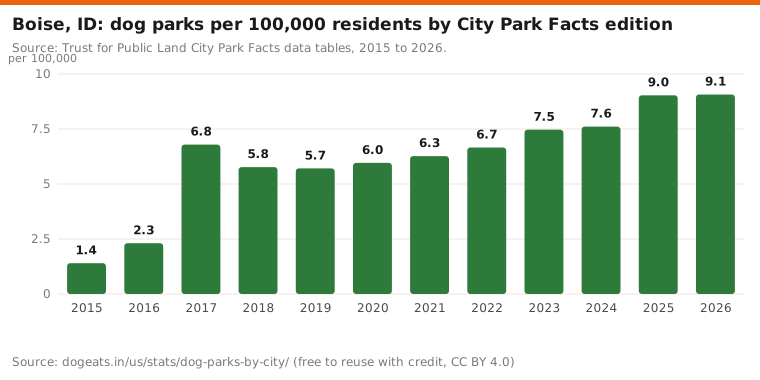
- Boise grew from 3 dog parks in the 2015 data to 22 in 2026, and has had the highest rate in every edition since 2017.
Which US city has the most dog parks per person?
Boise, Idaho has the most dog parks per person of any large US city. It reported 22 off-leash dog parks for 242,489 residents, or 9.1 per 100,000. Each park serves about 11,022 people.
Portland, Oregon is second with 5.9 per 100,000, followed by Henderson, Nevada at 5.7. Albuquerque and San Francisco both clear 5.0. Six of the top 10 are in the West.
The figures come from Trust for Public Land's City Park Facts 2026. The nonprofit surveys park agencies in the 100 most populous US cities every year. This year, 99 cities appear in its dog park table.
Source: Trust for Public Land, City Park Facts 2026, Off-leash Dog Parks by City. Off-leash parks or dog areas; separate small-dog and large-dog areas count as one.
Show the numbers
| Label | per 100,000 |
|---|---|
| Boise, ID | 9.1 |
| Portland, OR | 5.9 |
| Henderson, NV | 5.7 |
| Albuquerque, NM | 5.3 |
| San Francisco, CA | 5.1 |
| Oakland, CA | 4.0 |
| Arlington, VA | 3.9 |
| Tampa, FL | 3.9 |
| Madison, WI | 3.8 |
| Miami, FL | 3.4 |
| Norfolk, VA | 3.4 |
| Washington, DC | 3.2 |
| Sacramento, CA | 3.1 |
| Anchorage, AK | 3.1 |
| Laredo, TX | 3.1 |
Embed this chart
Cities with the fewest dog parks per resident
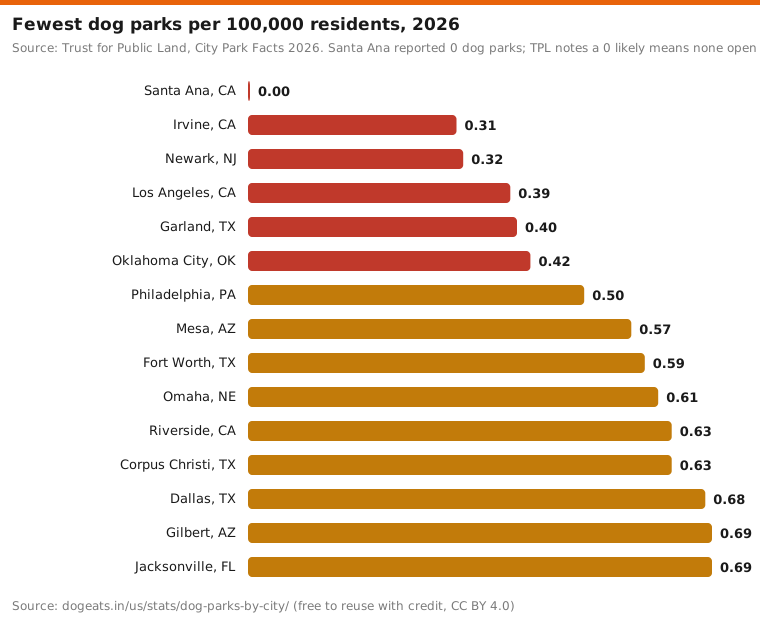
Santa Ana, California reported no public dog parks at all. Irvine and Newark reported one each, which works out to about 0.3 per 100,000 residents.
Los Angeles has the lowest rate of any very large city. Its 15 dog parks serve 3.8 million residents, or one for every 254,292 people. Philadelphia has eight for 1.6 million.
Texas cities crowd the bottom of the table. Garland, Fort Worth, Corpus Christi, Dallas and Arlington, Texas all have fewer than 0.8 dog parks per 100,000 residents.
Source: Trust for Public Land, City Park Facts 2026. Santa Ana reported 0 dog parks; TPL notes a 0 likely means none open to the public.
Show the numbers
| Label | per 100,000 |
|---|---|
| Santa Ana, CA | 0.00 |
| Irvine, CA | 0.31 |
| Newark, NJ | 0.32 |
| Los Angeles, CA | 0.39 |
| Garland, TX | 0.40 |
| Oklahoma City, OK | 0.42 |
| Philadelphia, PA | 0.50 |
| Mesa, AZ | 0.57 |
| Fort Worth, TX | 0.59 |
| Omaha, NE | 0.61 |
| Riverside, CA | 0.63 |
| Corpus Christi, TX | 0.63 |
| Dallas, TX | 0.68 |
| Gilbert, AZ | 0.69 |
| Jacksonville, FL | 0.69 |
Embed this chart
In all, 30 of the 99 cities have fewer than one dog park per 100,000 residents. Another 34 have two or more.
Dog parks per 100,000 residents in 99 large US cities
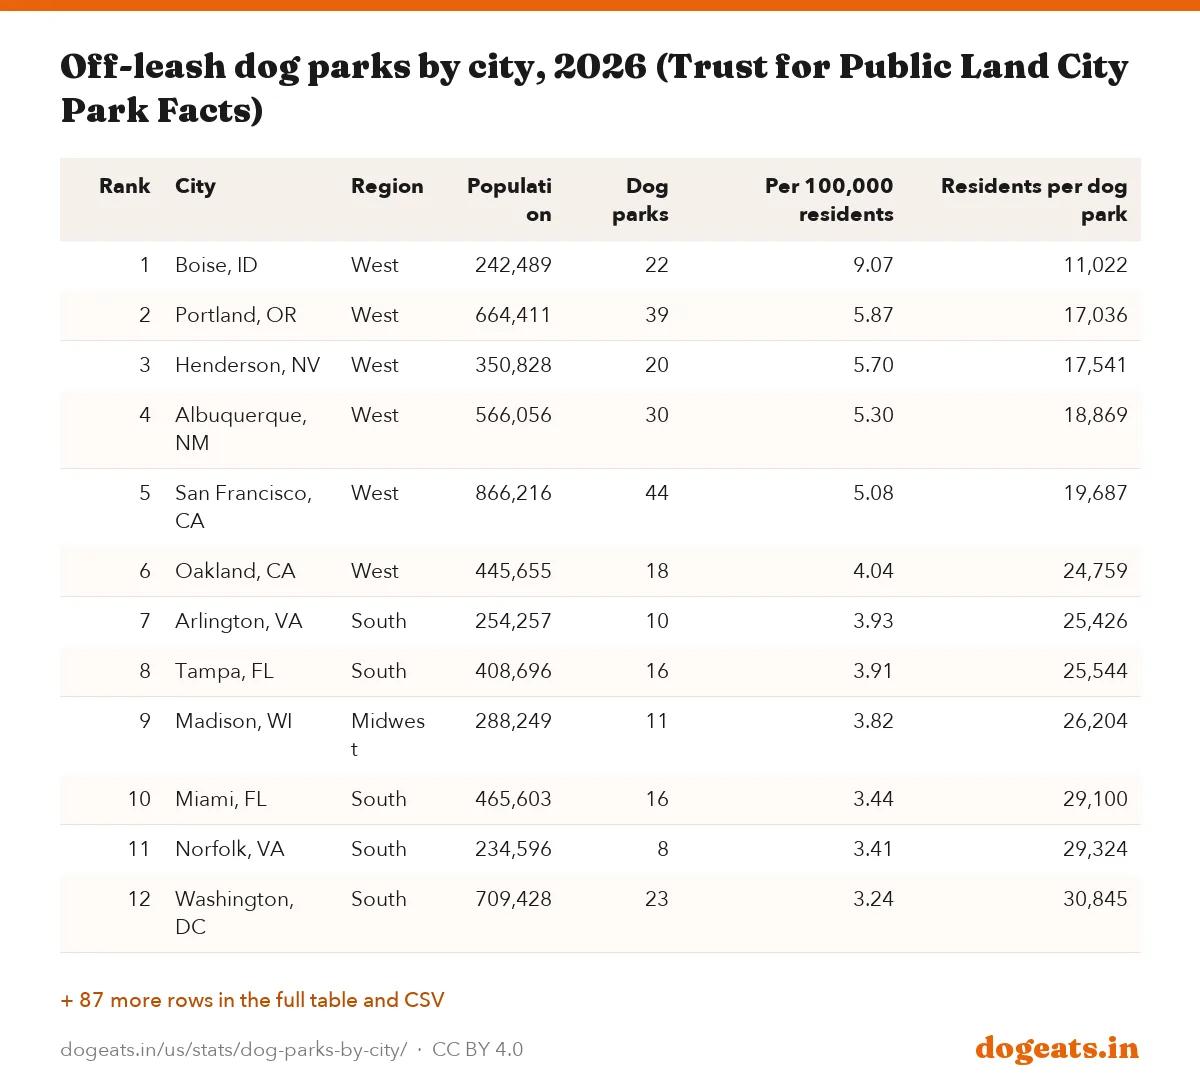
The full table ranks every city in the 2026 data. It also shows how many residents share each dog park. The median city has 1.45 dog parks per 100,000 residents, about one for every 69,000 people.
A few of the 100 largest cities are missing from the 2026 dog park table. Las Vegas reported 25 dog parks in the 2025 edition but does not appear in 2026. Columbus, Ohio last appeared in 2024 with seven.
| Rank | City | Region | Population | Dog parks | Per 100,000 residents | Residents per dog park |
|---|---|---|---|---|---|---|
| 1 | Boise, ID | West | 242,489 | 22 | 9.07 | 11,022 |
| 2 | Portland, OR | West | 664,411 | 39 | 5.87 | 17,036 |
| 3 | Henderson, NV | West | 350,828 | 20 | 5.70 | 17,541 |
| 4 | Albuquerque, NM | West | 566,056 | 30 | 5.30 | 18,869 |
| 5 | San Francisco, CA | West | 866,216 | 44 | 5.08 | 19,687 |
| 6 | Oakland, CA | West | 445,655 | 18 | 4.04 | 24,759 |
| 7 | Arlington, VA | South | 254,257 | 10 | 3.93 | 25,426 |
| 8 | Tampa, FL | South | 408,696 | 16 | 3.91 | 25,544 |
| 9 | Madison, WI | Midwest | 288,249 | 11 | 3.82 | 26,204 |
| 10 | Miami, FL | South | 465,603 | 16 | 3.44 | 29,100 |
| 11 | Norfolk, VA | South | 234,596 | 8 | 3.41 | 29,324 |
| 12 | Washington, DC | South | 709,428 | 23 | 3.24 | 30,845 |
| 13 | Sacramento, CA | West | 539,961 | 17 | 3.15 | 31,762 |
| 14 | Anchorage, AK | West | 286,721 | 9 | 3.14 | 31,858 |
| 15 | Laredo, TX | South | 259,225 | 8 | 3.09 | 32,403 |
| 16 | St. Paul, MN | Midwest | 315,526 | 9 | 2.85 | 35,058 |
| 17 | Chula Vista, CA | West | 281,855 | 8 | 2.84 | 35,232 |
| 18 | Jersey City, NJ | Northeast | 314,337 | 8 | 2.55 | 39,292 |
| 19 | Lexington, KY | South | 325,983 | 8 | 2.45 | 40,748 |
| 20 | Long Beach, CA | West | 450,339 | 11 | 2.44 | 40,940 |
| 21 | Bakersfield, CA | West | 417,614 | 10 | 2.39 | 41,761 |
| 22 | Tucson, AZ | West | 547,288 | 13 | 2.38 | 42,099 |
| 23 | Fresno, CA | West | 552,888 | 13 | 2.35 | 42,530 |
| 24 | St. Petersburg, FL | South | 263,134 | 6 | 2.28 | 43,856 |
| 25 | Pittsburgh, PA | Northeast | 308,545 | 7 | 2.27 | 44,078 |
| 26 | Denver, CO | West | 762,261 | 17 | 2.23 | 44,839 |
| 27 | Cincinnati, OH | Midwest | 317,536 | 7 | 2.20 | 45,362 |
| 28 | St. Louis, MO | Midwest | 277,903 | 6 | 2.16 | 46,317 |
| 29 | Fremont, CA | West | 237,191 | 5 | 2.11 | 47,438 |
| 30 | San Diego, CA | West | 1,384,281 | 29 | 2.09 | 47,734 |
| 31 | San Jose, CA | West | 1,007,904 | 21 | 2.08 | 47,995 |
| 32 | Minneapolis, MN | Midwest | 435,667 | 9 | 2.07 | 48,407 |
| 33 | Atlanta, GA | South | 534,033 | 11 | 2.06 | 48,548 |
| 34 | Port St. Lucie, FL | South | 243,412 | 5 | 2.05 | 48,682 |
| 35 | Wichita, KS | Midwest | 402,497 | 8 | 1.99 | 50,312 |
| 36 | Boston, MA | Northeast | 661,763 | 13 | 1.96 | 50,905 |
| 37 | Chesapeake, VA | South | 258,308 | 5 | 1.94 | 51,662 |
| 38 | Detroit, MI | Midwest | 625,512 | 12 | 1.92 | 52,126 |
| 39 | Austin, TX | South | 1,028,149 | 19 | 1.85 | 54,113 |
| 40 | New York, NY | Northeast | 8,688,336 | 158 | 1.82 | 54,989 |
| 41 | Seattle, WA | West | 773,833 | 14 | 1.81 | 55,274 |
| 42 | Reno, NV | West | 284,270 | 5 | 1.76 | 56,854 |
| 43 | Richmond, VA | South | 233,928 | 4 | 1.71 | 58,482 |
| 44 | Huntsville, AL | South | 234,876 | 4 | 1.70 | 58,719 |
| 45 | Lincoln, NE | Midwest | 300,613 | 5 | 1.66 | 60,123 |
| 46 | Raleigh, NC | South | 489,209 | 8 | 1.64 | 61,151 |
| 47 | Colorado Springs, CO | West | 507,798 | 8 | 1.58 | 63,475 |
| 48 | Glendale, AZ | West | 259,019 | 4 | 1.54 | 64,755 |
| 49 | Houston, TX | South | 2,267,722 | 33 | 1.46 | 68,719 |
| 50 | San Antonio, TX | South | 1,450,229 | 21 | 1.45 | 69,059 |
| 51 | Chandler, AZ | West | 284,403 | 4 | 1.41 | 71,101 |
| 52 | Nashville, TN | South | 730,276 | 10 | 1.37 | 73,028 |
| 53 | North Las Vegas, NV | West | 293,010 | 4 | 1.37 | 73,252 |
| 54 | Chicago, IL | Midwest | 2,635,574 | 35 | 1.33 | 75,302 |
| 55 | Durham, NC | South | 304,921 | 4 | 1.31 | 76,230 |
| 56 | Greensboro, NC | South | 306,925 | 4 | 1.30 | 76,731 |
| 57 | Santa Clarita, CA | West | 231,478 | 3 | 1.30 | 77,159 |
| 58 | Spokane, WA | West | 239,389 | 3 | 1.25 | 79,796 |
| 59 | Scottsdale, AZ | West | 249,257 | 3 | 1.20 | 83,086 |
| 60 | Anaheim, CA | West | 342,462 | 4 | 1.17 | 85,616 |
| 61 | Winston-Salem, NC | South | 258,120 | 3 | 1.16 | 86,040 |
| 62 | Charlotte-Mecklenburg, NC | South | 1,206,110 | 14 | 1.16 | 86,151 |
| 63 | Irving, TX | South | 259,715 | 3 | 1.16 | 86,572 |
| 64 | Lubbock, TX | South | 269,205 | 3 | 1.11 | 89,735 |
| 65 | Louisville, KY | South | 636,226 | 7 | 1.10 | 90,889 |
| 66 | Virginia Beach, VA | South | 456,754 | 5 | 1.09 | 91,351 |
| 67 | Buffalo, NY | Northeast | 280,445 | 3 | 1.07 | 93,482 |
| 68 | Honolulu County, HI | West | 1,030,625 | 11 | 1.07 | 93,693 |
| 69 | Plano, TX | South | 290,698 | 3 | 1.03 | 96,899 |
| 70 | Kansas City, MO | Midwest | 521,818 | 5 | 0.96 | 104,364 |
| 71 | Stockton, CA | West | 323,667 | 3 | 0.93 | 107,889 |
| 72 | Orlando, FL | South | 337,174 | 3 | 0.89 | 112,391 |
| 73 | Baltimore, MD | South | 563,225 | 5 | 0.89 | 112,645 |
| 74 | Milwaukee, WI | Midwest | 563,343 | 5 | 0.89 | 112,669 |
| 75 | Frisco, TX | South | 236,070 | 2 | 0.85 | 118,035 |
| 76 | Cleveland, OH | Midwest | 367,331 | 3 | 0.82 | 122,444 |
| 77 | Memphis, TN | South | 614,450 | 5 | 0.81 | 122,890 |
| 78 | New Orleans, LA | South | 376,001 | 3 | 0.80 | 125,334 |
| 79 | Phoenix, AZ | West | 1,680,720 | 13 | 0.77 | 129,286 |
| 80 | Toledo, OH | Midwest | 264,251 | 2 | 0.76 | 132,126 |
| 81 | El Paso, TX | South | 670,285 | 5 | 0.75 | 134,057 |
| 82 | Arlington, TX | South | 402,662 | 3 | 0.75 | 134,221 |
| 83 | Aurora, CO | West | 411,009 | 3 | 0.73 | 137,003 |
| 84 | Tulsa, OK | South | 425,469 | 3 | 0.71 | 141,823 |
| 85 | Jacksonville, FL | South | 1,008,868 | 7 | 0.69 | 144,124 |
| 86 | Gilbert, AZ | West | 289,542 | 2 | 0.69 | 144,771 |
| 87 | Dallas, TX | South | 1,319,030 | 9 | 0.68 | 146,559 |
| 88 | Corpus Christi, TX | South | 318,339 | 2 | 0.63 | 159,170 |
| 89 | Riverside, CA | West | 318,983 | 2 | 0.63 | 159,492 |
| 90 | Omaha, NE | Midwest | 493,472 | 3 | 0.61 | 164,491 |
| 91 | Fort Worth, TX | South | 1,009,355 | 6 | 0.59 | 168,226 |
| 92 | Mesa, AZ | West | 523,187 | 3 | 0.57 | 174,396 |
| 93 | Philadelphia, PA | Northeast | 1,590,580 | 8 | 0.50 | 198,822 |
| 94 | Oklahoma City, OK | South | 718,231 | 3 | 0.42 | 239,410 |
| 95 | Garland, TX | South | 252,488 | 1 | 0.40 | 252,488 |
| 96 | Los Angeles, CA | West | 3,814,386 | 15 | 0.39 | 254,292 |
| 97 | Newark, NJ | Northeast | 313,217 | 1 | 0.32 | 313,217 |
| 98 | Irvine, CA | West | 324,586 | 1 | 0.31 | 324,586 |
| 99 | Santa Ana, CA | West | 307,387 | 0 | 0.00 | none |
Dog parks by region and state
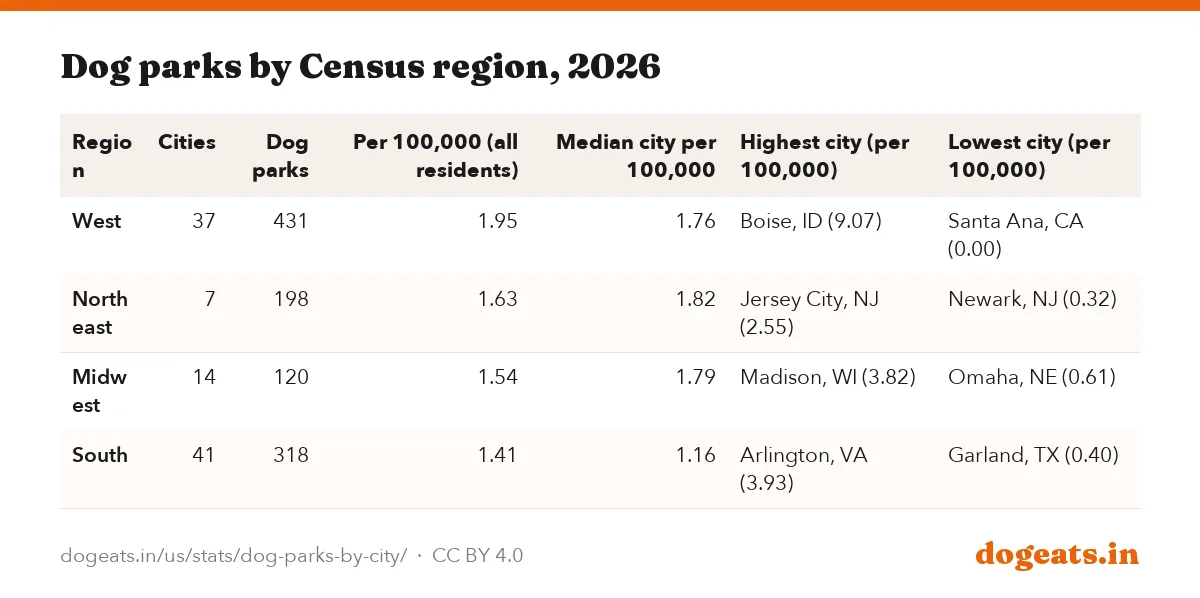
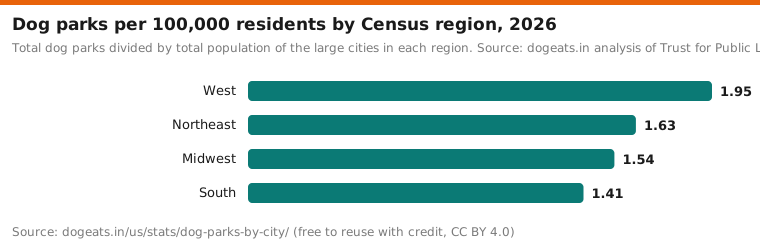
Western cities have the most dog parks per resident. Across 37 Western cities in the data, there are 1.95 dog parks per 100,000 people. Southern cities have the fewest, at 1.41, and the lowest median of any region.
The Northeast figure leans on New York City, which has 158 of the region's 198 dog parks. Midwestern cities average 1.54 per 100,000, led by Madison, Wisconsin at 3.8.
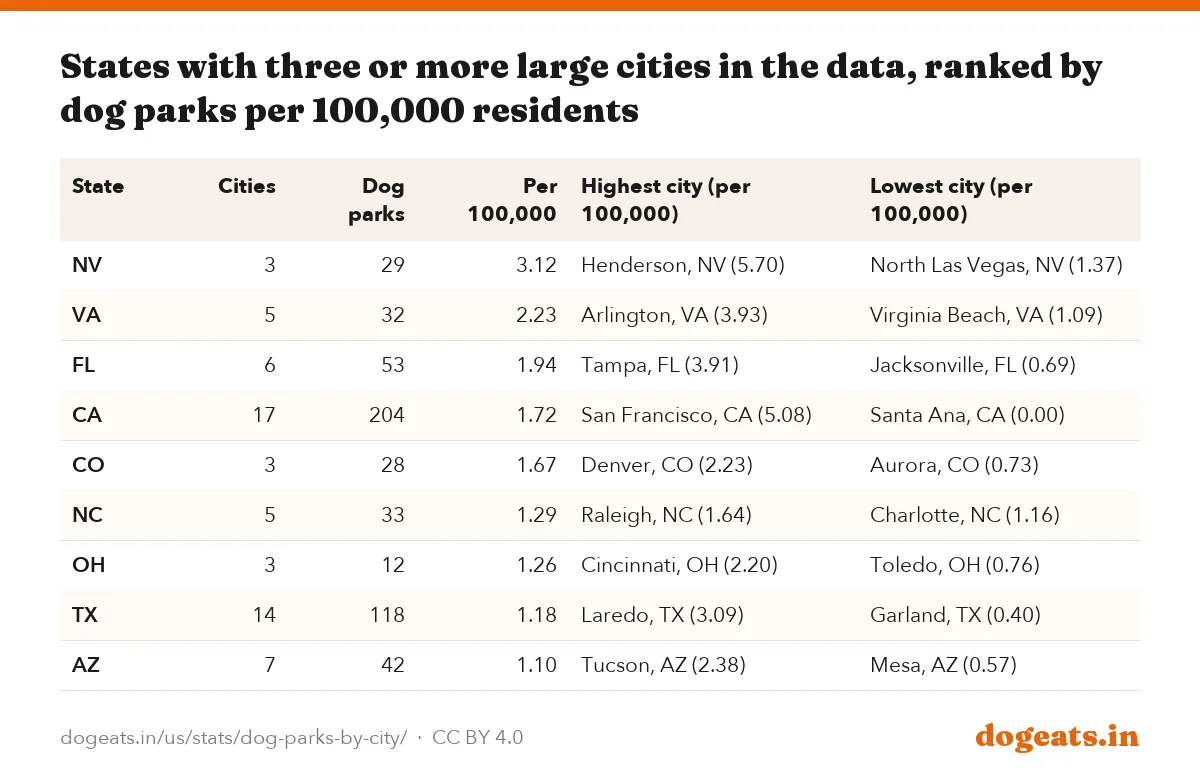
States with several big cities show wide gaps inside their borders. California's 17 cities run from San Francisco at 5.1 to Santa Ana at zero. Texas has 14 large cities, and only Laredo tops 2.0.
Total dog parks divided by total population of the large cities in each region. Source: dogeats.in analysis of Trust for Public Land City Park Facts 2026.
Show the numbers
| Label | per 100,000 |
|---|---|
| West | 1.95 |
| Northeast | 1.63 |
| Midwest | 1.54 |
| South | 1.41 |
Embed this chart
| Region | Cities | Dog parks | Per 100,000 (all residents) | Median city per 100,000 | Highest city (per 100,000) | Lowest city (per 100,000) |
|---|---|---|---|---|---|---|
| West | 37 | 431 | 1.95 | 1.76 | Boise, ID (9.07) | Santa Ana, CA (0.00) |
| Northeast | 7 | 198 | 1.63 | 1.82 | Jersey City, NJ (2.55) | Newark, NJ (0.32) |
| Midwest | 14 | 120 | 1.54 | 1.79 | Madison, WI (3.82) | Omaha, NE (0.61) |
| South | 41 | 318 | 1.41 | 1.16 | Arlington, VA (3.93) | Garland, TX (0.40) |
| State | Cities | Dog parks | Per 100,000 | Highest city (per 100,000) | Lowest city (per 100,000) |
|---|---|---|---|---|---|
| NV | 3 | 29 | 3.12 | Henderson, NV (5.70) | North Las Vegas, NV (1.37) |
| VA | 5 | 32 | 2.23 | Arlington, VA (3.93) | Virginia Beach, VA (1.09) |
| FL | 6 | 53 | 1.94 | Tampa, FL (3.91) | Jacksonville, FL (0.69) |
| CA | 17 | 204 | 1.72 | San Francisco, CA (5.08) | Santa Ana, CA (0.00) |
| CO | 3 | 28 | 1.67 | Denver, CO (2.23) | Aurora, CO (0.73) |
| NC | 5 | 33 | 1.29 | Raleigh, NC (1.64) | Charlotte, NC (1.16) |
| OH | 3 | 12 | 1.26 | Cincinnati, OH (2.20) | Toledo, OH (0.76) |
| TX | 14 | 118 | 1.18 | Laredo, TX (3.09) | Garland, TX (0.40) |
| AZ | 7 | 42 | 1.10 | Tucson, AZ (2.38) | Mesa, AZ (0.57) |
Dog parks in the biggest US cities
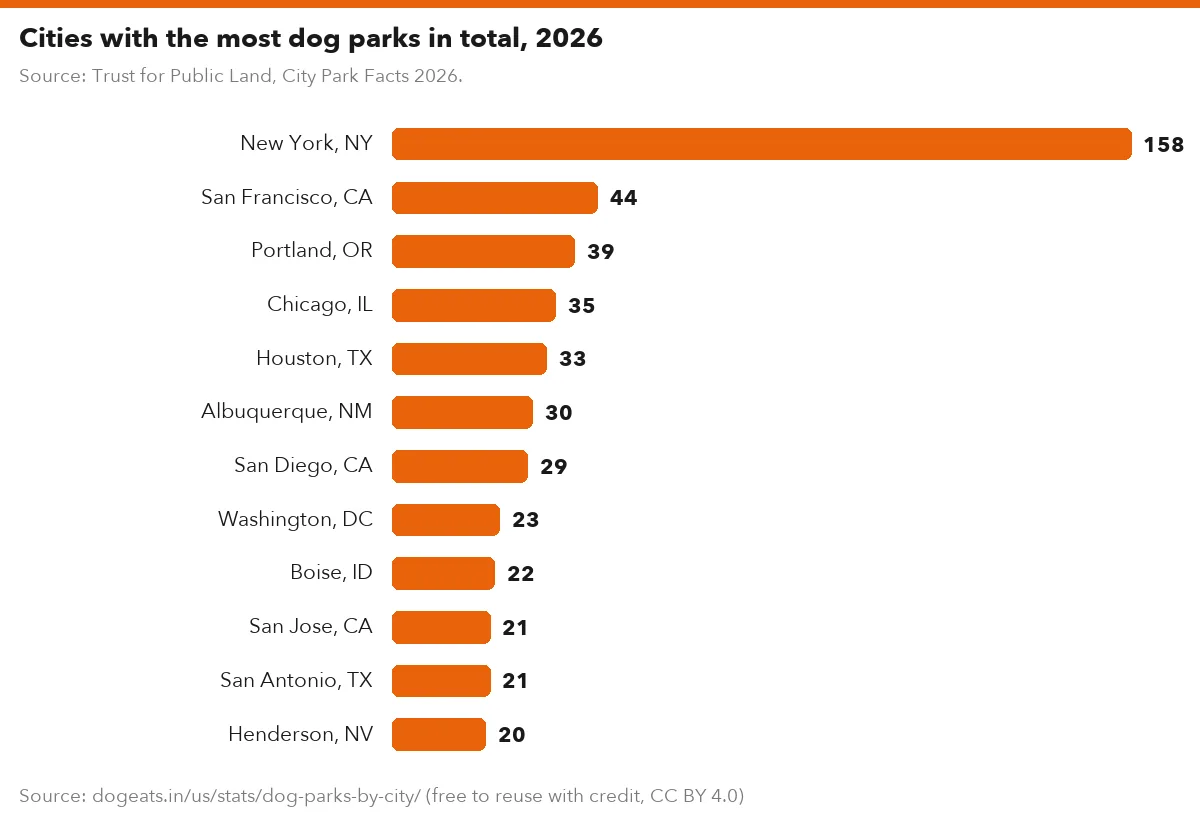
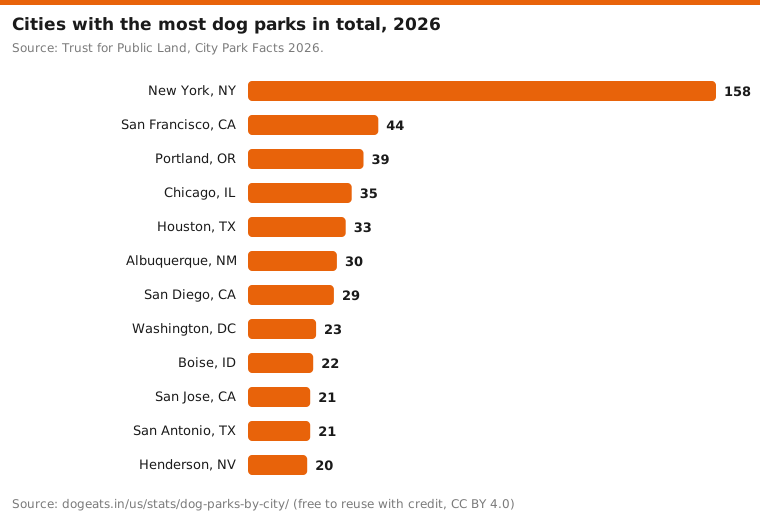
New York City has more dog parks than anywhere else, with 158. San Francisco is second with 44, less than a third as many. Portland, Chicago and Houston follow.
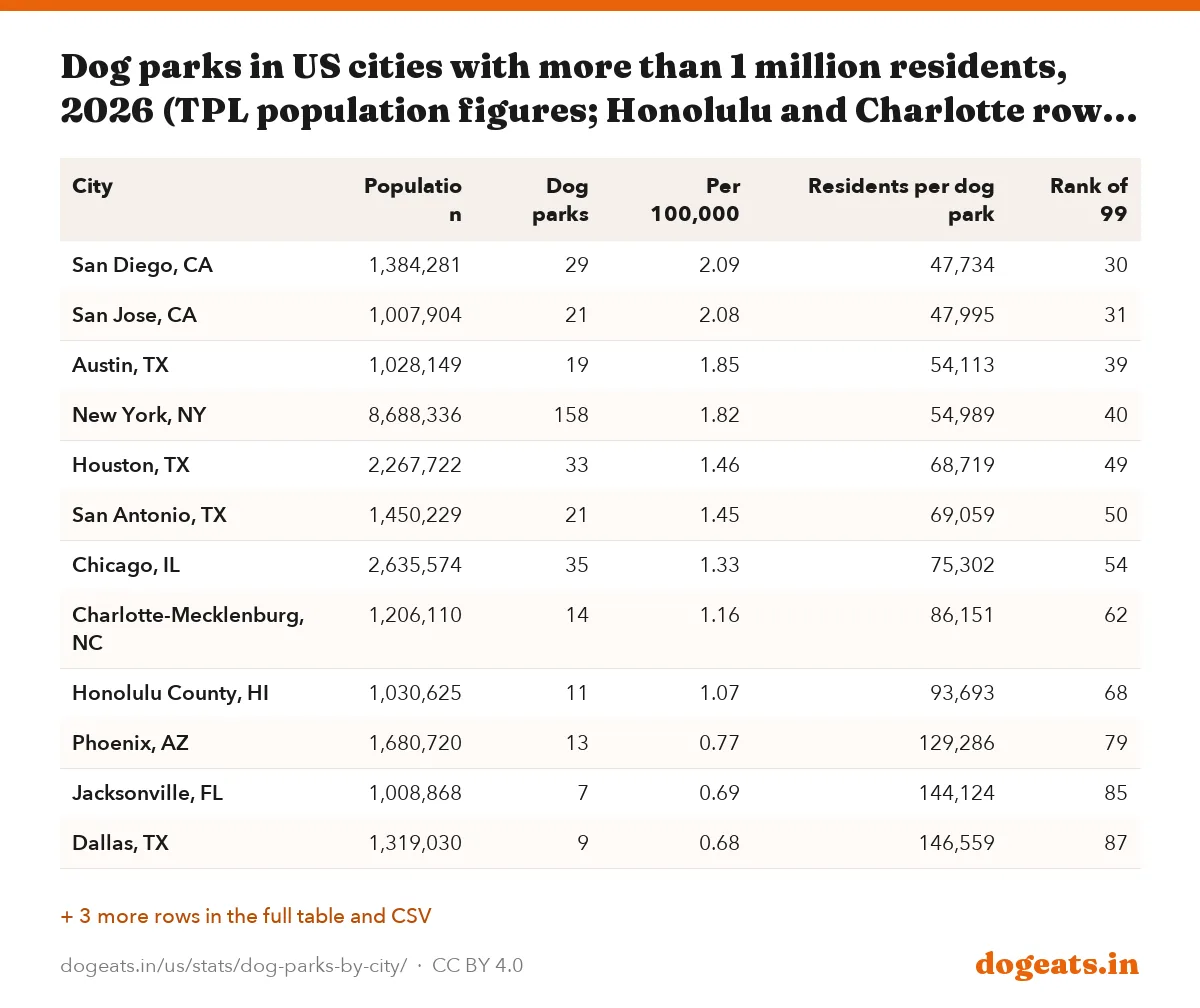
Per resident, New York sits in the middle of the pack at 1.82 per 100,000, ranking 40th. Among the 15 places with more than a million residents in TPL's figures, San Diego and San Jose do best at about 2.1.
Los Angeles, Philadelphia and Fort Worth are the weakest of the million-plus cities. Each has fewer than 0.6 dog parks per 100,000 residents.
Source: Trust for Public Land, City Park Facts 2026.
Show the numbers
| Label | dog parks |
|---|---|
| New York, NY | 158 |
| San Francisco, CA | 44 |
| Portland, OR | 39 |
| Chicago, IL | 35 |
| Houston, TX | 33 |
| Albuquerque, NM | 30 |
| San Diego, CA | 29 |
| Washington, DC | 23 |
| Boise, ID | 22 |
| San Jose, CA | 21 |
| San Antonio, TX | 21 |
| Henderson, NV | 20 |
Embed this chart
| City | Population | Dog parks | Per 100,000 | Residents per dog park | Rank of 99 |
|---|---|---|---|---|---|
| San Diego, CA | 1,384,281 | 29 | 2.09 | 47,734 | 30 |
| San Jose, CA | 1,007,904 | 21 | 2.08 | 47,995 | 31 |
| Austin, TX | 1,028,149 | 19 | 1.85 | 54,113 | 39 |
| New York, NY | 8,688,336 | 158 | 1.82 | 54,989 | 40 |
| Houston, TX | 2,267,722 | 33 | 1.46 | 68,719 | 49 |
| San Antonio, TX | 1,450,229 | 21 | 1.45 | 69,059 | 50 |
| Chicago, IL | 2,635,574 | 35 | 1.33 | 75,302 | 54 |
| Charlotte-Mecklenburg, NC | 1,206,110 | 14 | 1.16 | 86,151 | 62 |
| Honolulu County, HI | 1,030,625 | 11 | 1.07 | 93,693 | 68 |
| Phoenix, AZ | 1,680,720 | 13 | 0.77 | 129,286 | 79 |
| Jacksonville, FL | 1,008,868 | 7 | 0.69 | 144,124 | 85 |
| Dallas, TX | 1,319,030 | 9 | 0.68 | 146,559 | 87 |
| Fort Worth, TX | 1,009,355 | 6 | 0.59 | 168,226 | 91 |
| Philadelphia, PA | 1,590,580 | 8 | 0.50 | 198,822 | 93 |
| Los Angeles, CA | 3,814,386 | 15 | 0.39 | 254,292 | 96 |
How fast are US cities adding dog parks?
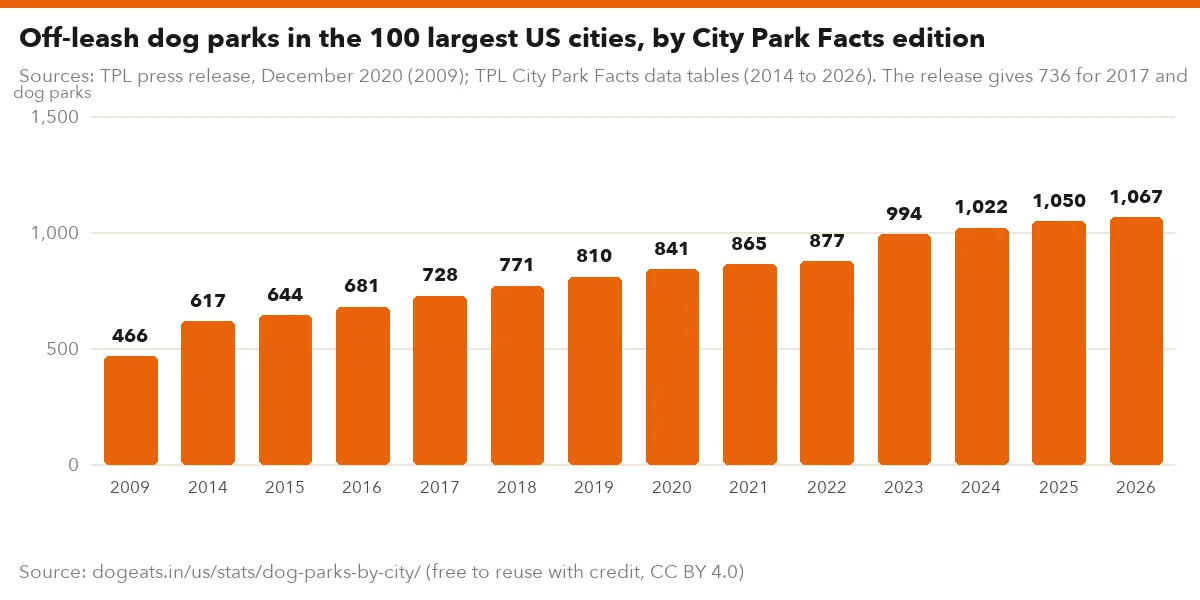
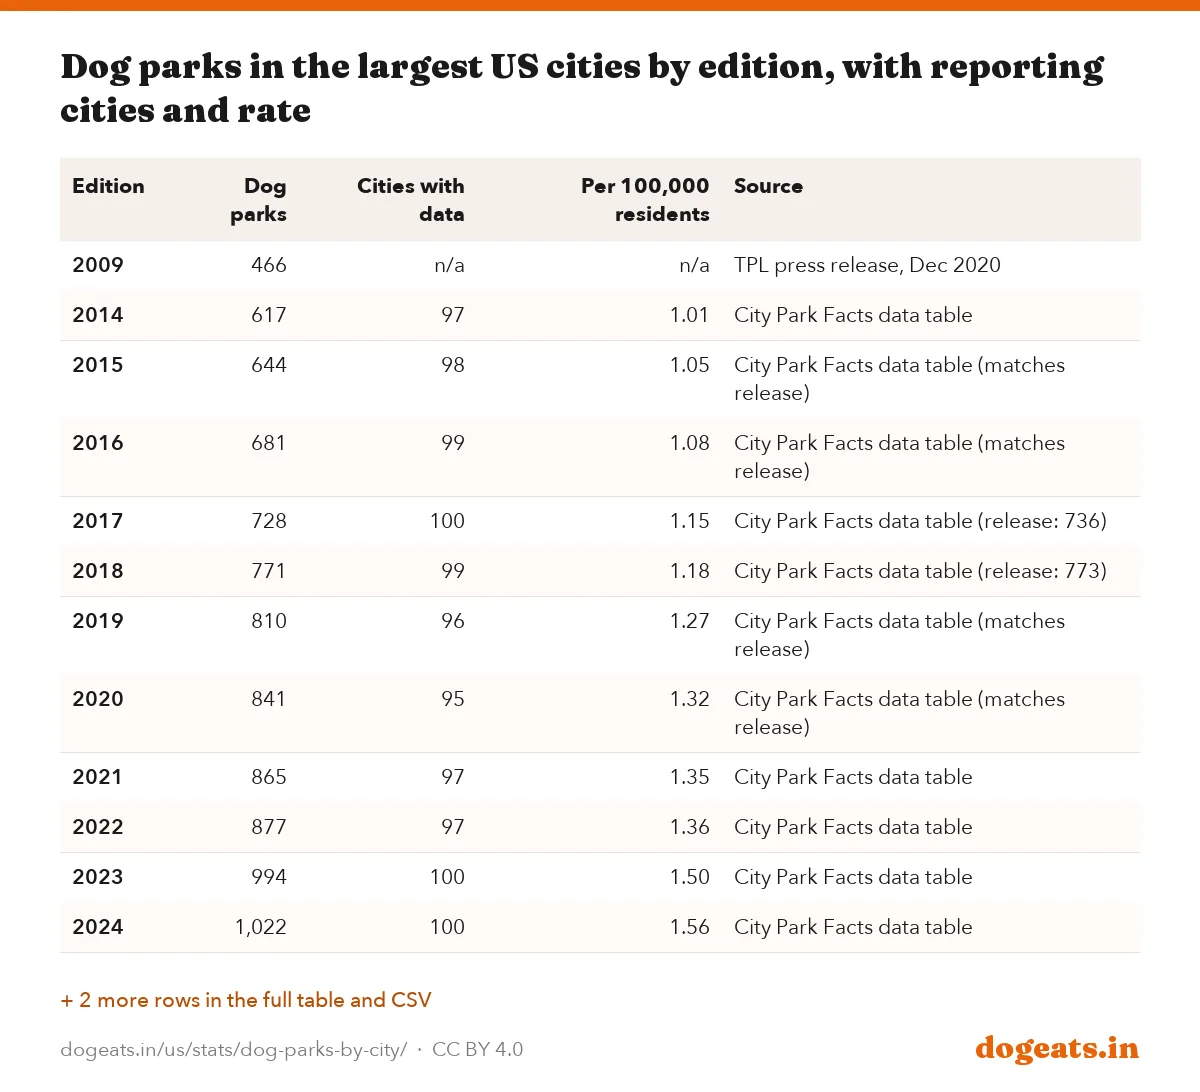
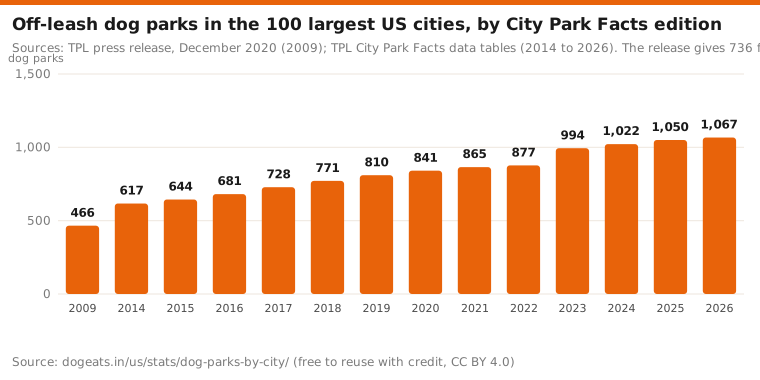
Big US cities have more than doubled their dog parks since 2009. Trust for Public Land counted 466 in the 100 largest cities that year. The 2026 data shows 1,067 across 99 cities, a rise of 129%.
Growth has been steady. TPL called dog parks one of the fastest-growing amenities in big-city park systems in 2020. Per 100,000 residents, the total rate rose from 1.05 in 2015 to 1.65 in 2026.
The list of cities shifts a little each year, so we also compared like with like. Among 92 cities in both the 2015 and 2026 tables, dog parks rose from 610 to 1,035, or 70%.
Sources: TPL press release, December 2020 (2009); TPL City Park Facts data tables (2014 to 2026). The release gives 736 for 2017 and 773 for 2018. Des Moines, listed below the 2023 to 2025 tables, is excluded. The set of reporting cities varies slightly by year.
Show the numbers
| Label | dog parks |
|---|---|
| 2009 | 466 |
| 2014 | 617 |
| 2015 | 644 |
| 2016 | 681 |
| 2017 | 728 |
| 2018 | 771 |
| 2019 | 810 |
| 2020 | 841 |
| 2021 | 865 |
| 2022 | 877 |
| 2023 | 994 |
| 2024 | 1,022 |
| 2025 | 1,050 |
| 2026 | 1,067 |
Embed this chart
| Edition | Dog parks | Cities with data | Per 100,000 residents | Source |
|---|---|---|---|---|
| 2009 | 466 | n/a | n/a | TPL press release, Dec 2020 |
| 2014 | 617 | 97 | 1.01 | City Park Facts data table |
| 2015 | 644 | 98 | 1.05 | City Park Facts data table (matches release) |
| 2016 | 681 | 99 | 1.08 | City Park Facts data table (matches release) |
| 2017 | 728 | 100 | 1.15 | City Park Facts data table (release: 736) |
| 2018 | 771 | 99 | 1.18 | City Park Facts data table (release: 773) |
| 2019 | 810 | 96 | 1.27 | City Park Facts data table (matches release) |
| 2020 | 841 | 95 | 1.32 | City Park Facts data table (matches release) |
| 2021 | 865 | 97 | 1.35 | City Park Facts data table |
| 2022 | 877 | 97 | 1.36 | City Park Facts data table |
| 2023 | 994 | 100 | 1.50 | City Park Facts data table |
| 2024 | 1,022 | 100 | 1.56 | City Park Facts data table |
| 2025 | 1,050 | 99 | 1.62 | City Park Facts data table |
| 2026 | 1,067 | 99 | 1.65 | City Park Facts data table |
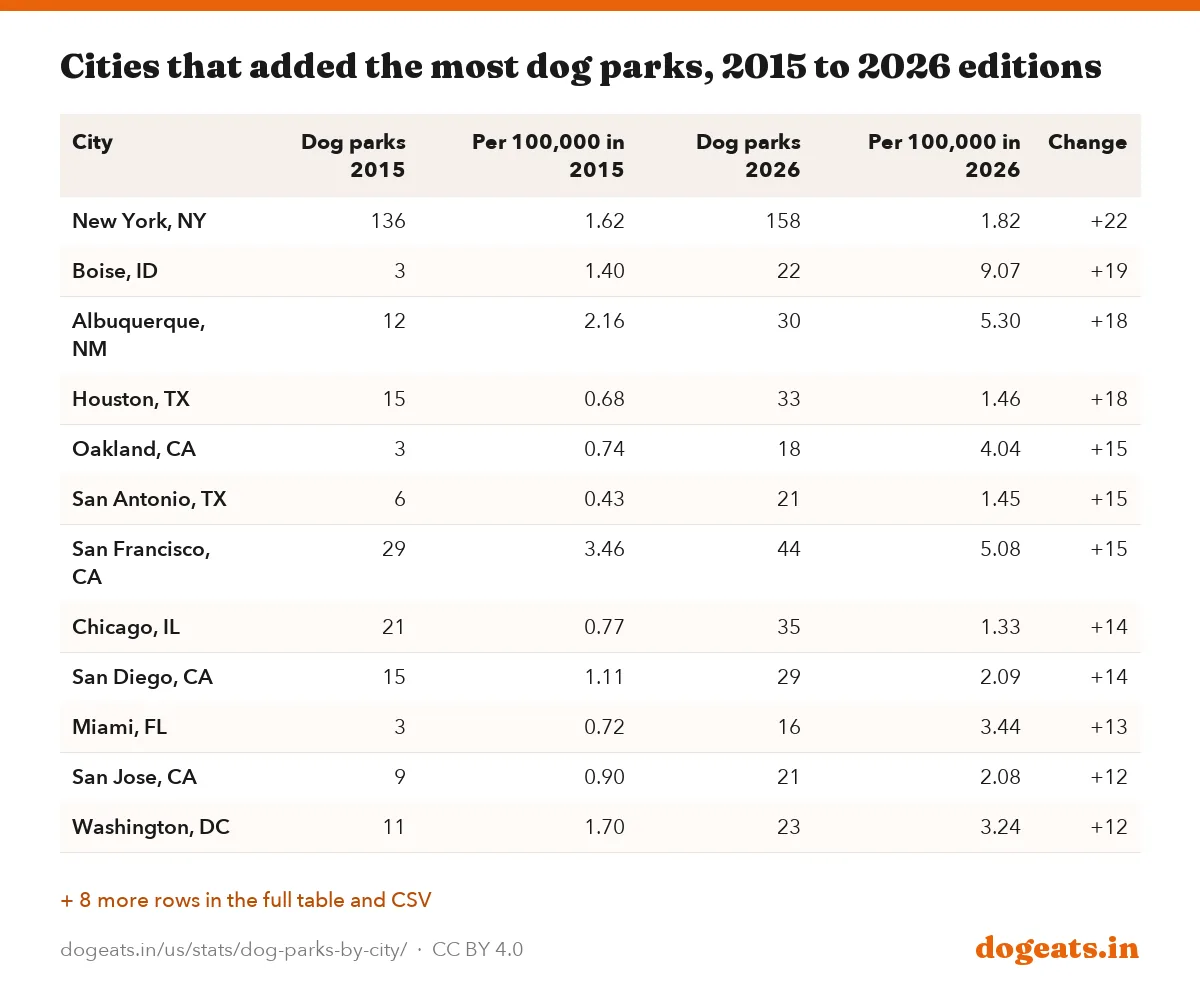
Of those 92 cities, 79 added dog parks, 11 held steady and two reported fewer. Norfolk, Virginia went from 11 to 8, and Riverside, California from 4 to 2.
| City | Dog parks 2015 | Per 100,000 in 2015 | Dog parks 2026 | Per 100,000 in 2026 | Change |
|---|---|---|---|---|---|
| New York, NY | 136 | 1.62 | 158 | 1.82 | +22 |
| Boise, ID | 3 | 1.40 | 22 | 9.07 | +19 |
| Albuquerque, NM | 12 | 2.16 | 30 | 5.30 | +18 |
| Houston, TX | 15 | 0.68 | 33 | 1.46 | +18 |
| Oakland, CA | 3 | 0.74 | 18 | 4.04 | +15 |
| San Antonio, TX | 6 | 0.43 | 21 | 1.45 | +15 |
| San Francisco, CA | 29 | 3.46 | 44 | 5.08 | +15 |
| Chicago, IL | 21 | 0.77 | 35 | 1.33 | +14 |
| San Diego, CA | 15 | 1.11 | 29 | 2.09 | +14 |
| Miami, FL | 3 | 0.72 | 16 | 3.44 | +13 |
| San Jose, CA | 9 | 0.90 | 21 | 2.08 | +12 |
| Washington, DC | 11 | 1.70 | 23 | 3.24 | +12 |
| Detroit, MI | 2 | 0.29 | 12 | 1.92 | +10 |
| Atlanta, GA | 2 | 0.45 | 11 | 2.06 | +9 |
| Henderson, NV | 11 | 4.06 | 20 | 5.70 | +9 |
| Boston, MA | 5 | 0.77 | 13 | 1.96 | +8 |
| Charlotte-Mecklenburg, NC | 6 | 0.76 | 14 | 1.16 | +8 |
| Fresno, CA | 5 | 0.98 | 13 | 2.35 | +8 |
| Laredo, TX | 0 | 0.00 | 8 | 3.09 | +8 |
| Tucson, AZ | 5 | 0.95 | 13 | 2.38 | +8 |
Boise went from 3 dog parks to 22
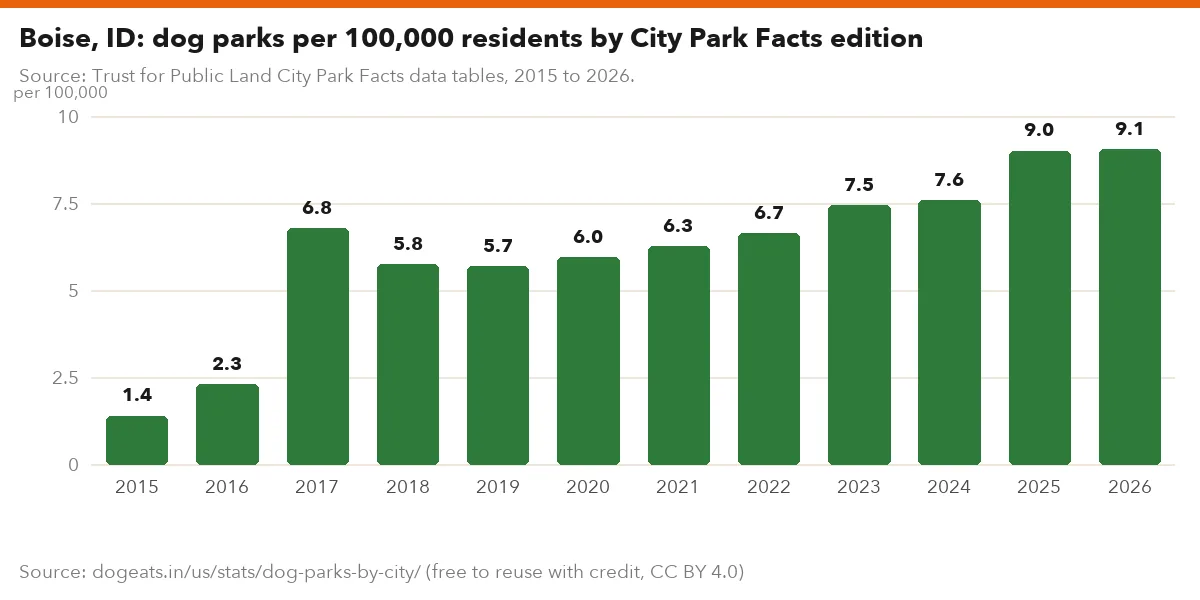
Boise is the clearest growth story. It reported 3 dog parks in the 2015 data. By the 2017 edition it had 15 and the highest rate of any city. It reported 22 in both 2025 and 2026.
Its rate has climbed from 1.4 per 100,000 residents to 9.1 over that time. Portland, the leader in 2015, has added six parks since then and now ranks second.
Albuquerque and Houston moved fastest recently. Albuquerque went from 14 dog parks in 2023 to 30 in 2026. Houston more than doubled from 15 in 2015 to 33.
Source: Trust for Public Land City Park Facts data tables, 2015 to 2026.
Show the numbers
| Label | per 100,000 |
|---|---|
| 2015 | 1.4 |
| 2016 | 2.3 |
| 2017 | 6.8 |
| 2018 | 5.8 |
| 2019 | 5.7 |
| 2020 | 6.0 |
| 2021 | 6.3 |
| 2022 | 6.7 |
| 2023 | 7.5 |
| 2024 | 7.6 |
| 2025 | 9.0 |
| 2026 | 9.1 |
Embed this chart
| City | 2015 | 2019 | 2022 | 2025 | 2026 |
|---|---|---|---|---|---|
| Boise, ID | 3 | 13 | 16 | 22 | 22 |
| Portland, OR | 33 | 35 | 38 | 38 | 39 |
| New York, NY | 136 | 145 | 151 | 171 | 158 |
| Albuquerque, NM | 12 | 14 | 14 | 27 | 30 |
| Houston, TX | 15 | 16 | 28 | 27 | 33 |
| Los Angeles, CA | 11 | 13 | 14 | 15 | 15 |
Counts can swing because of how agencies report, not only because parks open or close. New York City reported 171 dog parks in 2025 and 158 in 2026. Chicago's 2022 entry of 3 sits between 29 and 30 in the years around it.
TPL's December 2020 release called 2020 Boise's second year in a row at the top. Its own 2017 and 2018 data tables also list Boise first, at 6.8 and 5.8 per 100,000.
What a dog park count does and does not measure
A dog park count measures access, not quality. TPL counts off-leash parks and fenced dog areas, and a park with separate small-dog and large-dog sections counts once. It does not measure size, surface, shade or water.
The rate also ignores how many dogs live in each city. A city with many dog owners may need more parks than its population suggests. Our dog ownership statistics cover how many US households keep dogs.
TPL's population figures are its own, not Census Bureau estimates. We compared them with Census Vintage 2025 estimates for 98 of the 99 places. They differ by under 3% for 81, and by 9.2% at most, in Port St. Lucie. Using Census figures instead leaves the top five unchanged, with Boise at 9.2 per 100,000.
On a hot day, bring fresh water from home rather than sports drinks. Gatorade is made for human sweat loss, not for dogs. Popular park names are in our dog names report.
- Source: Trust for Public Land City Park Facts 2026, built from an annual survey of 582 park agencies and organizations.
- Survey window: October 2025 to January 30, 2026, so the 2026 edition mostly reflects 2025 conditions.
- Definition: off-leash dog parks or dog areas reported by the public and private park agencies in each city. Separate small-dog and large-dog areas count as one.
- Coverage: 99 cities have dog park figures in the 2026 table; Las Vegas, Columbus and a few others are absent.
Frequently asked questions
Which US city has the most dog parks per person?
Boise, Idaho has the most dog parks per person among large US cities. Trust for Public Land's 2026 data shows 22 off-leash dog parks for 242,489 residents, or 9.1 per 100,000. Portland, Oregon is second at 5.9.
Which US city has the most dog parks in total?
New York City has the most dog parks of any US city, with 158 in the 2026 Trust for Public Land data. San Francisco is second with 44 and Portland third with 39. Per resident, New York ranks 40th of 99.
Which big cities have the fewest dog parks?
Santa Ana, California reported none, and Irvine and Newark reported one each. Los Angeles has 15 for 3.8 million residents, or 0.39 per 100,000. Garland, Oklahoma City and Philadelphia are also near the bottom.
How many dog parks are there in the US?
There is no official national count. Trust for Public Land tracks the 100 largest cities, which had 1,067 off-leash dog parks in its 2026 data. The 100 largest cities had 466 in 2009, by TPL's count.
Are cities building more dog parks?
Yes. Among 92 cities in both the 2015 and 2026 Trust for Public Land tables, dog parks rose 70%, from 610 to 1,035. Seventy-nine of those cities added parks and two reported fewer.
How many dog parks does Los Angeles have?
Los Angeles reported 15 off-leash dog parks in the 2026 City Park Facts data. With 3.8 million residents, that is one dog park for every 254,292 people. It ranks 96th of 99 cities per resident.
Which region has the most dog parks?
Western cities have the most dog parks per resident, with 1.95 per 100,000 across 37 large cities. The Northeast follows at 1.63, the Midwest at 1.54 and the South at 1.41.
What counts as a dog park in these rankings?
Trust for Public Land counts off-leash dog parks and dog areas open to the public. A park with separate small-dog and large-dog areas counts as one. Size and facilities are not measured.
Methodology and limitations
We downloaded the Off-leash Dog Parks by City tables from Trust for Public Land's City Park Facts for each edition from 2014 to 2026. These are published as Excel files on TPL's ParkServe data downloads page, including a single archive of all editions.
For 2026 we used TPL's own counts and city populations. We recomputed dog parks per 100,000 residents and residents per dog park from those two columns. Rates match TPL's published figures.
Regions follow the four US Census Bureau regions, with Washington, DC in the South. Regional and state rates divide total dog parks by total population of the listed cities. Medians are of city rates.
For 2009 we used the total in TPL's December 2020 press release. For 2014 to 2026 we summed the city counts in each data table. The release gives 736 for 2017 and 773 for 2018, while the tables sum to 728 and 771. Des Moines, listed below the 2023 to 2025 tables as a former top 100 city, is left out.
For change over time, we matched cities by name across editions, using the state to separate Arlington, Texas from Arlington, Virginia. Only cities present in both the 2015 and 2026 tables count in the like-for-like comparison.
Charlotte and Honolulu rows use county populations in recent editions, so their rates are not directly comparable with older city-only figures. We checked populations against the Census Bureau Vintage 2025 city estimates.
Sources
- Trust for Public Land, City Park Facts 2026: Amenities and Facilities data tables, 2026 dog park counts, city populations and per-100,000 rates for 99 cities
- Trust for Public Land, Boise Tops National Rankings for Dog Parks (December 2020), National dog park totals for 2009 and 2015 to 2020, and the 2020 ranking
- Trust for Public Land, City Park Facts data tables 2010 to 2026 (zipped archive), Historic dog park tables for the 2014 to 2025 editions
- Also consulted: Trust for Public Land, City Park Facts methodology notes, May 2026, US Census Bureau, Vintage 2025 city and town population estimates, Trust for Public Land, City Park Facts, Trust for Public Land, ParkServe data downloads.
Cite, embed and download
This report, its data and its images are free to reuse under a Creative Commons Attribution 4.0 licence. Credit dogeats.in with a link to this page. Every chart has its own embed code, every table has a CSV and an image download, and the images below are ready for social posts, slides and articles.
Cite this report
Link to this report
Every chart and table as an image