Data report · Updated October 2026
Air Pollution and Dogs in India: How Many Poor AQI Days Each City Had in 2025 and 2026, and What the Science Says
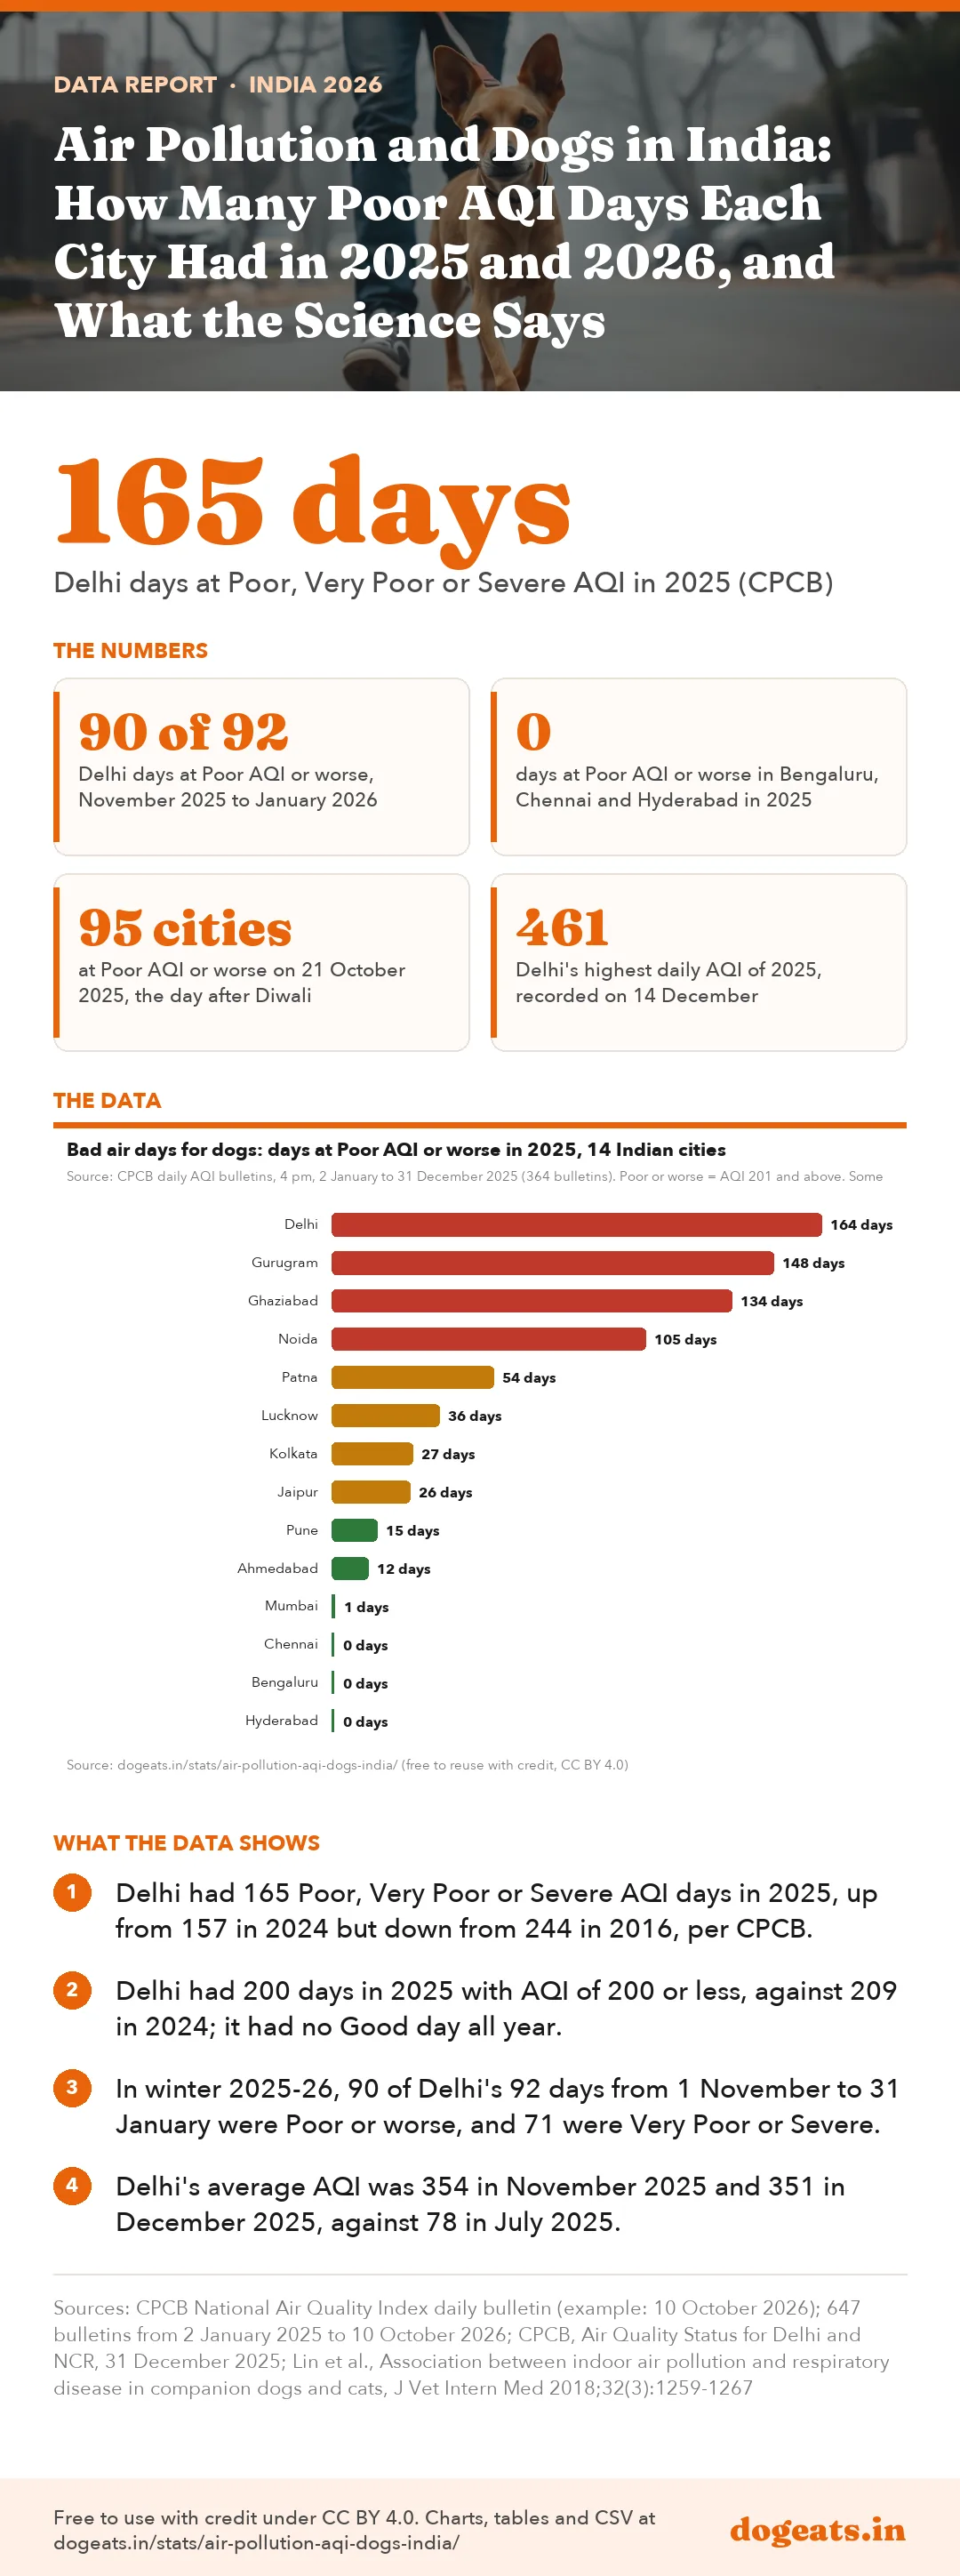
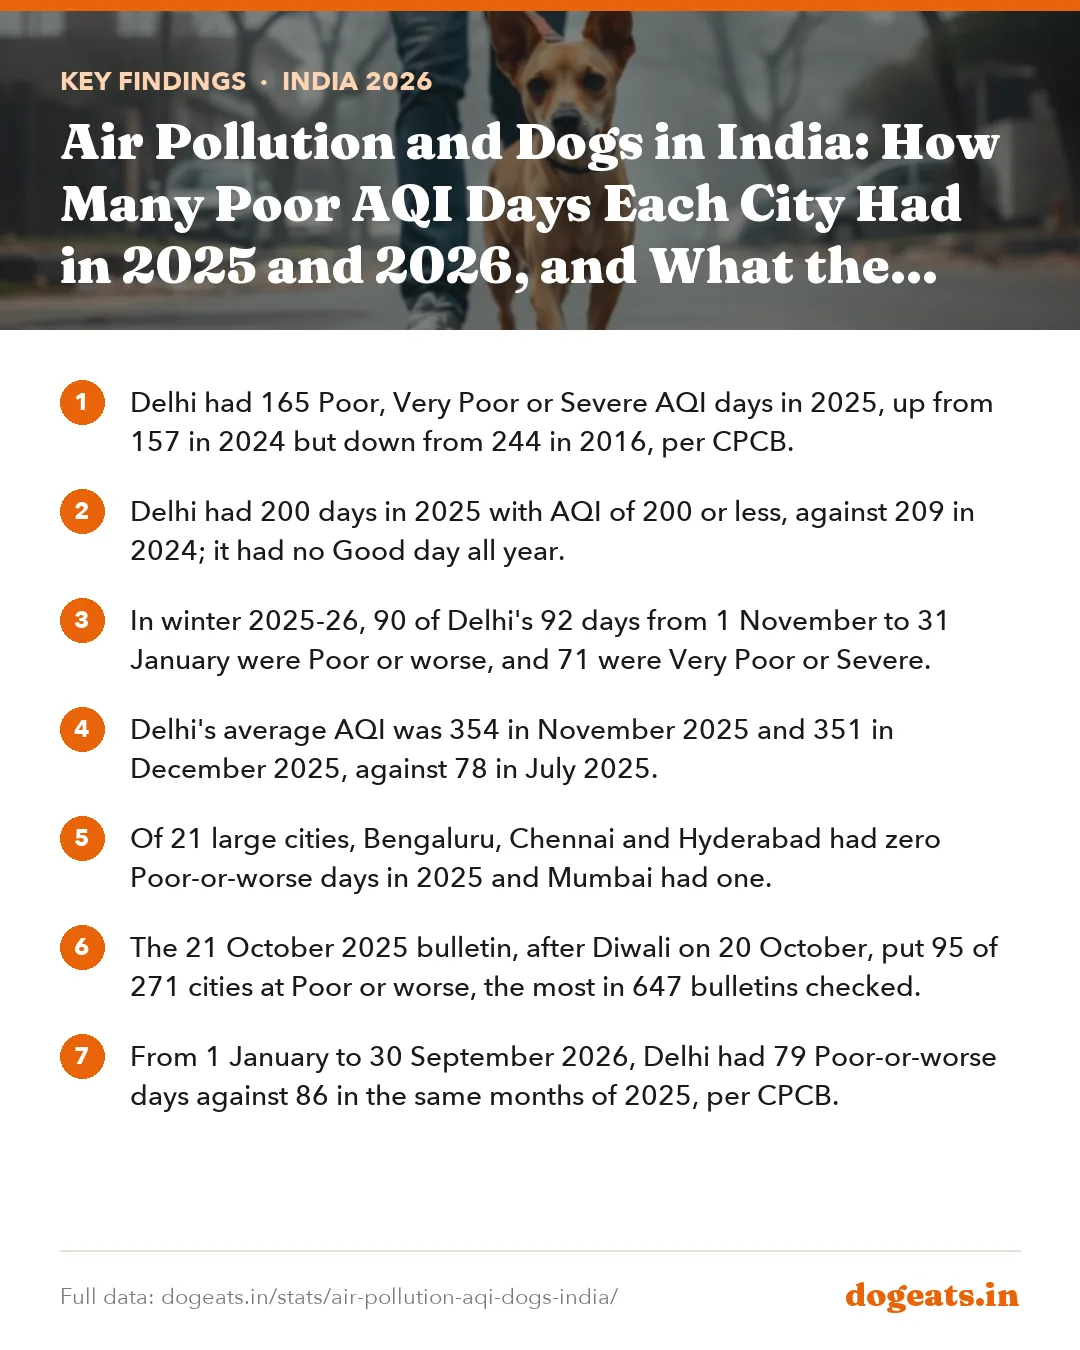
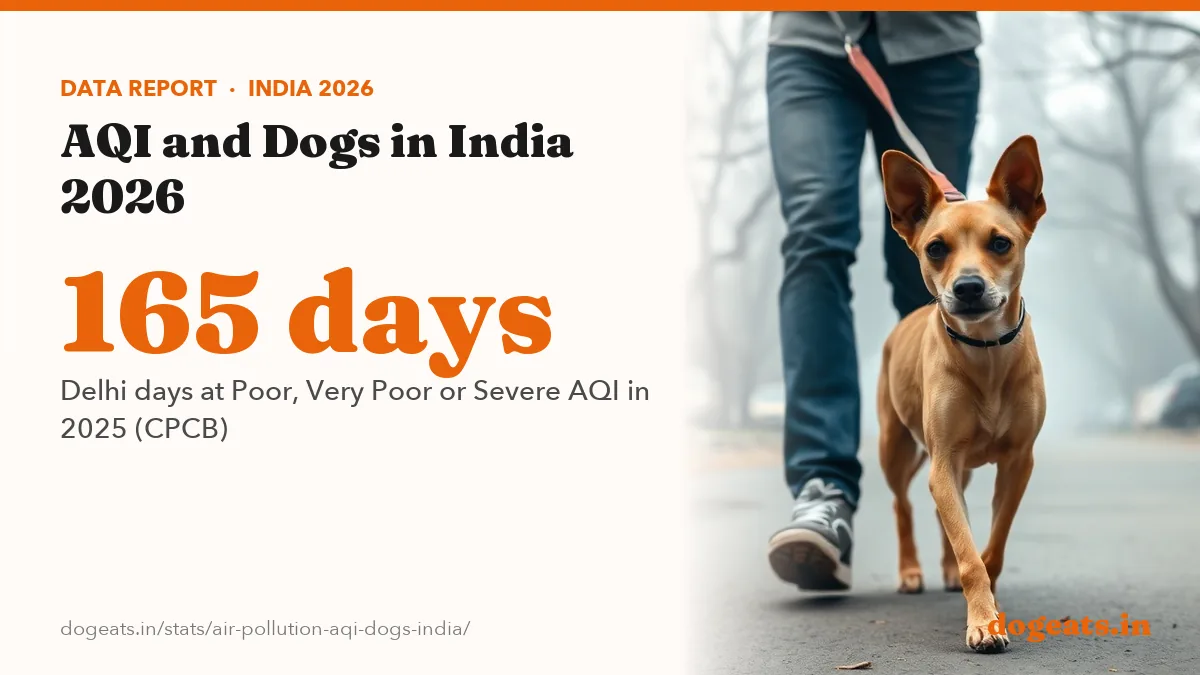
India has no official AQI threshold for dogs; CPCB health advice is written for people. In 2025 Delhi had 165 days at Poor, Very Poor or Severe AQI, while Bengaluru, Chennai and Hyderabad had none. Delhi's worst stretch is November to January: 90 of 92 days in the 2025-26 winter were Poor or worse. Studies abroad link polluted air to airway and eye irritation in dogs, so short walks and a vet check for flat-faced, old or coughing dogs are sensible on bad days.
Key findings
- Delhi had 165 Poor, Very Poor or Severe AQI days in 2025, up from 157 in 2024 but down from 244 in 2016, per CPCB.
- Delhi had 200 days in 2025 with AQI of 200 or less, against 209 in 2024; it had no Good day all year.
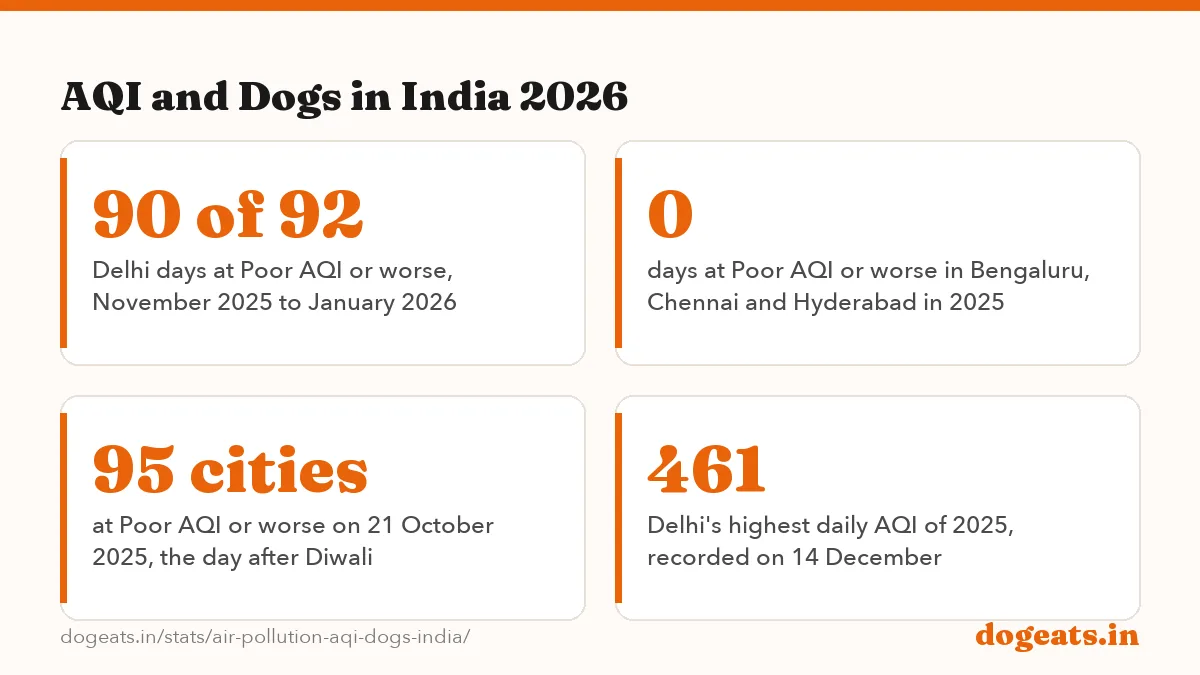
- In winter 2025-26, 90 of Delhi's 92 days from 1 November to 31 January were Poor or worse, and 71 were Very Poor or Severe.
- Delhi's average AQI was 354 in November 2025 and 351 in December 2025, against 78 in July 2025.
- Of 21 large cities, Bengaluru, Chennai and Hyderabad had zero Poor-or-worse days in 2025 and Mumbai had one.
- The 21 October 2025 bulletin, after Diwali on 20 October, put 95 of 271 cities at Poor or worse, the most in 647 bulletins checked.
- From 1 January to 30 September 2026, Delhi had 79 Poor-or-worse days against 86 in the same months of 2025, per CPCB.
- A Taiwan study of 121 dogs found household PM2.5 did not differ between dogs with and without respiratory disease.
- A Colorado study of 15 dogs linked wildfire smoke days to more conjunctivitis, and a Mexico City study of 40 dogs found brain inflammation in city dogs.
- We found no peer-reviewed study measuring how outdoor air pollution affects pet dogs in India.
What AQI is safe for dogs in India?
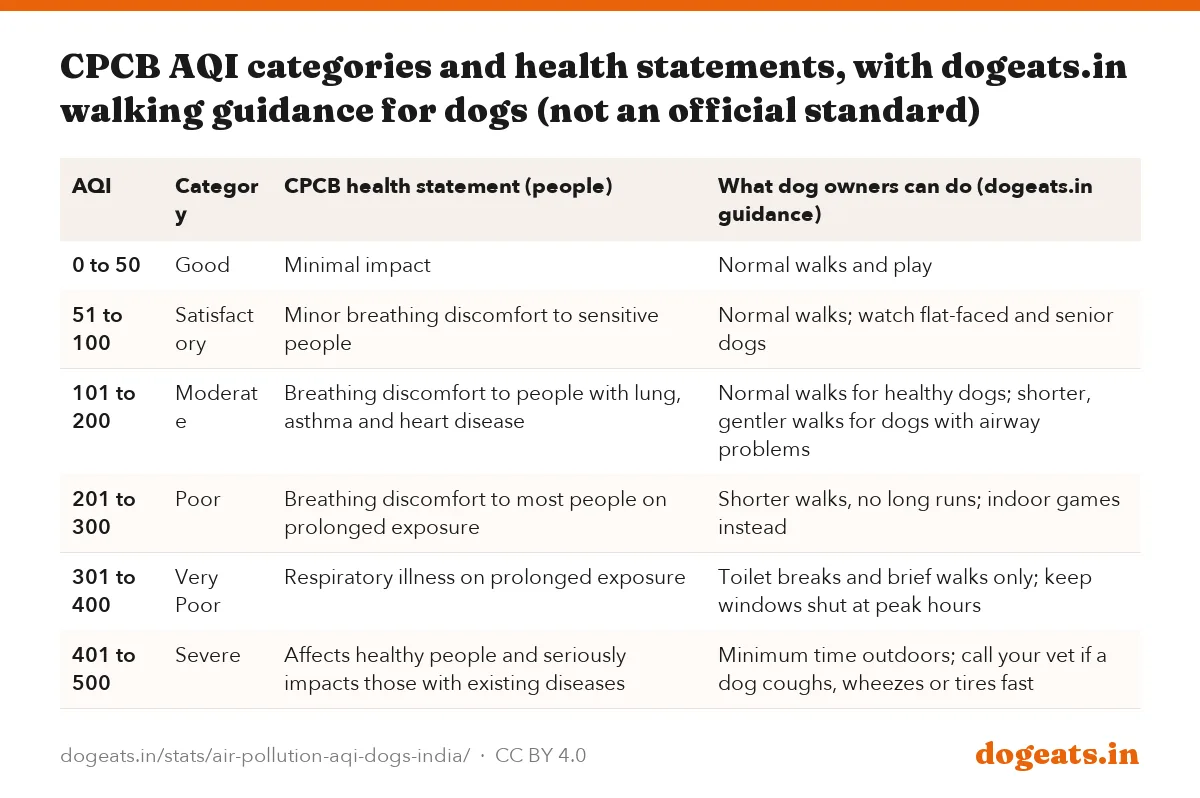
No Indian authority publishes an AQI limit for dogs. The Central Pollution Control Board (CPCB) scale runs from 0 to 500 in six bands. Its health statements describe effects on people, not pets.
At 0 to 50 (Good) CPCB expects minimal impact. At 201 to 300 (Poor) it warns of breathing discomfort to most people on prolonged exposure. At 401 to 500 (Severe) it says the air affects healthy people too.
Dogs breathe the same air at nose height, often while running. So the CPCB bands are the best Indian guide we have. Treat Poor and worse as days to cut walks short, and ask your vet about any dog that coughs or wheezes.
| AQI | Category | CPCB health statement (people) | What dog owners can do (dogeats.in guidance) |
|---|---|---|---|
| 0 to 50 | Good | Minimal impact | Normal walks and play |
| 51 to 100 | Satisfactory | Minor breathing discomfort to sensitive people | Normal walks; watch flat-faced and senior dogs |
| 101 to 200 | Moderate | Breathing discomfort to people with lung, asthma and heart disease | Normal walks for healthy dogs; shorter, gentler walks for dogs with airway problems |
| 201 to 300 | Poor | Breathing discomfort to most people on prolonged exposure | Shorter walks, no long runs; indoor games instead |
| 301 to 400 | Very Poor | Respiratory illness on prolonged exposure | Toilet breaks and brief walks only; keep windows shut at peak hours |
| 401 to 500 | Severe | Affects healthy people and seriously impacts those with existing diseases | Minimum time outdoors; call your vet if a dog coughs, wheezes or tires fast |
CPCB issues a national AQI bulletin every day at 4 pm. Each value is the average of the past 24 hours across a city's monitoring stations. The 10 October 2026 bulletin covered 257 cities.
On that day Delhi read 122 (Moderate) from 46 of its 50 stations. Kolkata read 106 and Mumbai 101, both Moderate. Bengaluru and Hyderabad read 81 and Chennai 70, all Satisfactory.
Which Indian cities have the most poor AQI days for dogs?
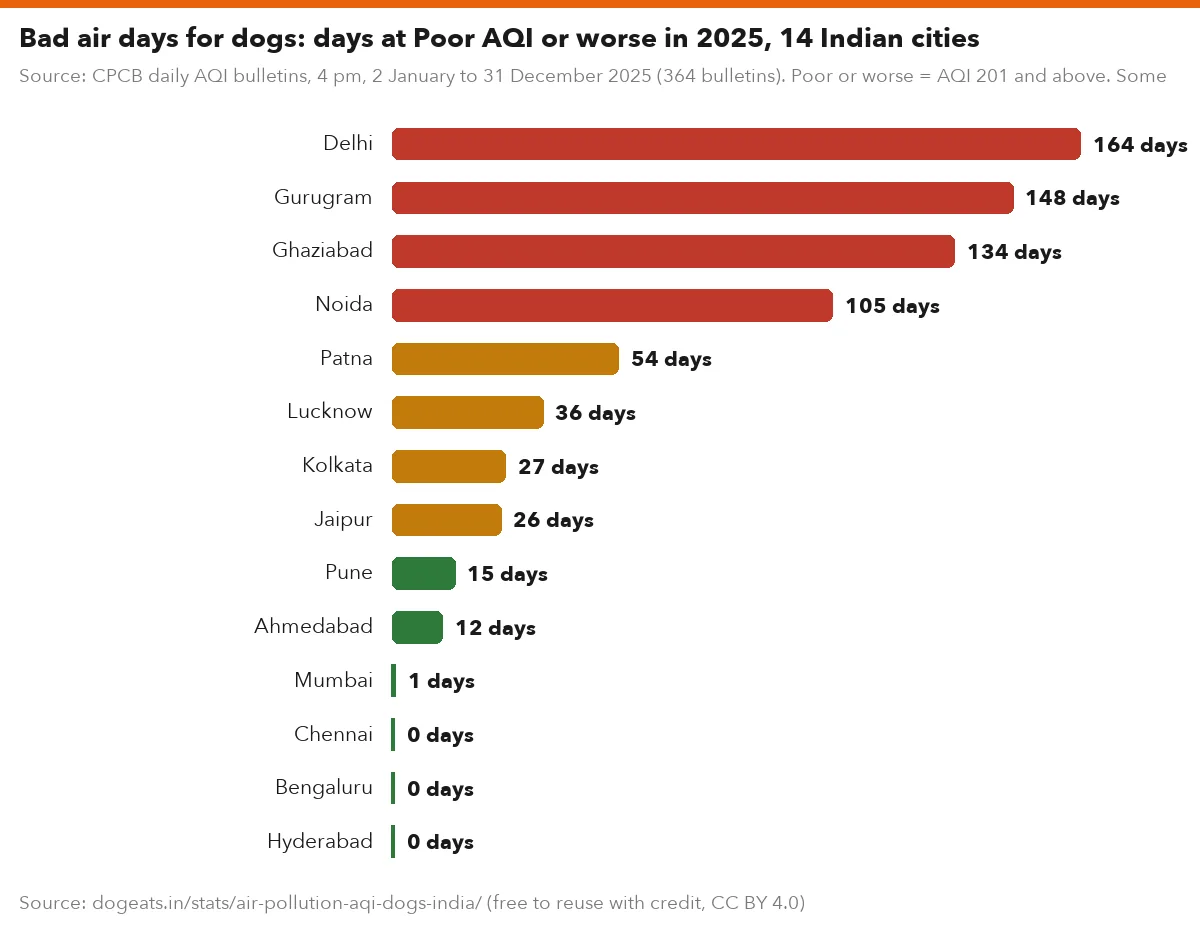
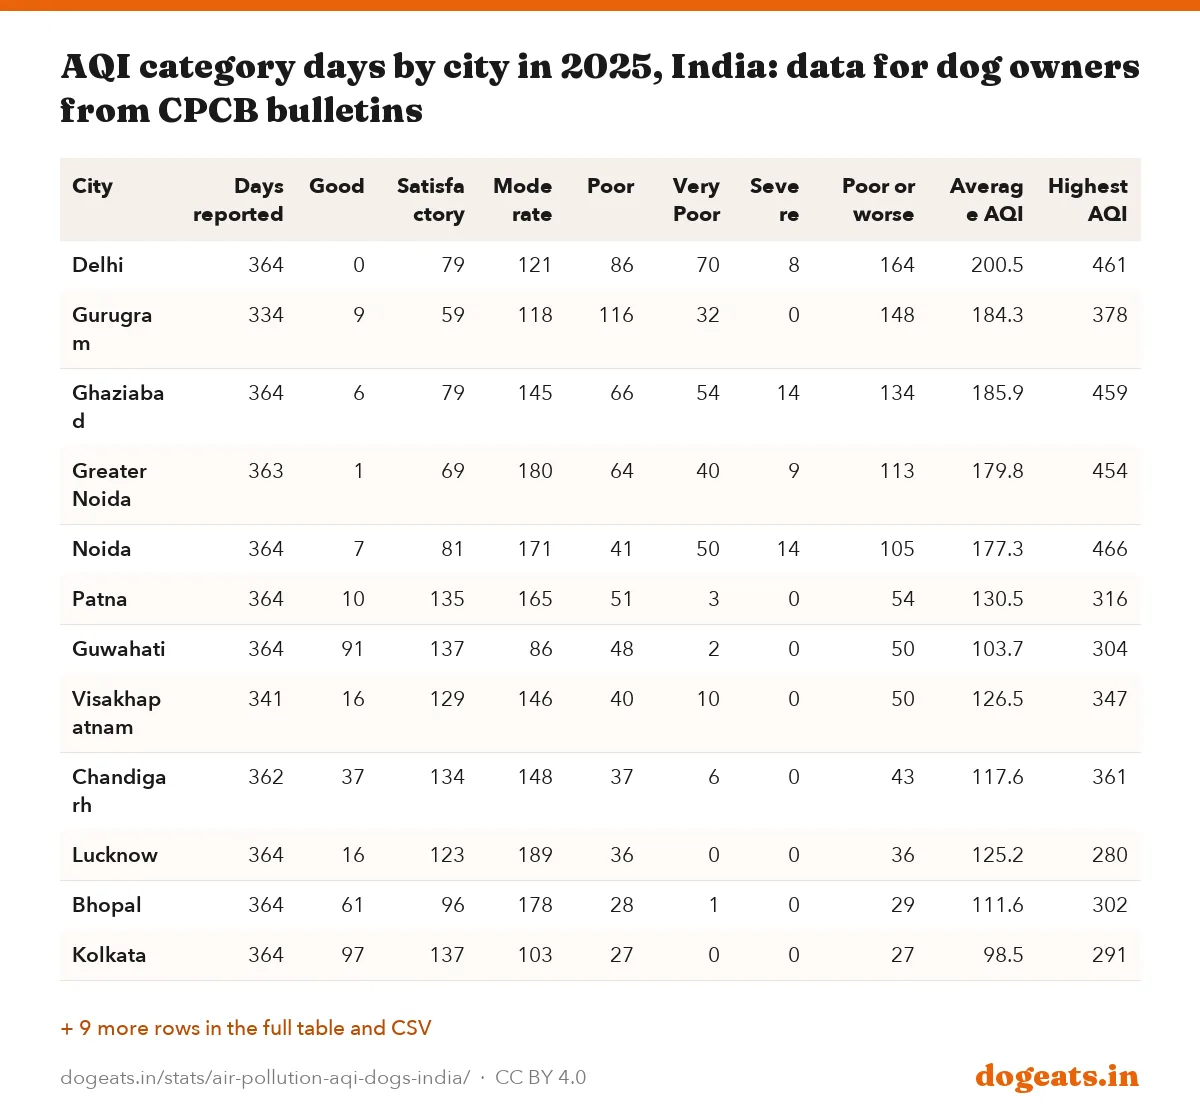
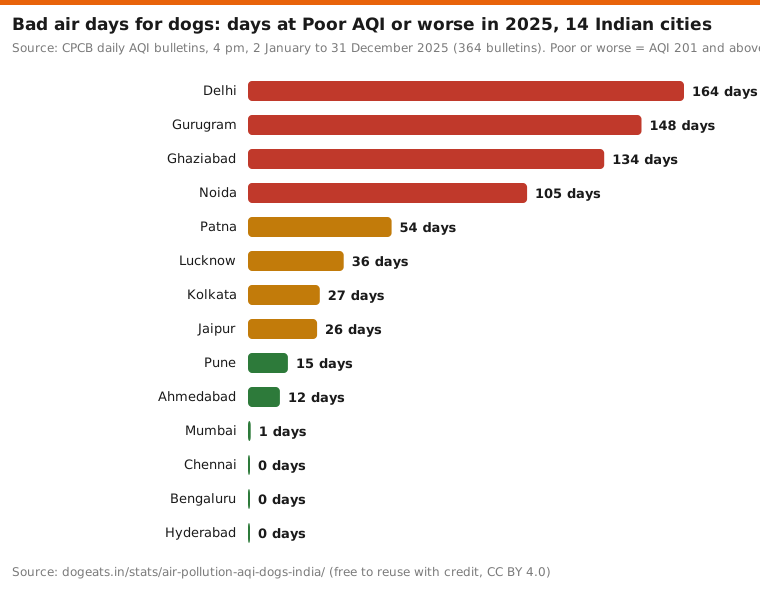
Delhi and its satellite cities top the count by a wide margin. We read 364 CPCB bulletins for 2025, from 2 January to 31 December. Delhi was Poor or worse on 164 of them; CPCB's own full-year count, including 1 January, is 165.
Gurugram had 148 Poor-or-worse days in 334 bulletins, Ghaziabad 134 and Greater Noida 113. Noida had 105. Patna, at 54, and Guwahati and Visakhapatnam, at 50 each, were the worst big cities outside the National Capital Region.
The south and west fare far better. Bengaluru, Chennai and Hyderabad had zero Poor days in 2025. Mumbai had one, on 21 October, the day after Diwali, when it read 211.
Source: CPCB daily AQI bulletins, 4 pm, 2 January to 31 December 2025 (364 bulletins). Poor or worse = AQI 201 and above. Some cities missed days for lack of data.
Show the numbers
| Label | days |
|---|---|
| Delhi | 164 days |
| Gurugram | 148 days |
| Ghaziabad | 134 days |
| Noida | 105 days |
| Patna | 54 days |
| Lucknow | 36 days |
| Kolkata | 27 days |
| Jaipur | 26 days |
| Pune | 15 days |
| Ahmedabad | 12 days |
| Mumbai | 1 days |
| Chennai | 0 days |
| Bengaluru | 0 days |
| Hyderabad | 0 days |
Embed this chart
| City | Days reported | Good | Satisfactory | Moderate | Poor | Very Poor | Severe | Poor or worse | Average AQI | Highest AQI |
|---|---|---|---|---|---|---|---|---|---|---|
| Delhi | 364 | 0 | 79 | 121 | 86 | 70 | 8 | 164 | 200.5 | 461 |
| Gurugram | 334 | 9 | 59 | 118 | 116 | 32 | 0 | 148 | 184.3 | 378 |
| Ghaziabad | 364 | 6 | 79 | 145 | 66 | 54 | 14 | 134 | 185.9 | 459 |
| Greater Noida | 363 | 1 | 69 | 180 | 64 | 40 | 9 | 113 | 179.8 | 454 |
| Noida | 364 | 7 | 81 | 171 | 41 | 50 | 14 | 105 | 177.3 | 466 |
| Patna | 364 | 10 | 135 | 165 | 51 | 3 | 0 | 54 | 130.5 | 316 |
| Guwahati | 364 | 91 | 137 | 86 | 48 | 2 | 0 | 50 | 103.7 | 304 |
| Visakhapatnam | 341 | 16 | 129 | 146 | 40 | 10 | 0 | 50 | 126.5 | 347 |
| Chandigarh | 362 | 37 | 134 | 148 | 37 | 6 | 0 | 43 | 117.6 | 361 |
| Lucknow | 364 | 16 | 123 | 189 | 36 | 0 | 0 | 36 | 125.2 | 280 |
| Bhopal | 364 | 61 | 96 | 178 | 28 | 1 | 0 | 29 | 111.6 | 302 |
| Kolkata | 364 | 97 | 137 | 103 | 27 | 0 | 0 | 27 | 98.5 | 291 |
| Jaipur | 364 | 5 | 118 | 215 | 26 | 0 | 0 | 26 | 126.6 | 290 |
| Pune | 364 | 38 | 144 | 167 | 15 | 0 | 0 | 15 | 104.9 | 247 |
| Ahmedabad | 364 | 33 | 134 | 185 | 12 | 0 | 0 | 12 | 106.2 | 215 |
| Nagpur | 364 | 90 | 117 | 145 | 12 | 0 | 0 | 12 | 95.8 | 243 |
| Kanpur | 363 | 40 | 186 | 126 | 11 | 0 | 0 | 11 | 96.8 | 256 |
| Mumbai | 364 | 55 | 167 | 141 | 1 | 0 | 0 | 1 | 88.4 | 211 |
| Chennai | 364 | 36 | 257 | 71 | 0 | 0 | 0 | 0 | 79.5 | 196 |
| Bengaluru | 364 | 41 | 267 | 56 | 0 | 0 | 0 | 0 | 74.9 | 137 |
| Hyderabad | 364 | 0 | 310 | 54 | 0 | 0 | 0 | 0 | 81.9 | 132 |
Faridabad appears in only 186 of the 2025 bulletins, so its total of 66 Poor days undercounts the year. Gurugram reported on 334 days and Visakhapatnam on 341.
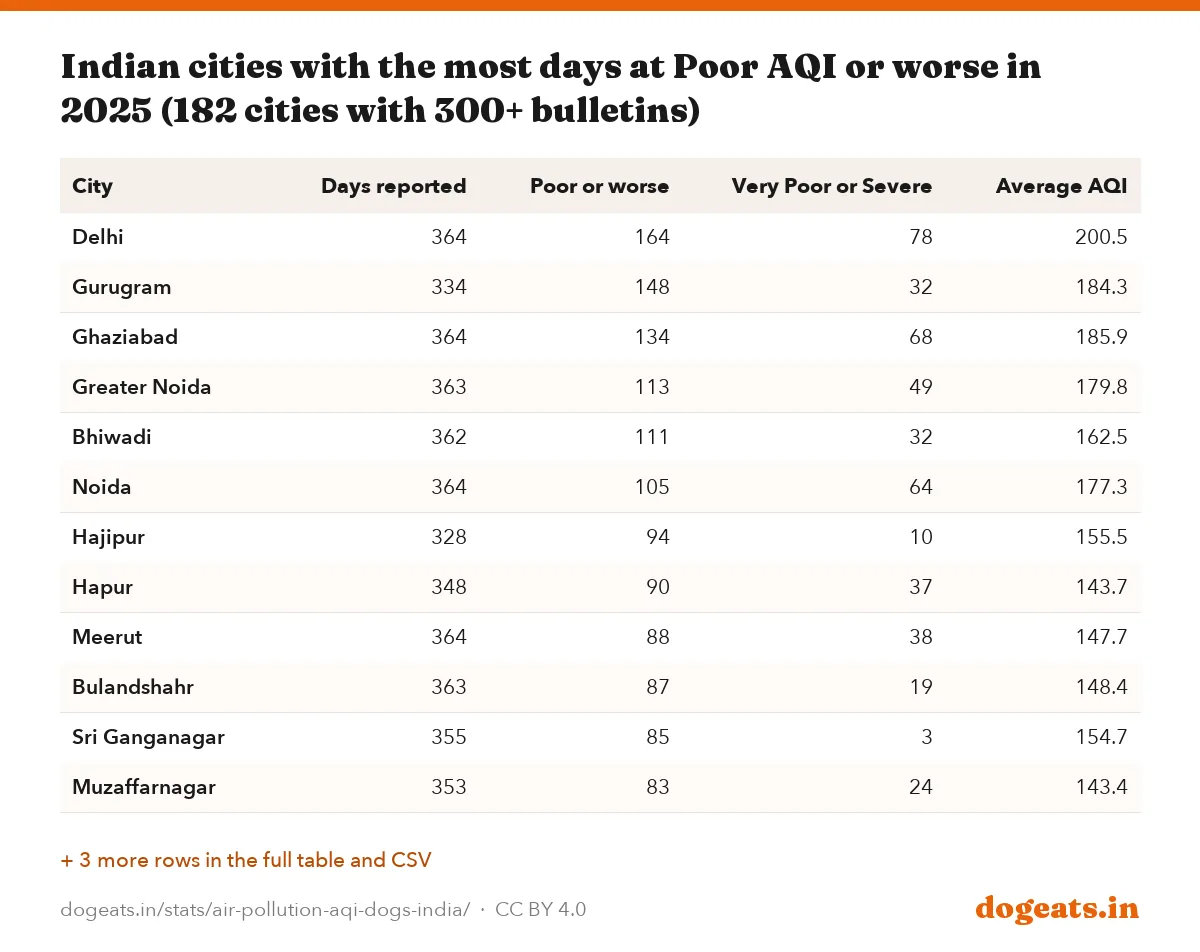
Smaller industrial towns also rank high. Among 182 cities with at least 300 bulletins in 2025, Bhiwadi had 111 Poor-or-worse days, Hajipur 94 and Hapur 90. Thirty of those 182 cities had none.
How bad is Delhi's air for dogs in winter?
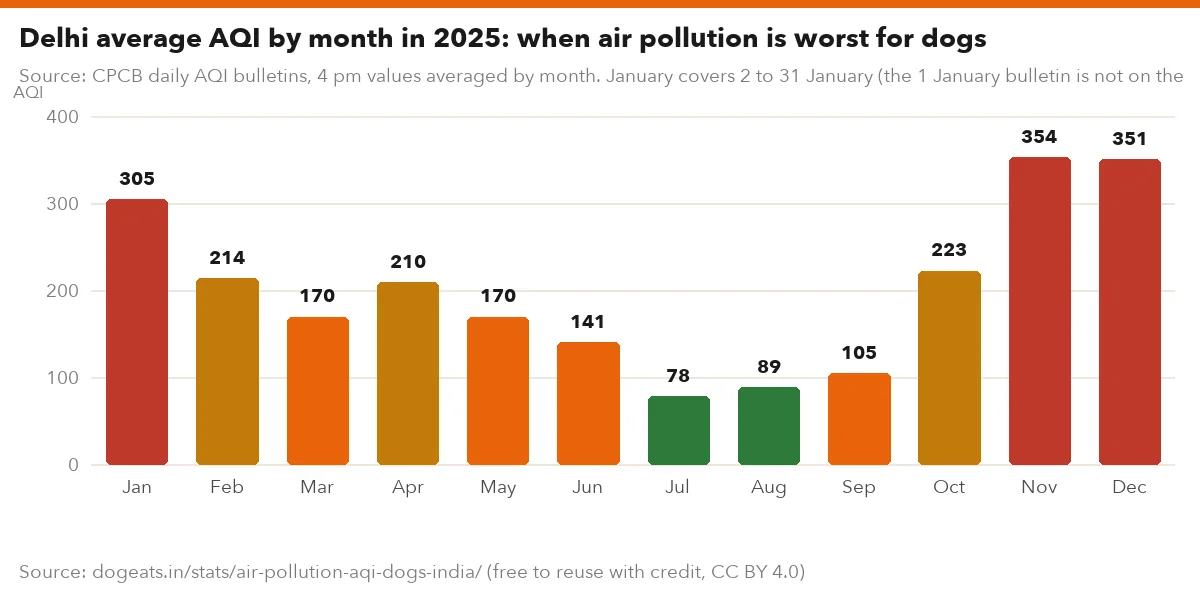
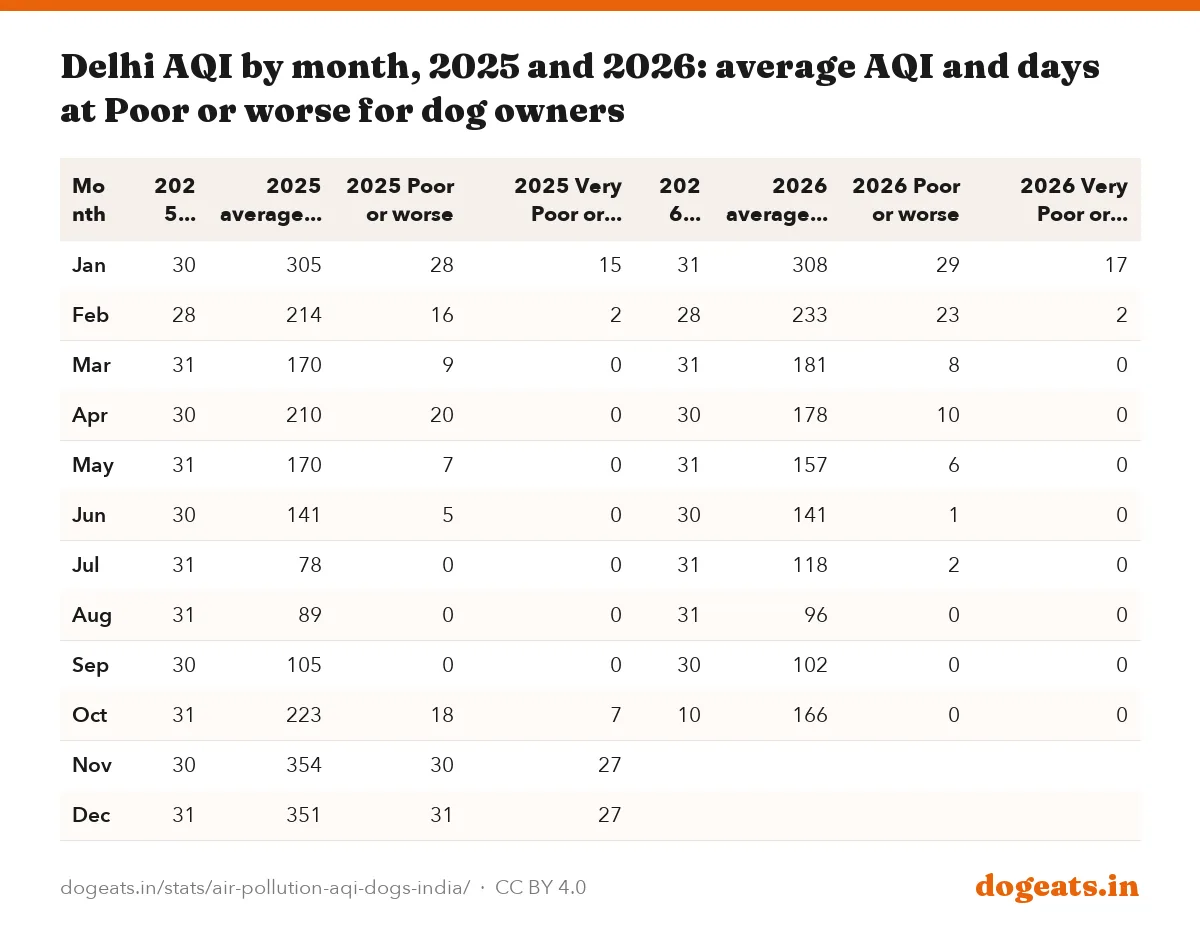
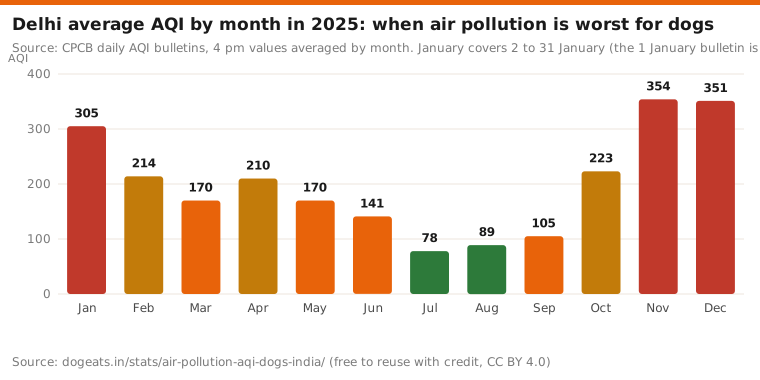
Very bad, and for about three months at a stretch. From 1 November 2025 to 31 January 2026, Delhi was Poor or worse on 90 of 92 days. It was Very Poor or Severe on 71 days and Severe on 10.
The average AQI across those 92 days was 337, inside the Very Poor band. November 2025 averaged 354 and December 351. January 2026 averaged 308.
The monsoon is the break. Delhi averaged 78 in July 2025 and had no Poor day from July to September 2025. In 2026 it had 2 Poor days in July and none in August or September.

Source: CPCB daily AQI bulletins, 4 pm values averaged by month. January covers 2 to 31 January (the 1 January bulletin is not on the CPCB site).
Show the numbers
| Label | AQI |
|---|---|
| Jan | 305 |
| Feb | 214 |
| Mar | 170 |
| Apr | 210 |
| May | 170 |
| Jun | 141 |
| Jul | 78 |
| Aug | 89 |
| Sep | 105 |
| Oct | 223 |
| Nov | 354 |
| Dec | 351 |
Embed this chart
| Month | 2025 days | 2025 average AQI | 2025 Poor or worse | 2025 Very Poor or Severe | 2026 days | 2026 average AQI | 2026 Poor or worse | 2026 Very Poor or Severe |
|---|---|---|---|---|---|---|---|---|
| Jan | 30 | 305 | 28 | 15 | 31 | 308 | 29 | 17 |
| Feb | 28 | 214 | 16 | 2 | 28 | 233 | 23 | 2 |
| Mar | 31 | 170 | 9 | 0 | 31 | 181 | 8 | 0 |
| Apr | 30 | 210 | 20 | 0 | 30 | 178 | 10 | 0 |
| May | 31 | 170 | 7 | 0 | 31 | 157 | 6 | 0 |
| Jun | 30 | 141 | 5 | 0 | 30 | 141 | 1 | 0 |
| Jul | 31 | 78 | 0 | 0 | 31 | 118 | 2 | 0 |
| Aug | 31 | 89 | 0 | 0 | 31 | 96 | 0 | 0 |
| Sep | 30 | 105 | 0 | 0 | 30 | 102 | 0 | 0 |
| Oct | 31 | 223 | 18 | 7 | 10 | 166 | 0 | 0 |
| Nov | 30 | 354 | 30 | 27 | ||||
| Dec | 31 | 351 | 31 | 27 |
Delhi's highest AQI of 2025 was 461, in the 14 December bulletin. Noida read 466 and Ghaziabad 459 the same day. In 2026 so far, Delhi peaked at 440 on 18 January.
April 2025 was a surprise: Delhi averaged 210 and had 20 Poor days. Dust and heat can push the index up outside winter too. Our heatwave and dog heatstroke report covers the summer risk.
Is Delhi's air getting better or worse for dogs?
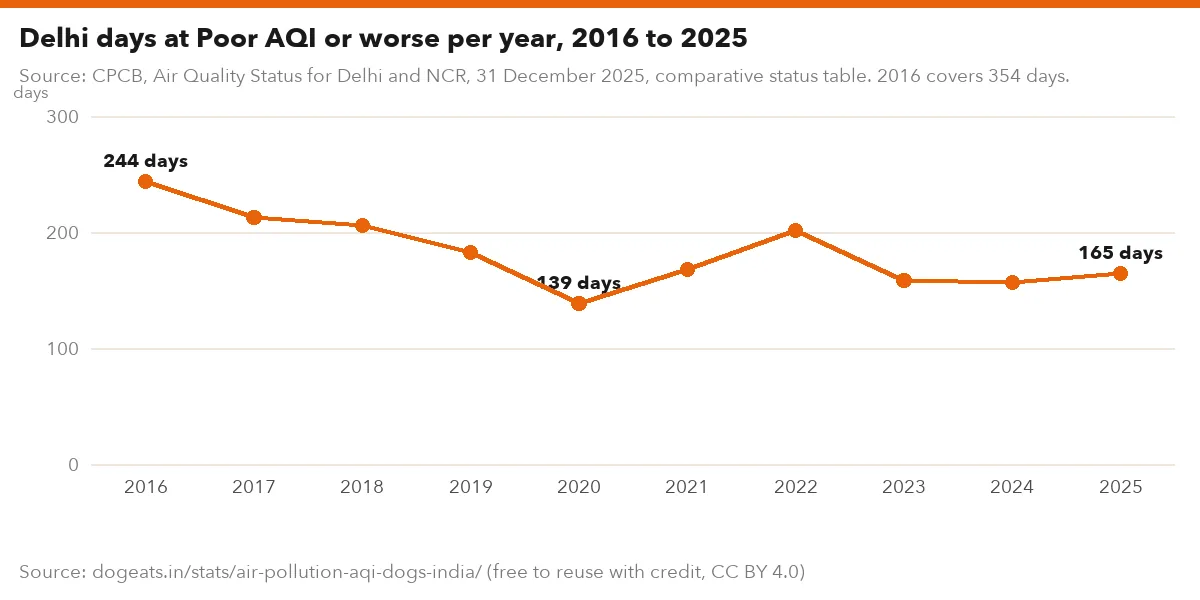
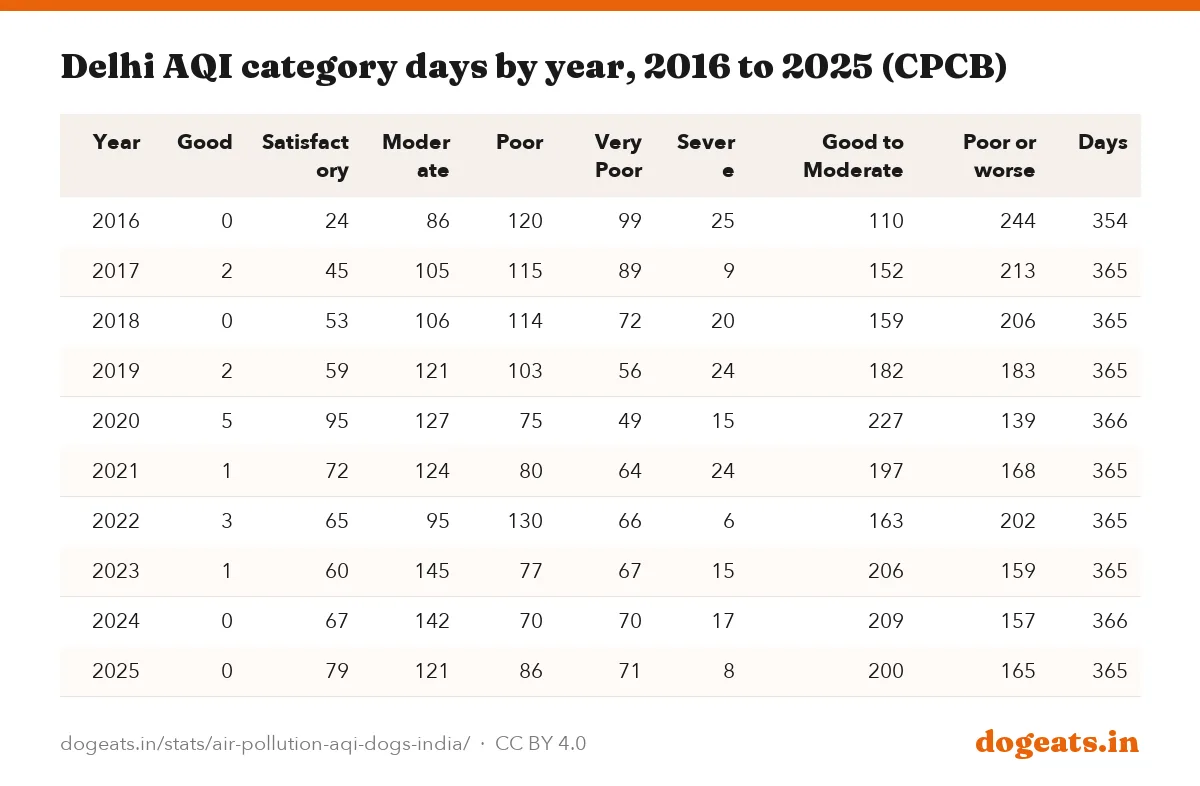
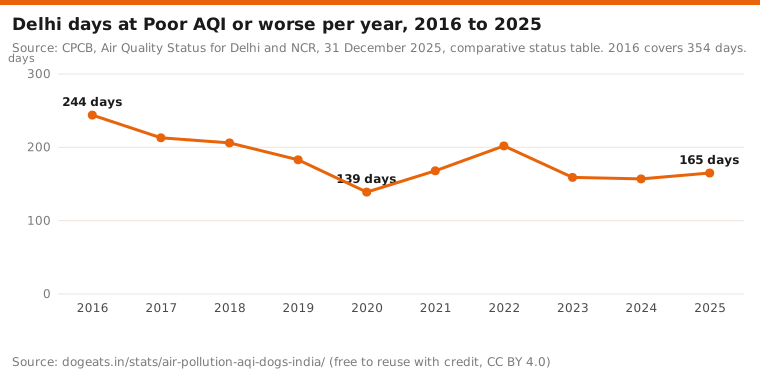
Better than a decade ago, but not steadily. CPCB counted 244 Poor-or-worse days in Delhi in 2016. That fell to 139 in 2020, the lockdown year, and stood at 165 in 2025.
The count of Good-to-Moderate days rose from 110 in 2016 to 200 in 2025. The 2025 count was 9 fewer than 2024's 209, so the gain is not a straight line.
Severe days fell to 8 in 2025, the fewest since 2022's 6. Delhi has had at most 5 Good days in any year since 2016, and none in 2024 or 2025.
Source: CPCB, Air Quality Status for Delhi and NCR, 31 December 2025, comparative status table. 2016 covers 354 days.
Show the numbers
| Label | days |
|---|---|
| 2016 | 244 days |
| 2017 | 213 days |
| 2018 | 206 days |
| 2019 | 183 days |
| 2020 | 139 days |
| 2021 | 168 days |
| 2022 | 202 days |
| 2023 | 159 days |
| 2024 | 157 days |
| 2025 | 165 days |
Embed this chart
| Year | Good | Satisfactory | Moderate | Poor | Very Poor | Severe | Good to Moderate | Poor or worse | Days |
|---|---|---|---|---|---|---|---|---|---|
| 2016 | 0 | 24 | 86 | 120 | 99 | 25 | 110 | 244 | 354 |
| 2017 | 2 | 45 | 105 | 115 | 89 | 9 | 152 | 213 | 365 |
| 2018 | 0 | 53 | 106 | 114 | 72 | 20 | 159 | 206 | 365 |
| 2019 | 2 | 59 | 121 | 103 | 56 | 24 | 182 | 183 | 365 |
| 2020 | 5 | 95 | 127 | 75 | 49 | 15 | 227 | 139 | 366 |
| 2021 | 1 | 72 | 124 | 80 | 64 | 24 | 197 | 168 | 365 |
| 2022 | 3 | 65 | 95 | 130 | 66 | 6 | 163 | 202 | 365 |
| 2023 | 1 | 60 | 145 | 77 | 67 | 15 | 206 | 159 | 365 |
| 2024 | 0 | 67 | 142 | 70 | 70 | 17 | 209 | 157 | 366 |
| 2025 | 0 | 79 | 121 | 86 | 71 | 8 | 200 | 165 | 365 |
This year is running slightly better. From 1 January to 30 September 2026, CPCB counted 194 Good-to-Moderate days in Delhi, against 187 in the same months of 2025. Poor-or-worse days fell from 86 to 79.
Sources describe 2025 differently. IANS, citing official data, gave Delhi's 2025 average AQI as 201, the lowest since 2018 apart from 2020. It put 2024 at 209, 2023 at 204 and 2018 at 225. Our average of 364 bulletins is 200.5, which agrees. Yet CPCB's own table shows 8 more Poor-or-worse days than in 2024.
What happens to AQI around Diwali?
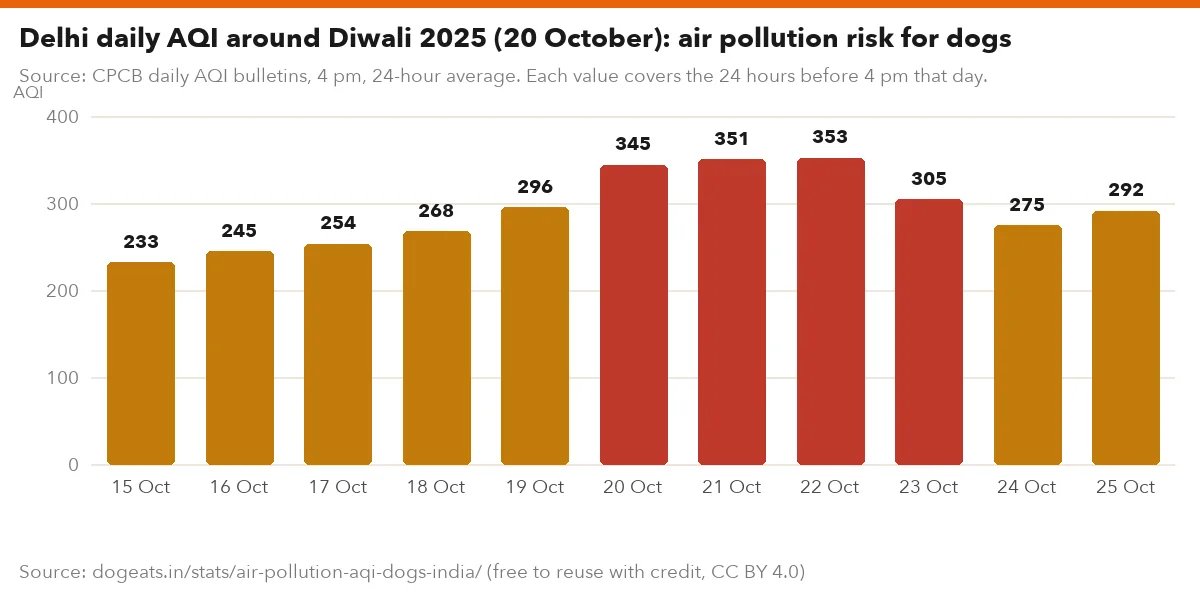
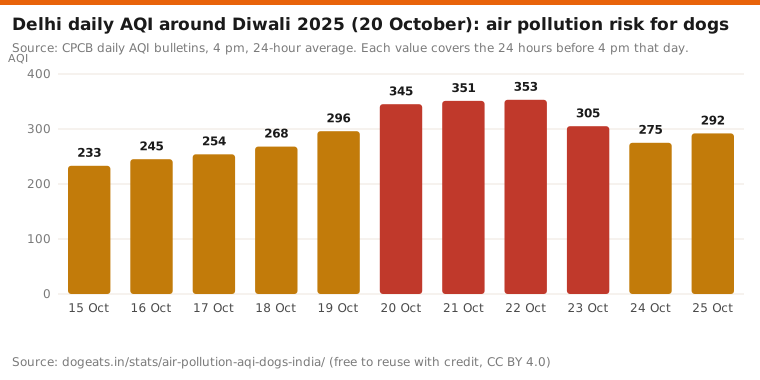
Diwali brings the year's sharpest one-day jump. Diwali fell on 20 October 2025. The next day's bulletin put 95 of 271 cities at Poor or worse, the most in any of the 647 bulletins we read.
Delhi climbed from 233 on 15 October to 345 on Diwali day, 351 on 21 October and 353 on 22 October. Gurugram hit 370 and Lucknow 250 on 21 October. Patna read 226.
Firecracker smoke comes with noise, which frightens many dogs. Our Diwali firecracker noise report has decibel data by city. Diwali in 2026 falls on Sunday, 8 November, deeper into the smog season.
Source: CPCB daily AQI bulletins, 4 pm, 24-hour average. Each value covers the 24 hours before 4 pm that day.
Show the numbers
| Label | AQI |
|---|---|
| 15 Oct | 233 |
| 16 Oct | 245 |
| 17 Oct | 254 |
| 18 Oct | 268 |
| 19 Oct | 296 |
| 20 Oct | 345 |
| 21 Oct | 351 |
| 22 Oct | 353 |
| 23 Oct | 305 |
| 24 Oct | 275 |
| 25 Oct | 292 |
Embed this chart
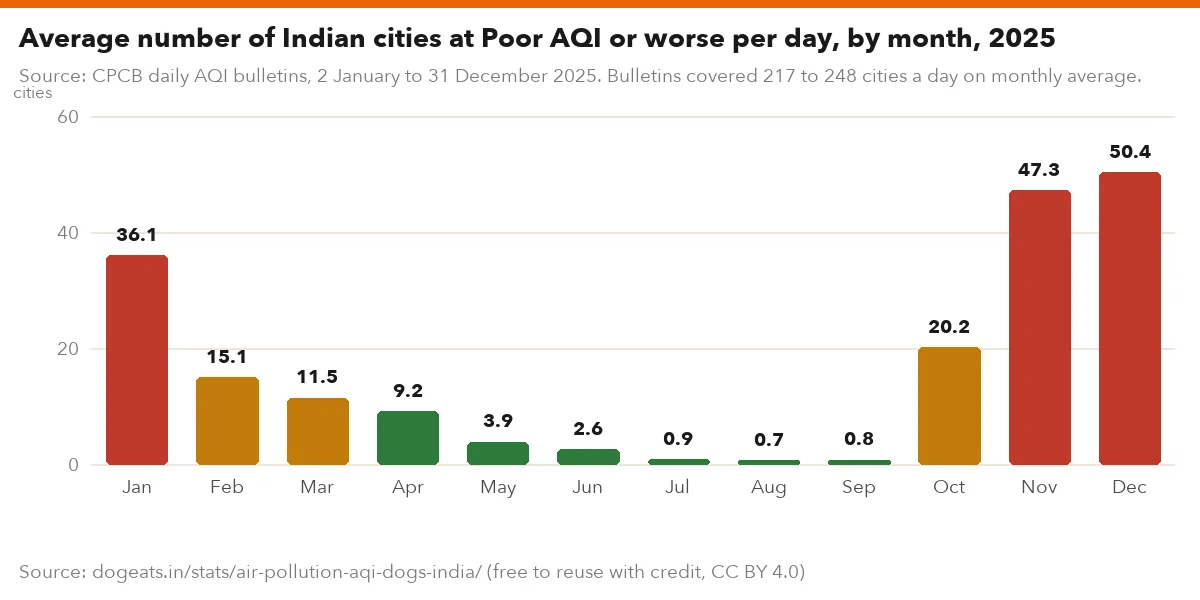
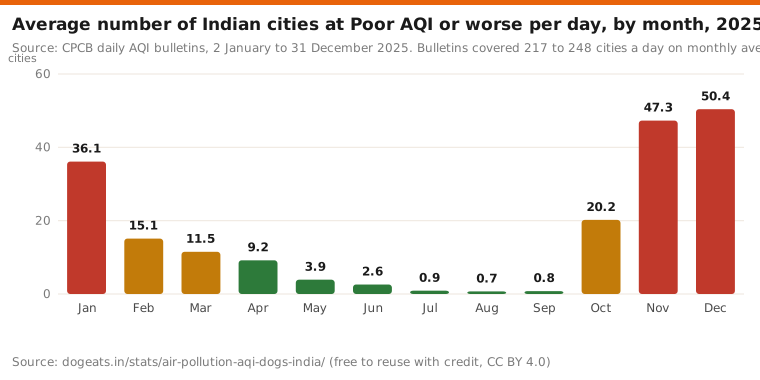
Source: CPCB daily AQI bulletins, 2 January to 31 December 2025. Bulletins covered 217 to 248 cities a day on monthly average.
Show the numbers
| Label | cities |
|---|---|
| Jan | 36.1 |
| Feb | 15.1 |
| Mar | 11.5 |
| Apr | 9.2 |
| May | 3.9 |
| Jun | 2.6 |
| Jul | 0.9 |
| Aug | 0.7 |
| Sep | 0.8 |
| Oct | 20.2 |
| Nov | 47.3 |
| Dec | 50.4 |
Embed this chart
Across India, December 2025 was the worst month. On an average December day, 50.4 cities were at Poor or worse, about 21% of those reporting. In August 2025 the average was 0.7 cities.
For dog owners, festival food is the other Diwali risk. See our Diwali dog food safety guide for sweets and leftovers.
Does air pollution harm dogs? What studies show
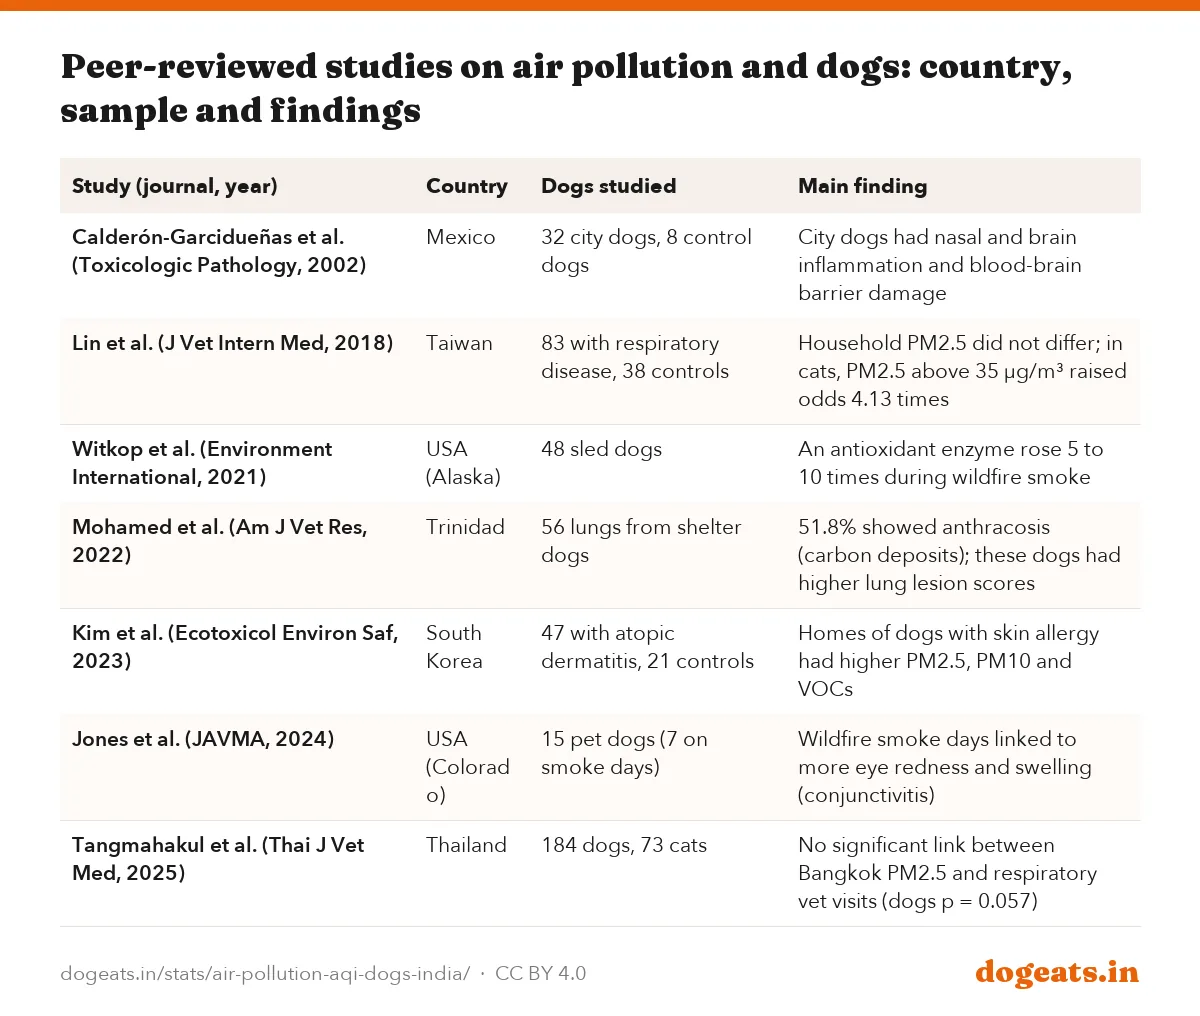
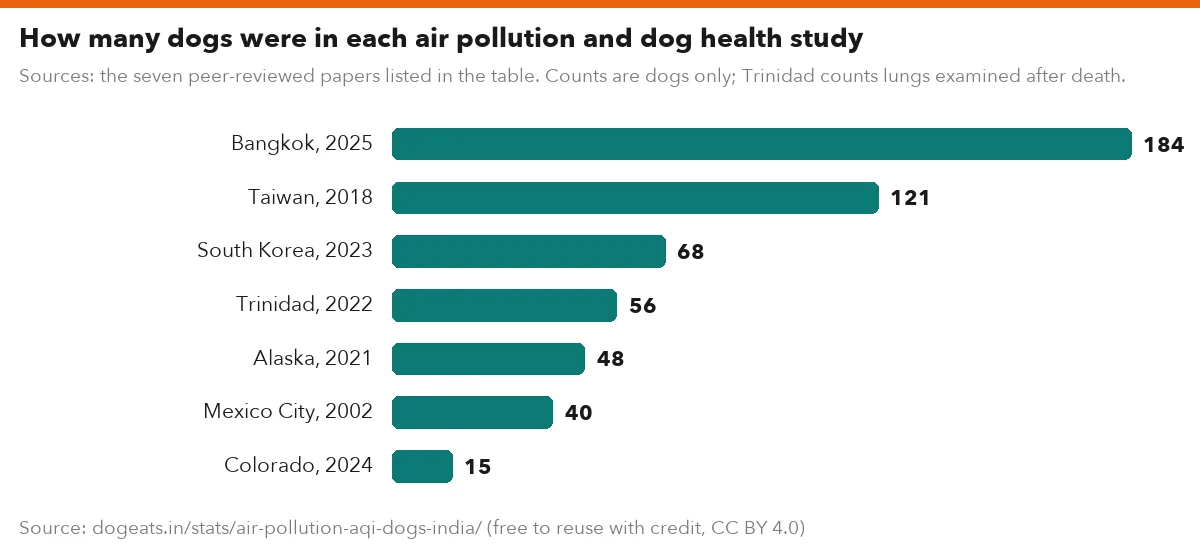
The evidence is small and mixed, and none of it is from India. A PubMed title search on 11 October 2026 found 17 papers on dogs and air pollution. None measured pollution's effect on pet dogs in India.
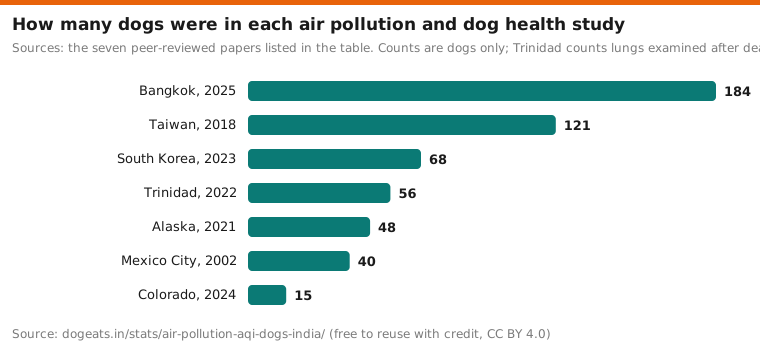
The strongest finding is old. In 2002, researchers compared 32 dogs from south-west Mexico City with 8 from cleaner Tlaxcala. City dogs showed inflammation in the nose and brain and damage to the blood-brain barrier.
Recent work on pet dogs is less clear. A 2018 Taiwan study of 83 dogs with respiratory disease and 38 controls found no difference in household PM2.5. Incense burning was more common among sick dogs, 30% against 13%, but not after adjusting for age, body weight and body condition.

| Study (journal, year) | Country | Dogs studied | Main finding |
|---|---|---|---|
| Calderón-Garcidueñas et al. (Toxicologic Pathology, 2002) | Mexico | 32 city dogs, 8 control dogs | City dogs had nasal and brain inflammation and blood-brain barrier damage |
| Lin et al. (J Vet Intern Med, 2018) | Taiwan | 83 with respiratory disease, 38 controls | Household PM2.5 did not differ; in cats, PM2.5 above 35 µg/m³ raised odds 4.13 times |
| Witkop et al. (Environment International, 2021) | USA (Alaska) | 48 sled dogs | An antioxidant enzyme rose 5 to 10 times during wildfire smoke |
| Mohamed et al. (Am J Vet Res, 2022) | Trinidad | 56 lungs from shelter dogs | 51.8% showed anthracosis (carbon deposits); these dogs had higher lung lesion scores |
| Kim et al. (Ecotoxicol Environ Saf, 2023) | South Korea | 47 with atopic dermatitis, 21 controls | Homes of dogs with skin allergy had higher PM2.5, PM10 and VOCs |
| Jones et al. (JAVMA, 2024) | USA (Colorado) | 15 pet dogs (7 on smoke days) | Wildfire smoke days linked to more eye redness and swelling (conjunctivitis) |
| Tangmahakul et al. (Thai J Vet Med, 2025) | Thailand | 184 dogs, 73 cats | No significant link between Bangkok PM2.5 and respiratory vet visits (dogs p = 0.057) |
Sources: the seven peer-reviewed papers listed in the table. Counts are dogs only; Trinidad counts lungs examined after death.
Show the numbers
| Label | dogs |
|---|---|
| Bangkok, 2025 | 184 |
| Taiwan, 2018 | 121 |
| South Korea, 2023 | 68 |
| Trinidad, 2022 | 56 |
| Alaska, 2021 | 48 |
| Mexico City, 2002 | 40 |
| Colorado, 2024 | 15 |
Embed this chart
The Colorado study used the US AQI scale, which is not the same as India's. Its smoke days averaged 103.7 on that scale. Even so, odds of worse eye swelling rose sharply against Good-AQI days.
The Mexico City study used mongrel dogs and the Trinidad study used shelter dogs. Neither tells us much about pampered house pets. Our street dog numbers by city show where most of them are.
Which dogs need the most care on high-AQI days?
Flat-faced breeds come first. Pugs, French Bulldogs, English Bulldogs, Shih Tzus and Pekingese have short airways that already strain in Indian heat. Our Pug guide and French Bulldog guide cover their breathing problems.
Age and weight matter too. In the 2018 Taiwan study, older age, lower body weight and higher body condition score predicted respiratory disease in dogs. Air pollution did not, once those were counted.
Working and very active breeds take in more air on long runs. On Poor days, swap a 5 km run for a short walk and a sniffing game at home. If a dog coughs, wheezes or tires quickly, see your vet.
- Check the CPCB AQI for your city before the morning and evening walk.
- On Poor (201 to 300) days, cut long runs and fetch sessions; keep walks short.
- On Very Poor (301 to 400) and Severe (401 and above) days, keep outdoor time to toilet breaks.
- Wipe your dog's face and paws after walks on smoggy days.
- Keep flat-faced, senior and overweight dogs indoors at peak smog hours, and ask your vet about any cough.
| City | Days reported | Good | Satisfactory | Moderate | Poor | Very Poor | Severe | Poor or worse | Average AQI | Highest AQI |
|---|---|---|---|---|---|---|---|---|---|---|
| Greater Noida | 283 | 4 | 32 | 120 | 92 | 34 | 1 | 127 | 194.1 | 402 |
| Ghaziabad | 283 | 4 | 53 | 110 | 85 | 29 | 2 | 116 | 185.0 | 458 |
| Gurugram | 283 | 0 | 50 | 125 | 87 | 21 | 0 | 108 | 183.6 | 394 |
| Noida | 283 | 2 | 44 | 150 | 68 | 17 | 2 | 87 | 173.5 | 430 |
| Delhi | 283 | 1 | 59 | 144 | 60 | 17 | 2 | 79 | 167.5 | 440 |
| Visakhapatnam | 272 | 9 | 79 | 164 | 19 | 1 | 0 | 20 | 121.6 | 302 |
| Kolkata | 283 | 81 | 129 | 59 | 14 | 0 | 0 | 14 | 84.2 | 266 |
| Guwahati | 282 | 72 | 135 | 64 | 11 | 0 | 0 | 11 | 85.4 | 294 |
| Bhopal | 283 | 47 | 104 | 121 | 11 | 0 | 0 | 11 | 97.5 | 242 |
| Lucknow | 283 | 31 | 122 | 122 | 8 | 0 | 0 | 8 | 102.6 | 261 |
| Nagpur | 283 | 67 | 111 | 97 | 8 | 0 | 0 | 8 | 91.0 | 261 |
| Jaipur | 283 | 3 | 99 | 175 | 6 | 0 | 0 | 6 | 116.4 | 257 |
| Chandigarh | 282 | 71 | 153 | 54 | 4 | 0 | 0 | 4 | 77.8 | 259 |
| Kanpur | 283 | 47 | 149 | 83 | 4 | 0 | 0 | 4 | 86.0 | 223 |
| Patna | 283 | 1 | 154 | 126 | 2 | 0 | 0 | 2 | 101.5 | 236 |
| Pune | 283 | 38 | 163 | 81 | 1 | 0 | 0 | 1 | 87.2 | 205 |
| Ahmedabad | 283 | 4 | 137 | 141 | 1 | 0 | 0 | 1 | 104.9 | 226 |
| Chennai | 283 | 38 | 197 | 47 | 1 | 0 | 0 | 1 | 78.4 | 204 |
| Mumbai | 283 | 87 | 139 | 57 | 0 | 0 | 0 | 0 | 70.5 | 145 |
| Bengaluru | 283 | 12 | 201 | 70 | 0 | 0 | 0 | 0 | 82.9 | 153 |
| Hyderabad | 283 | 50 | 229 | 4 | 0 | 0 | 0 | 0 | 69.1 | 105 |
For choosing a breed by city, see our best dog breeds by Indian city ranking.
How has 2026 gone so far?
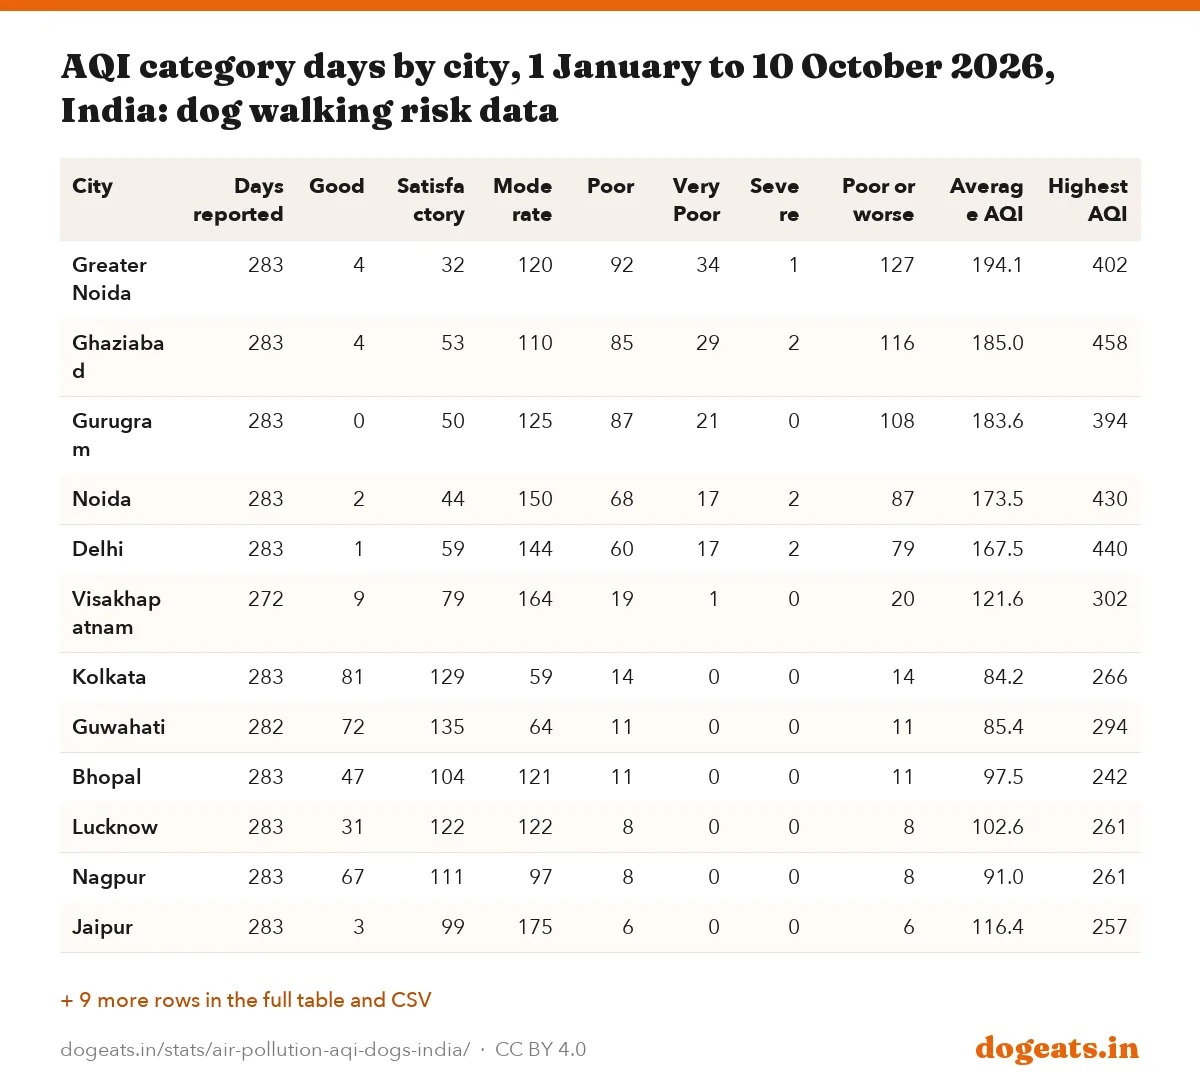
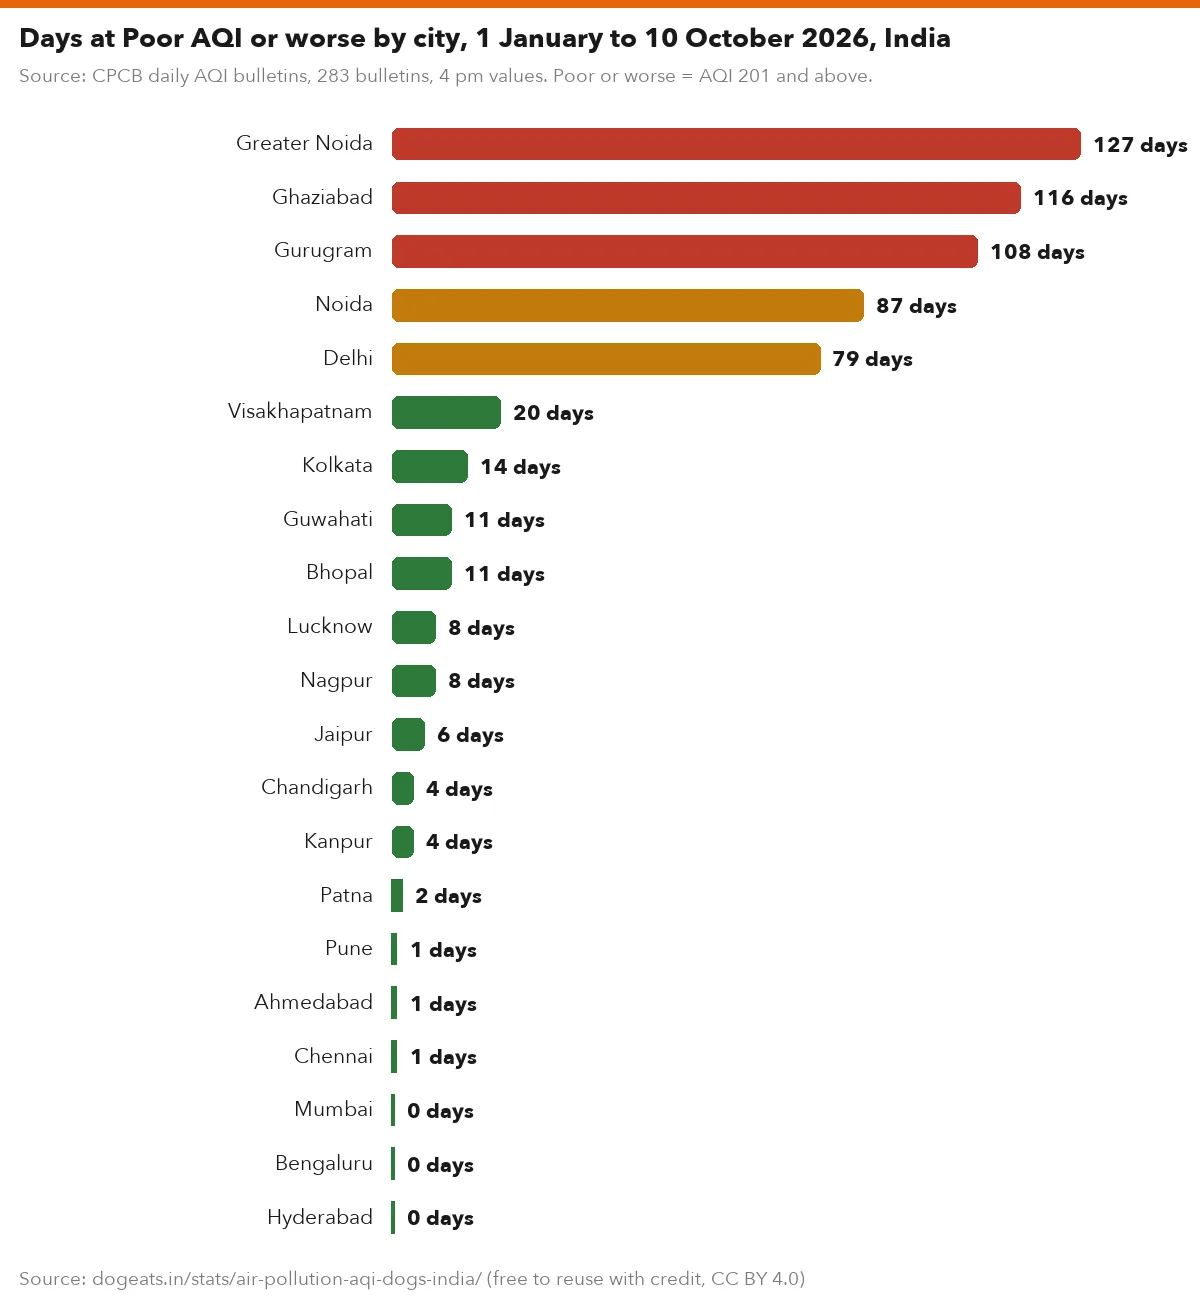
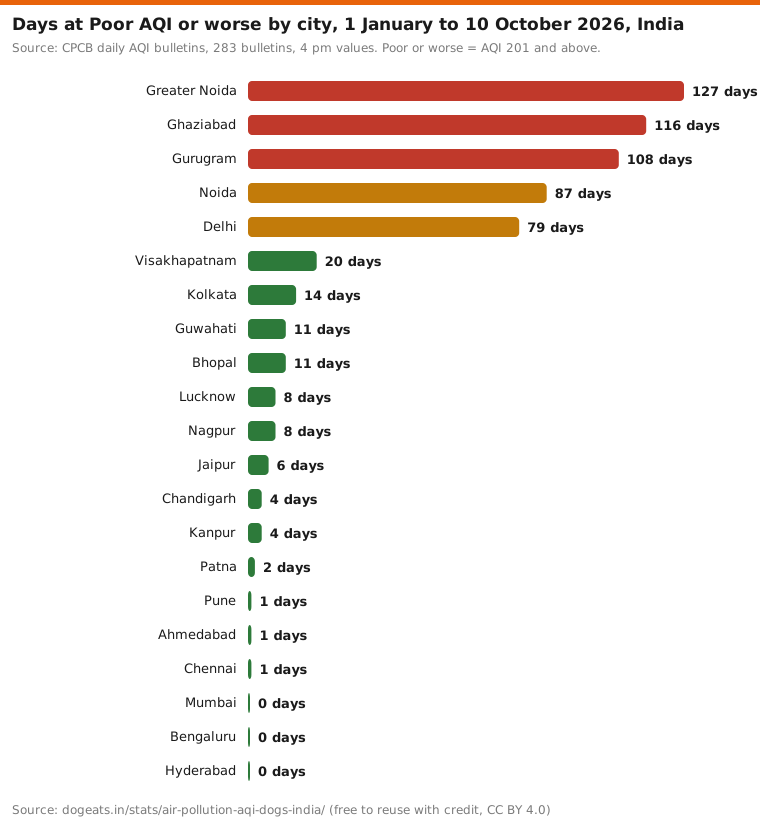
Cleaner than 2025 for most big cities. From 1 January to 10 October 2026, Greater Noida had the most Poor-or-worse days among 21 large cities, at 127 of 283 bulletins. Ghaziabad had 116 and Gurugram 108.
Delhi had 79 such days and an average AQI of 167.5. Patna dropped to 2 Poor days, from 54 in all of 2025. Chandigarh dropped to 4, from 43.
Mumbai, Bengaluru and Hyderabad have had no Poor day in 2026. Chennai, Pune and Ahmedabad have had one each. The smog season starts again in late October.
Source: CPCB daily AQI bulletins, 283 bulletins, 4 pm values. Poor or worse = AQI 201 and above.
Show the numbers
| Label | days |
|---|---|
| Greater Noida | 127 days |
| Ghaziabad | 116 days |
| Gurugram | 108 days |
| Noida | 87 days |
| Delhi | 79 days |
| Visakhapatnam | 20 days |
| Kolkata | 14 days |
| Guwahati | 11 days |
| Bhopal | 11 days |
| Lucknow | 8 days |
| Nagpur | 8 days |
| Jaipur | 6 days |
| Chandigarh | 4 days |
| Kanpur | 4 days |
| Patna | 2 days |
| Pune | 1 days |
| Ahmedabad | 1 days |
| Chennai | 1 days |
| Mumbai | 0 days |
| Bengaluru | 0 days |
| Hyderabad | 0 days |
Embed this chart
| City | Days reported | Poor or worse | Very Poor or Severe | Average AQI |
|---|---|---|---|---|
| Delhi | 364 | 164 | 78 | 200.5 |
| Gurugram | 334 | 148 | 32 | 184.3 |
| Ghaziabad | 364 | 134 | 68 | 185.9 |
| Greater Noida | 363 | 113 | 49 | 179.8 |
| Bhiwadi | 362 | 111 | 32 | 162.5 |
| Noida | 364 | 105 | 64 | 177.3 |
| Hajipur | 328 | 94 | 10 | 155.5 |
| Hapur | 348 | 90 | 37 | 143.7 |
| Meerut | 364 | 88 | 38 | 147.7 |
| Bulandshahr | 363 | 87 | 19 | 148.4 |
| Sri Ganganagar | 355 | 85 | 3 | 154.7 |
| Muzaffarnagar | 353 | 83 | 24 | 143.4 |
| Mandideep | 324 | 78 | 4 | 141.3 |
| Baddi | 361 | 71 | 11 | 155.1 |
| Angul | 350 | 71 | 11 | 132.7 |
For a wider look at which cities suit dogs, our most pet-friendly cities index combines air, heat, vets and other public data.
Frequently asked questions
What AQI is safe for dogs?
India has no official AQI limit for dogs. CPCB rates 0 to 100 as Good or Satisfactory, with minimal or minor effects on people. From 201 (Poor) upward it warns of breathing discomfort on prolonged exposure. Treat 201 and above as a day for short walks, and ask your vet about dogs with breathing problems.
Is AQI 300 bad for dogs?
An AQI of 300 is at the top of CPCB's Poor band (201 to 300). CPCB says this level causes breathing discomfort to most people on prolonged exposure. No study has set a dog-specific limit, so keep walks short and skip long runs at that level.
Should I walk my dog in Delhi in winter?
Yes, but keep walks short on bad days. From 1 November 2025 to 31 January 2026, Delhi was Poor or worse on 90 of 92 days, with an average AQI of 337. Toilet breaks and brief walks, plus indoor play, suit Very Poor and Severe days.
Which Indian cities have the cleanest air for dogs?
Among 21 large cities, Bengaluru, Chennai and Hyderabad had no Poor-AQI day in 2025, per CPCB bulletins. Mumbai had one. Bengaluru's average AQI of 74.9 was the lowest of the 21.
How many bad air days did Delhi have in 2025?
CPCB counted 165 days at Poor, Very Poor or Severe AQI in Delhi in 2025: 86 Poor, 71 Very Poor and 8 Severe. There were 200 days at AQI 200 or less, and no Good day.
Does air pollution affect dogs?
Studies abroad suggest it can. A 2002 Mexico City study found brain and nasal inflammation in 32 city dogs, and a 2024 Colorado study linked smoke days to conjunctivitis in pet dogs. A 2018 Taiwan study found no link between household PM2.5 and respiratory disease in dogs. No Indian study has measured it.
Is Diwali smoke bad for dogs?
Diwali night sharply worsens air across India. The 21 October 2025 bulletin, the day after Diwali, put 95 of 271 cities at Poor or worse, and Delhi read 351. Keep dogs indoors with windows closed, and ask your vet if a dog seems distressed.
Do air purifiers help dogs?
No study we found tested purifiers on dog health. A 2023 Korean study did find higher indoor PM2.5 and PM10 in homes of dogs with skin allergy. Keeping windows shut during smog peaks and cleaning indoor air may help, but ask your vet for dogs with airway or skin disease.
Methodology and limitations
We downloaded every CPCB national AQI bulletin from 2 January 2025 to 10 October 2026 from cpcb.gov.in, 647 PDFs in all, on 11 October 2026. The 1 January 2025 bulletin returned 'not found'. Each bulletin gives every reporting city's 24-hour average AQI at 4 pm, its category and the stations that reported.
A script extracted all city rows, including names that wrap across two lines. We checked that the number of rows matched each bulletin's last serial number in all 647 files. Every AQI value fell inside the range of its stated category. We counted days by category for each city and averaged the AQI values.
Delhi's yearly figures for 2016 to 2025 come from CPCB's Air Quality Status for Delhi and NCR report of 31 December 2025. Its 2025 counts match ours once 1 January 2025 is added: that day Delhi read 328, Very Poor, per CPCB's NCR report of 1 January 2025. The January to September comparison uses the NCR report of 30 September 2026.
Poor or worse means an AQI of 201 or more. City averages are simple means of daily values. Cities with fewer bulletins, such as Faridabad in 2025, have lower counts partly because data was missing.
For studies, we searched PubMed titles for dogs or canine with air pollution, particulate matter or PM2.5 on 11 October 2026, and read the abstracts of the papers cited. The walking guidance in the first table is dogeats.in advice based on CPCB's human health statements, not an official standard.
Sources
- CPCB National Air Quality Index daily bulletin (example: 10 October 2026); 647 bulletins from 2 January 2025 to 10 October 2026, City AQI values and categories, CPCB health statements
- CPCB, Air Quality Status for Delhi and NCR, 31 December 2025, Delhi AQI category days by year, 2016 to 2025
- Lin et al., Association between indoor air pollution and respiratory disease in companion dogs and cats, J Vet Intern Med 2018;32(3):1259-1267, Taiwan dog and cat case-control results
- Also consulted: CPCB, Air Quality Status for Delhi and NCR, 30 September 2026, CPCB, Air Quality Status for Delhi and NCR, 1 January 2025, Calderón-Garcidueñas et al., Air pollution and brain damage, Toxicologic Pathology 2002;30(3):373-389, Jones et al., Particulate matter from wildfire smoke in northern Colorado appears to be associated with conjunctivitis in dogs, JAVMA 2024, Mohamed et al., A pilot study on the lung morphology of shelter dogs in relation to air pollution in Trinidad, Am J Vet Res 2022, Kim et al., Indoor particulate matter induces epigenetic changes in companion atopic dogs, Ecotoxicol Environ Saf 2023, Witkop et al., Sled dogs as a model for PM2.5 exposure from wildfires in Alaska, Environment International 2021, Tangmahakul et al., Thai Journal of Veterinary Medicine 2025;55(2), IANS, 31 December 2025, citing official data, DoPT list of central government holidays 2026 (Diwali on 8 November 2026).
Cite, embed and download
This report, its data and its images are free to reuse under a Creative Commons Attribution 4.0 licence. Credit dogeats.in with a link to this page. Every chart has its own embed code, every table has a CSV and an image download, and the images below are ready for social posts, slides and articles.
Cite this report
Link to this report
Every chart and table as an image